. 2023 Sep;26(9):1603-1612.
doi: 10.1038/s41593-023-01410-8. Epub 2023 Aug 21.

A stable and replicable neural signature of lifespan adversity in the adult brain

Collaborators, Affiliations

A stable and replicable neural signature of lifespan adversity in the adult brain

Nathalie E Holz et al. Nat Neurosci. 2023 Sep.

Abstract

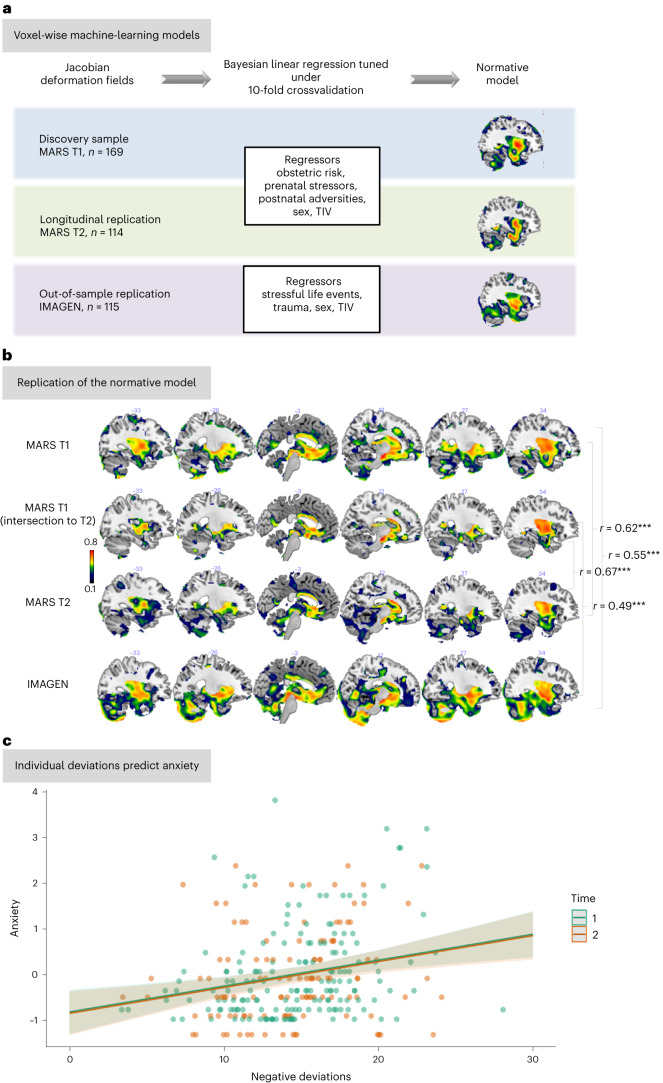
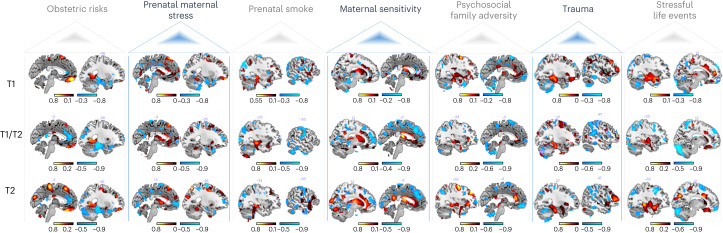
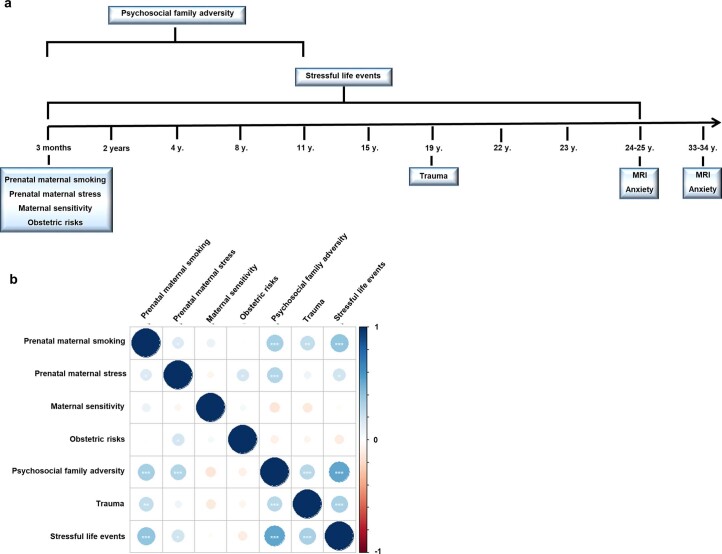
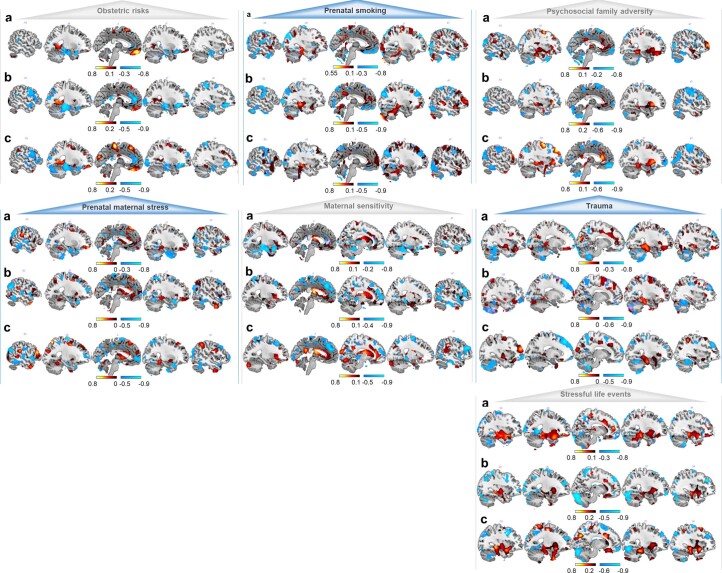
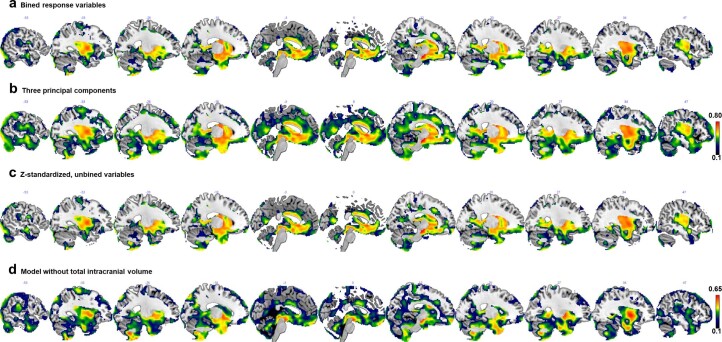
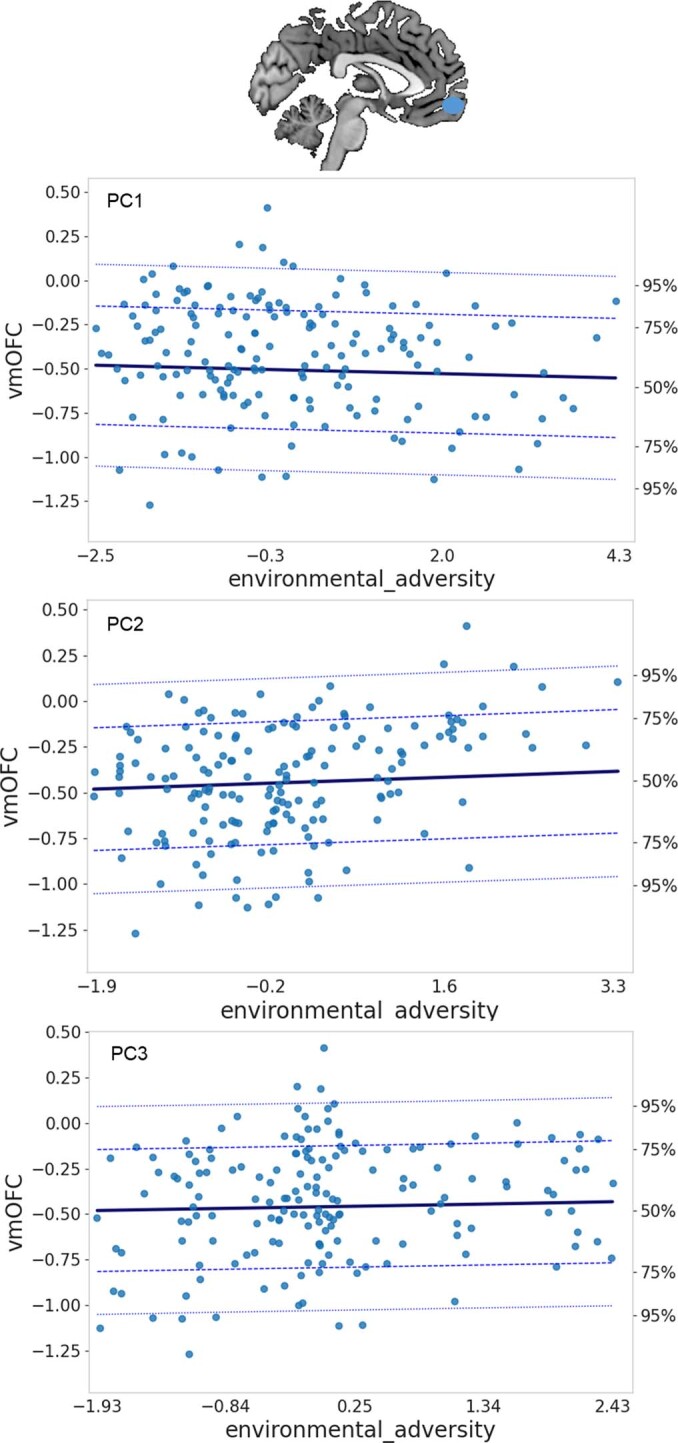
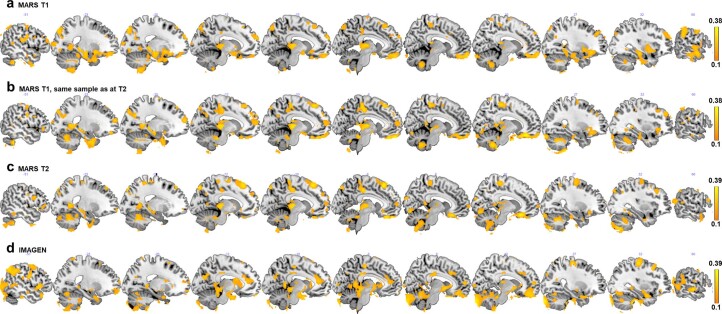
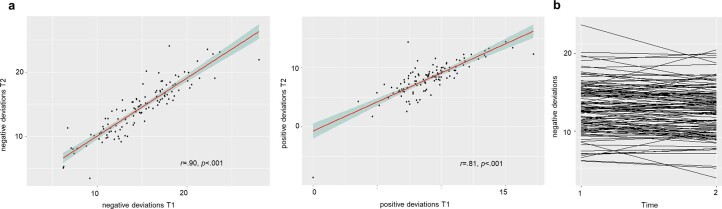
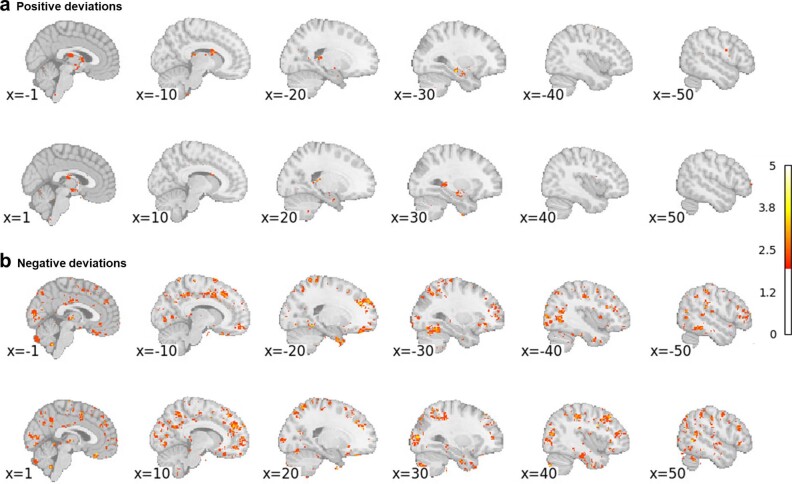
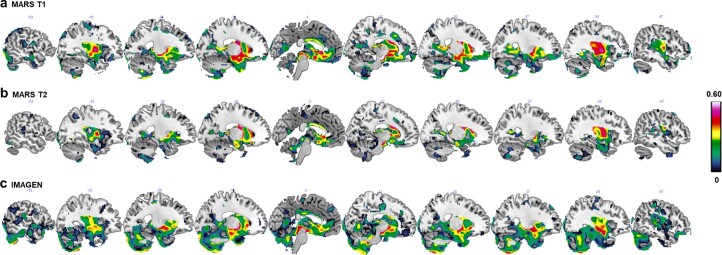
Environmental adversities constitute potent risk factors for psychiatric disorders. Evidence suggests the brain adapts to adversity, possibly in an adversity-type and region-specific manner. However, the long-term effects of adversity on brain structure and the association of individual neurobiological heterogeneity with behavior have yet to be elucidated. Here we estimated normative models of structural brain development based on a lifespan adversity profile in a longitudinal at-risk cohort aged 25 years (n = 169). This revealed widespread morphometric changes in the brain, with partially adversity-specific features. This pattern was replicated at the age of 33 years (n = 114) and in an independent sample at 22 years (n = 115). At the individual level, greater volume contractions relative to the model were predictive of future anxiety. We show a stable neurobiological signature of adversity that persists into adulthood and emphasize the importance of considering individual-level rather than group-level predictions to explain emerging psychopathology.


Conflict of interest statement

T.B. served in an advisory or consultancy role for eye level, Infectopharm, Lundbeck, Medice, Neurim Pharmaceuticals, Oberberg GmbH, Roche and Takeda. He received conference support or speaker’s fee from Janssen, Medice and Takeda. L.P. served in an advisory or consultancy role for Roche and Viforpharm and received speaker’s fee from Shire. She received royalties from Hogrefe, Kohlhammer and Schattauer. C.F.B. is cofounder and director of SBGneuro. The present work is unrelated to the above grants and relationships. The other authors report no potential conflicts of interest.

Figures

Fig. 1
Fig. 1. Normative models based on adversity.
a, Methodological approach—we estimated a voxel-wise normative model of the development of JDs of the deformation fields, which quantifies the degree of volumetric expansion or contraction required to match each sample to the template used in registration (outcome), based on lifetime adversities, TIV and sex as predictors in the MARS sample when participants were 25 years old. Therefore, we performed a Bayesian linear regression under tenfold cross-validation. We replicated this normative model in the MARS sample at the age of 33–34 years and using the sociodemographically similar IMAGEN subsample aged 22 years with comparable adversity measures. b, Spatial representation of the voxel-wise Pearson correlations (two-sided) between the true morphometric changes of the JDs and the predicted values in the normative models built on adversities, sex and TIV. First panel: normative model of MARS participants (n = 169) at the age of 25 years (T1; brain regions listed in Supplementary Table 1); second panel: normative model of MARS participants (n = 114) at the age of 25 years (intersection of participants from the 25-year and 33-year assessments); third panel: replication of the normative model of MARS individuals (n = 114) scanned again at the age of 33–34 years (T2, brain regions listed in Supplementary Table 3); fourth panel: replication of this model in a subsample (n = 115) of the IMAGEN cohort (22 years, brain regions listed in Supplementary Table 5). c, Negative deviations per subject, that is, more volume contractions than expected from the normative model, predicted anxiety at 25 years (T1, β coefficient = 0.07, standard error (s.e.) = 0.02, P = 0.00006 (two-sided), η2 = 0.10) and at 33 years (T1 and T2, β coefficient = 0.06, s.e. = 0.02, P = 0.0005 (two-sided), η2 = 0.06). Triple asterisks indicate that the Pearson correlation was significant at P < 0.001, two-sided. The shaded area represents the 95% confidence interval of the predicted values. Source data
Fig. 2
Fig. 2. Spatial representation of the structure coefficients.
These indicate the correlation between each adversity and the predicted morphometric changes of the JDs of deformation fields. Shown is one sample slice of the top 2% of the voxel-wise contribution for the positive (hot colors) and the negative associations (cold colors). Top, 169 MARS participants at the age of 25 years (T1); middle, 114 MARS participants at the age of 25 (intersection of participants from the 25-year (T1) and 33-year assessments (T2)); and bottom, 114 MARS individuals scanned again at the age of 33 years (T2). More slices of these structure coefficients and the structure coefficients of the IMAGEN sample are shown in Extended Data Fig. 2 and Supplementary Fig. 4, respectively, and all brain regions are listed in Supplementary Tables 7–20. Source data
Fig. 3
Fig. 3. Predictions of how brain morphometry (Jacobian determinants of deformation fields) changes as a function of adversity.
Spatial representation of the voxel-wise normative models for each of the PCs based on four sampling points spanning the range of the PC loadings. The panels show the β values (slopes) depicting the change, with warm colors indicating a volume expansion and cold colors indicating a volume contraction with increasing adversity. The adversity maps are shown relative to the baseline model. Source data
Fig. 4
Fig. 4. Age-related JD development.
The data were split into training and test sets, and normative models were fit to predict JD development based on age, sex and site by using a warped Bayesian linear regression model. Explained variance in the full test set and visualizations for all regional age-related trajectories (green = females and blue = males; centiles of variation correspond to 1%, 5%, 25%, 50%, 75%, 95% and 99%) are depicted. For each region, the trajectory for only one sex is shown, but trajectories were similar for both sexes. Source data
Extended Data Fig. 1
Extended Data Fig. 1. Study design.
a, MARS assessments, b, Spearman correlation plot (* p < 0.05, ** p < 0.01, *** p < 0.001, two-sided, not adjusted for multiple comparisons).
Extended Data Fig. 2
Extended Data Fig. 2. MARS structure coefficients.
Spatial representations of the top 2% of the voxel-wise contribution of each adversity on predicted morphometric changes identified based on structure coefficients for a, 169 MARS participants at the age of 25, b, 114 MARS participants at the age of 25 (intersection of participants from the 25 year and 33 year- assessment), c, 114 MARS individuals scanned again at the age of 33 years.
Extended Data Fig. 3
Extended Data Fig. 3. Sensitivity analyses.
Spatial representations of the voxel-wise reference models built on a, adversity, total intracranial volume (TIV), and sex; b, on three principal components, TIV, and sex, and c, on z-standardized unbinned adversity scores, TIV, sex; d, on binned adversity scores and sex (without total intracranial volume), via Bayesian linear regression under 10-fold crossvalidation in n = 169 MARS participants at the age of 25.
Extended Data Fig. 4
Extended Data Fig. 4. Trajectory of the vmOFC.
Structure alterations as a function of the three principal components.
Extended Data Fig. 5
Extended Data Fig. 5. Normative models based on adversity.
Spatial representation of the voxel-wise reference models built on adversity only via Bayesian linear regression under 10-fold crossvalidation. a, 169 MARS participants at the age of 25; b, 114 MARS participants at the age of 25 (intersection of participants from the 25 year and 33 year- assessments); c, 114 MARS individuals scanned again at the age of 33 years; d, replication of this model in a subsample (n = 115) with similar sociodemographics of the IMAGEN cohort.
Extended Data Fig. 6
Extended Data Fig. 6. Structure coefficient of age-related development.
Spatial representation of the top 2% of the voxel-wise contribution of the correlation of age with predicted morphometric changes.
Extended Data Fig. 7
Extended Data Fig. 7. Individual deviations.
a, Pearson correlations (two-sided) between time points for negative (volume contractions, left, exact p = 2.372827e-41) and for positive deviations (volume expansions, right, exact p = 4.159398e-27) at the 25-year assessment (T1) and 33-year assessment (T2) with 95% confidence intervals, b, spaghetti plot showing the change of the negative deviations between both time points.
Extended Data Fig. 8
Extended Data Fig. 8. Spatial representation of the individual deviations.
Percentage of deviations (positive deviations (a) and negative deviations (b)) from the normative model at each brain locus.
Extended Data Fig. 9
Extended Data Fig. 9. Psychopathology distribution in the MARS.
The plots depict the distribution of anxiety (T1: range: 0-10, median: 2; T2: range: 0-10, median: 3), depression (T1: range: 0-14, median: 1, T2: range: 0-19, median: 2), attention (T1: range: 0-7, median: 1, T2: range: 0-20, median: 4) and aggression (T1: range: 0-12, median: 1, T2: range: 0-20, median: 2) at both time points (T1: n = 169, T2: n = 114). Box limits indicate the range of the central 50% of the data, with a central line marking the median value and whiskers extending a maximum of 1.5 times the Interquartile Range from the upper (75%) and the lower (25%) quartiles. Outliers beyond the whiskers are represented as individual data points.
Extended Data Fig. 10
Extended Data Fig. 10. Spatial distribution of explained variance.
Normative model based lifetime adversity, sex and TIV in a, the MARS sample at T1, b, the MARS sample at T2 and c, the IMAGEN sample.

Similar articles

Cited by

References

    1. Kessler RC, et al. Childhood adversities and adult psychopathology in the WHO World Mental Health Surveys. Br. J. Psychiatry. 2010;197:378–385. - PMC - PubMed
    1. Green JG, et al. Childhood adversities and adult psychiatric disorders in the national comorbidity survey replication I: associations with first onset of DSM-IV disorders. Arch. Gen. Psychiatry. 2010;67:113–123. - PMC - PubMed
    1. McCrory EJ, Viding E. The theory of latent vulnerability: reconceptualizing the link between childhood maltreatment and psychiatric disorder. Dev. Psychopathol. 2015;27:493–505. - PubMed
    1. Holz NE, et al. Early social adversity, altered brain functional connectivity, and mental health. Biol. Psychiatry. 2023;93:430–441. - PubMed
    1. Holz NE, Tost H, Meyer-Lindenberg A. Resilience and the brain: a key role for regulatory circuits linked to social stress and support. Mol. Psychiatry. 2020;25:379–396. - PubMed

Publication types