. 2023 Aug 21;14(1):5062.
doi: 10.1038/s41467-023-40569-3.

Genetic analysis of blood molecular phenotypes reveals common properties in the regulatory networks affecting complex traits

Andrew A Brown  1 Juan J Fernandez-Tajes  2 Mun-Gwan Hong  3 Caroline A Brorsson  4   5 Robert W Koivula  6 David Davtian  1 Théo Dupuis  1 Ambra Sartori  7   8   9 Theodora-Dafni Michalettou  10 Ian M Forgie  1 Jonathan Adam  11   12 Kristine H Allin  13 Robert Caiazzo  14 Henna Cederberg  15 Federico De Masi  4 Petra J M Elders  16 Giuseppe N Giordano  17 Mark Haid  18 Torben Hansen  13 Tue H Hansen  13 Andrew T Hattersley  19 Alison J Heggie  20 Cédric Howald  7   8   9 Angus G Jones  19 Tarja Kokkola  15 Markku Laakso  15 Anubha Mahajan  2 Andrea Mari  21 Timothy J McDonald  22 Donna McEvoy  23 Miranda Mourby  24 Petra B Musholt  25 Birgitte Nilsson  4 Francois Pattou  14 Deborah Penet  7   8   9 Violeta Raverdy  14 Martin Ridderstråle  26 Luciana Romano  7   8   9 Femke Rutters  27 Sapna Sharma  12   28 Harriet Teare  29 Leen 't Hart  27   30   31 Konstantinos D Tsirigos  4 Jagadish Vangipurapu  15 Henrik Vestergaard  13   32 Søren Brunak  4   5 Paul W Franks  17 Gary Frost  33 Harald Grallert  11   12 Bernd Jablonka  34 Mark I McCarthy  2   35 Imre Pavo  36 Oluf Pedersen  37   38 Hartmut Ruetten  34 Mark Walker  39 DIRECT ConsortiumJerzy Adamski  40   41   42 Jochen M Schwenk  3 Ewan R Pearson  1 Emmanouil T Dermitzakis #  43   44   45 Ana Viñuela #  46
Collaborators, Affiliations

Genetic analysis of blood molecular phenotypes reveals common properties in the regulatory networks affecting complex traits

Andrew A Brown et al. Nat Commun. .

Abstract

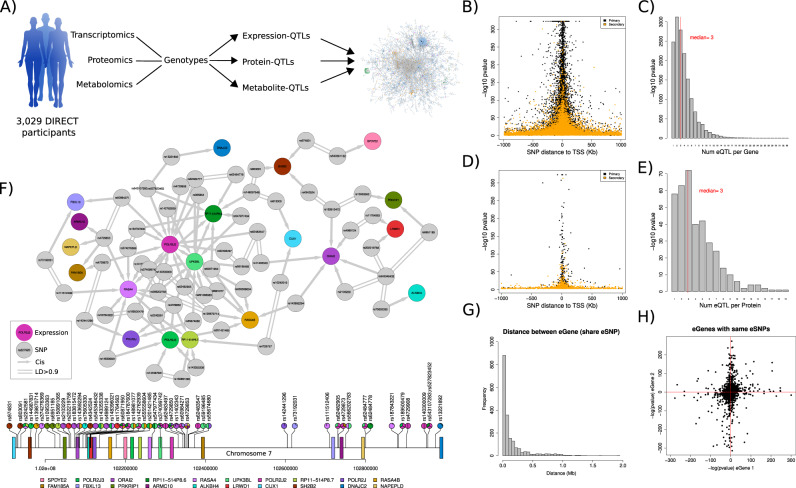
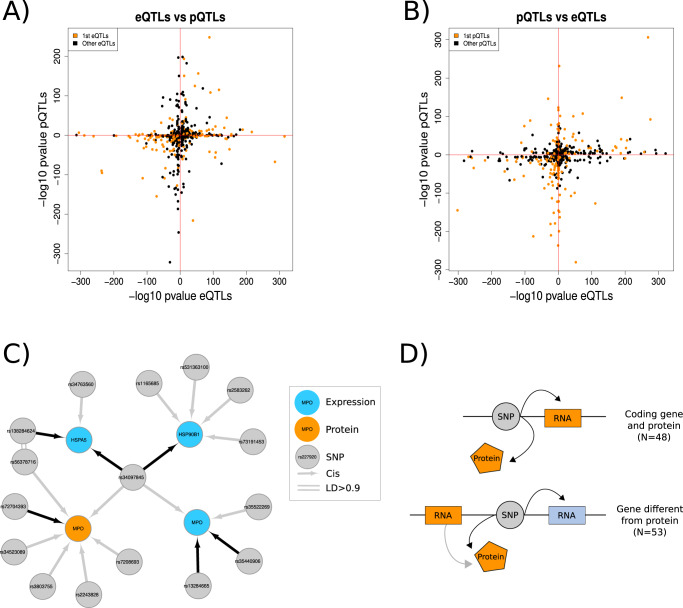
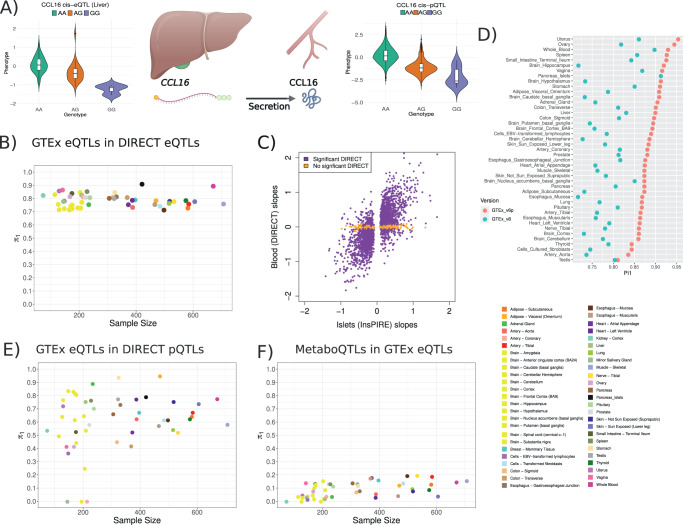
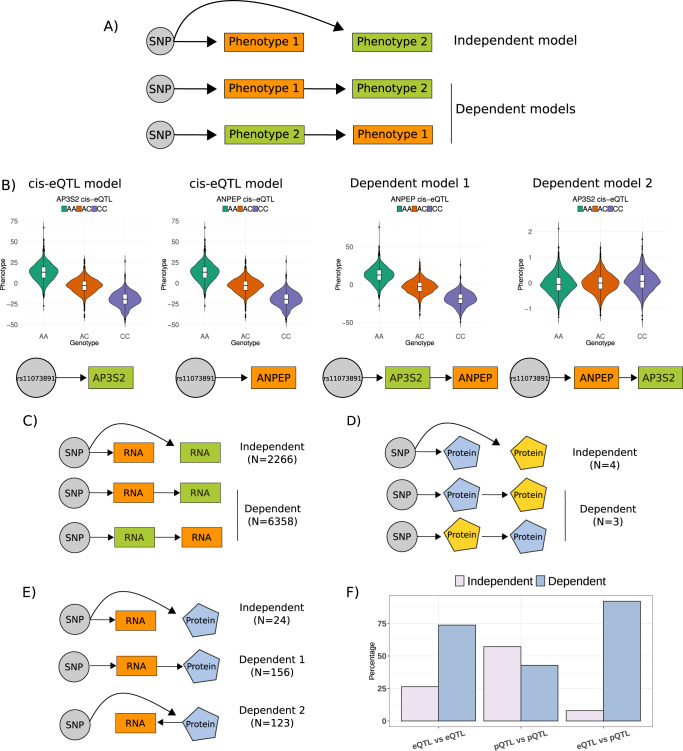
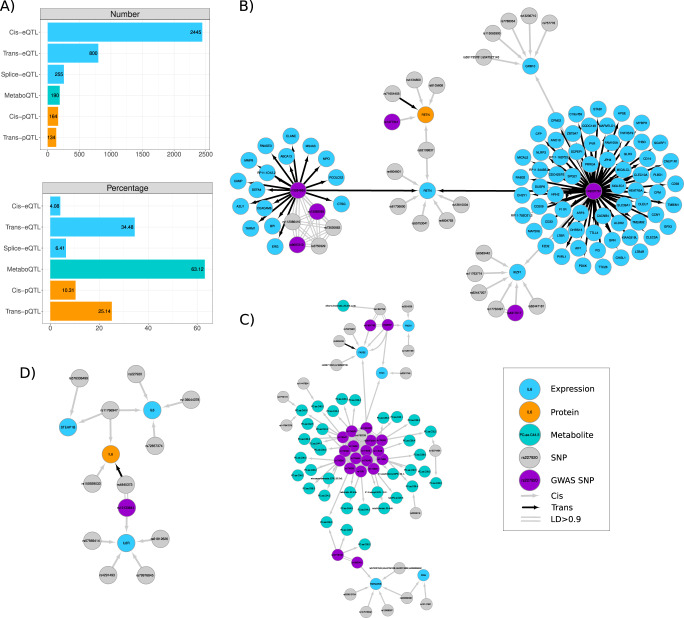
We evaluate the shared genetic regulation of mRNA molecules, proteins and metabolites derived from whole blood from 3029 human donors. We find abundant allelic heterogeneity, where multiple variants regulate a particular molecular phenotype, and pleiotropy, where a single variant associates with multiple molecular phenotypes over multiple genomic regions. The highest proportion of share genetic regulation is detected between gene expression and proteins (66.6%), with a further median shared genetic associations across 49 different tissues of 78.3% and 62.4% between plasma proteins and gene expression. We represent the genetic and molecular associations in networks including 2828 known GWAS variants, showing that GWAS variants are more often connected to gene expression in trans than other molecular phenotypes in the network. Our work provides a roadmap to understanding molecular networks and deriving the underlying mechanism of action of GWAS variants using different molecular phenotypes in an accessible tissue.


Conflict of interest statement

S.B. has ownerships in Intomics A/S, Hoba Therapeutics Aps, Novo Nordisk A/S, Lundbeck A/S, and managing board memberships in Proscion A/S and Intomics A/S. As of June 2019, M.I.M is an employee of Genentech and a holder of Roche stock. E.P. has received honoraria from Sanofi and Lilly. The other authors declare no competing interests. E.T.D. is currently an employee of GSK. The work presented in this manuscript was performed before he joined GSK. All other authors declare no competing interests.

Figures

Fig. 1
Fig. 1. Multiomic QTL analysis identifies extensive allelic heterogeneity and pleotropic effects across molecular phenotypes.
A The DIRECT consortium derived genetic, transcriptomic, proteomic and metabolite data from blood and plasma samples from 3029 individuals. Significant genetic associations (FDR < 0.05) after linear regression between the molecular phenotypes and SNPs in cis (cis-QTLs) and trans (trans-QTLs or GWAS) were used to build a network of genetic perturbations affecting molecular phenotypes. Partially created with BioRender.com. B Location of the lead eSNP with respect to the TSS of the significantly associated genes (FDR < 0.05) for cis-eQTL. The most associated eSNP per gene (primary) is shown in black (n = 15,305). Secondary cis-eQTL are shown in orange (n = 44,667). Data shows the -log10 P values of the linear regressions between gene expression and SNPs, n = 3029. C Number of cis-eQTLs per gene, ranging from 1 to 38. D The location of the SNPs acting as cis-pQTLs (pSNPs) centred around the TSS of the coding gene. The most associated pSNP per protein (primary) is shown in black (n = 373). Secondary cis-pQTL are shown in orange (n = 1217). Stronger cis-pQTLs were significantly closer to the canonical TSS of the gene coding the protein than secondary signals (Wilcoxon test = 9.54e-25). Data shows the -log10 P values of the linear regressions between proteins abundance and SNPs, n = 3027. E Number of cis-pQTLs per protein, ranging from 1 to 19. F Integration of cis-eQTLs identified the largest cis-network of local regulatory genetic effects for genes around POLR2J2. The lower lollipop plot shows the genomic location of the genes (boxes) and SNPs (lollipops), coloured by the associated genes. G Abundance of genes sharing the lead cis-eSNPs ordered by the distance between the TSS of the pair of genes in Mb. H Pairs of genes with the same lead eSNP (n = 583). Data show the -log10 P values of the linear regressions between gene expression and the common SNPs, adjusted by the direction of the effect of the eSNP.
Fig. 2
Fig. 2. Abundant pleiotropy identified across molecular phenotypes.
A, B Distribution of the P values for SNP in significant (FDR < 0.05) cis-eQTL (A) as pQTLs and for SNPs in significant (FDR < 0.05) cis-pQTLs (B) as eQTLs. Most pairs showed consistent direction of effect. Data shown are the -log10 P values of the linear regressions between gene expression or protein abundances and SNPs. C Local network of QTLs for rs34097845, a SNP significantly associated with both the expression of MPO (P value = 1.7e-10, blue) and its protein (MPO, P value = 2.08e-14, orange) with a consistent direction of effect (ßexpression = −0.87, ßprotein = −0.40). D We identified 101 trios of expression-SNP-proteins, of which 48 involved a protein and its coding gene, while 53 involved the expression of a nearby gene different that the coding gene for the protein.
Fig. 3
Fig. 3. Tissue specific genetic regulation partially explains the lack of shared associations between gene expression and proteins.
A Using n = 3027 biologically independent samples, we detected a cis-pQTL for CCL16 in whole blood (P value = 9.5e-243, n = 3029). The GTEx consortium reported a cis-eQTL, with the same SNP (rs10445391) affecting the expression of the gene in liver (n = 208). Violin plots show the median and first and last quartiles as defined by ggplot geom_violin function. Partially created with BioRender.com B Between 91.2% (pancreatic islets) and 71.6% (esophagus mucosa) of cis-eQTLs discovered by GTEx v8 were also active in whole blood DIRECT datasets (n = 3029) as shown by the π1 values (y-axis). The number of P values per tissue used to calculate the π1 estimates ranged from 334 in kidney to 14,920 in thyroid. C Comparison of the effect size of cis-eQTLs from pancreatic islets (InsPIRE) and whole blood (DIRECT). A total of 486 eQTLs were not significant in blood (P value > 0.035, orange color) but significant in pancreatic islets (n = 420) and 294 had opposite direction of effect (N = 2691). Data shown are the ß values (effect) resulting from the linear regressions between gene expression and SNPs identifying eQTLs in both studies. D Comparison of the π1 enrichment analysis between an earlier version of GTEx (v6p) and a larger later version (v8). eQTLs from DIRECT blood detected in GTEx v8 decreased  compared to v6p independently of the change in sample size across versions (Supplementary Fig. 5H). E Degree of sharing of pQTLs detected as eQTLs in GTEx v8 tissues. Up to 66.6% of plasma cis-pQTLs were also active as DIRECT whole blood cis-eQTLs. The number of overlapping QTLs across tissues oscillates between 13 (kidney) and 311 (Thyroid). F Degree of sharing of metabo-QTLs acting as cis-eQTLs in GTEx v8. Up to 16.88% (testis) of the metabo-QTLs detected in blood were active eQTLs in other tissues, with many tissues sharing no associations with metabolites-QTLs. The number of P values used to calculate π1 values per tissues ranged from 4298 in whole blood to 6575 in testis.
Fig. 4
Fig. 4. Causal inference identifies distinct patterns of casual paths in the regulation of molecular phenotypes.
A Two main models were tested for casual inference. The dependent model assumes the effect of a genetic variant (SNP) on one phenotype (1 or 2) is mediated by the other phenotype. The independent model assumes the effect of the SNP on both SNPs is independent, and no mediation between phenotypes occurs. B Example of model testing for rs11073891 association with the gene expression of AP3S2 and the expression of ANPEP (n = 3029). The results for the dependent model 2, testing for the mediation of ANPEP in the SNP effect on AP3S2 shows a change in directionality consistent with a mediation. Data shown are residuals of expression removing effects of any other eSNP grouped by genotypes (nAA=1070, nAC = 1419 and nCC = 507 for all figures). C Casual models testing paths for SNPs acting as cis-eQTLs for two genes identified slightly more models supporting independent effects of the shared eSNPs than dependent effects. The test used n = 3027 biologically independent samples with gene expression. D Casual models testing paths for SNPs acting as cis-pQTLs for two proteins identified similar numbers of dependent and independent cases, but only 7 models were conclusive. E Casual models for shared SNPs associations between gene expression and proteins supported more often dependent models, with similar proportions where expression was the mediating factor as where the mediating factor was the protein levels. F The casual network analysis supports a model where the downstream consequences of genetic variation were often mediated by other molecular phenotypes.
Fig. 5
Fig. 5. QTL integration identifies regulatory networks associated to GWAS variants.
A Of the GWAS signal overlapping SNPs in the full network (Supplementary Fig. 9), the largest number were cis-eSNPs followed by trans-eSNPs (Number). However, when considering the number of significant QTLs evaluated (Percentage), we observed that more metabo-SNPs were also reported GWAS followed by trans-eSNPs. The barplots show numbers and percentages of SNPs involved in QTLs that were also reported as lead GWAS by the GWAS catalogue (Supplementary Data 13). B Network of associations for the resistin gene (RETN). The RETN gene and its protein (orange node) have been associated with low density lipoproteins (LDL) levels. The regulatory network associated with the gene included GWAS variants (purple nodes) associated to RETN abundance (rs1477341); cardiovascular diseases and cholesterol levels (rs13284665); platelet counts (rs13284665, rs13284665, rs149007767) and monocyte counts (rs149007767). C Network for the FADS1/FADS2 genes centred in a cis-eSNP (rs968567, purple) associated with FEN1, FADS1 and FADS2 and reported as lead GWAS associaiton for lipid metabolism. The network shows their relationship with a cluster of genetic associations with metabolites (metabo-QTLs), many of which have been reported by other studies. D Network for the Interleukin-6 (IL6) gene. This network shows an example of a SNP in chromosome 7 (rs11766947) acting as cis-eQTL and cis-pQTL for both the gene expression and the protein levels for the same gene, IL6. The network shows a shared genetic regulatory effect for IL6 and the expression of its receptor IL6R mediated by a trans-eQTLs signal (rs4845373, chromosome 1) for IL6 and in high LD (R2 > 0.9) with rs12133641, a splice-QTL for the IL6-receptor (IL6R).

References

    1. Mahajan A, et al. Fine-mapping type 2 diabetes loci to single-variant resolution using high-density imputation and islet-specific epigenome maps. Nat. Genet. 2018;50:1505–1513. doi: 10.1038/s41588-018-0241-6. - DOI - PMC - PubMed
    1. Gamazon ER, et al. Using an atlas of gene regulation across 44 human tissues to inform complex disease- and trait-associated variation. Nat. Genet. 2018;50:956–967. doi: 10.1038/s41588-018-0154-4. - DOI - PMC - PubMed
    1. Viñuela A, et al. Genetic variant effects on gene expression in human pancreatic islets and their implications for T2D. Nat. Commun. 2020;11:4912. doi: 10.1038/s41467-020-18581-8. - DOI - PMC - PubMed
    1. Shin S-Y, et al. An atlas of genetic influences on human blood metabolites. Nat. Genet. 2014;46:543–550. doi: 10.1038/ng.2982. - DOI - PMC - PubMed
    1. Chick JM, et al. Defining the consequences of genetic variation on a proteome-wide scale. Nature. 2016;534:500–505. doi: 10.1038/nature18270. - DOI - PMC - PubMed

Publication types