. 2023 Oct;129(8):1314-1326.
doi: 10.1038/s41416-023-02396-7. Epub 2023 Aug 21.

Tertiary lymphoid structures correlate with enhancement of antitumor immunity in esophageal squamous cell carcinoma

Affiliations

Tertiary lymphoid structures correlate with enhancement of antitumor immunity in esophageal squamous cell carcinoma

Shoichi Nakamura et al. Br J Cancer. 2023 Oct.

Abstract

Background: Tertiary lymphoid structures (TLSs) are associated with a favorable prognosis in several cancers. However, the correlation between TLSs and outcomes of esophageal squamous cell carcinoma (ESCC) and the impact of TLSs on the tumor immune microenvironment (TIME) remain unknown.

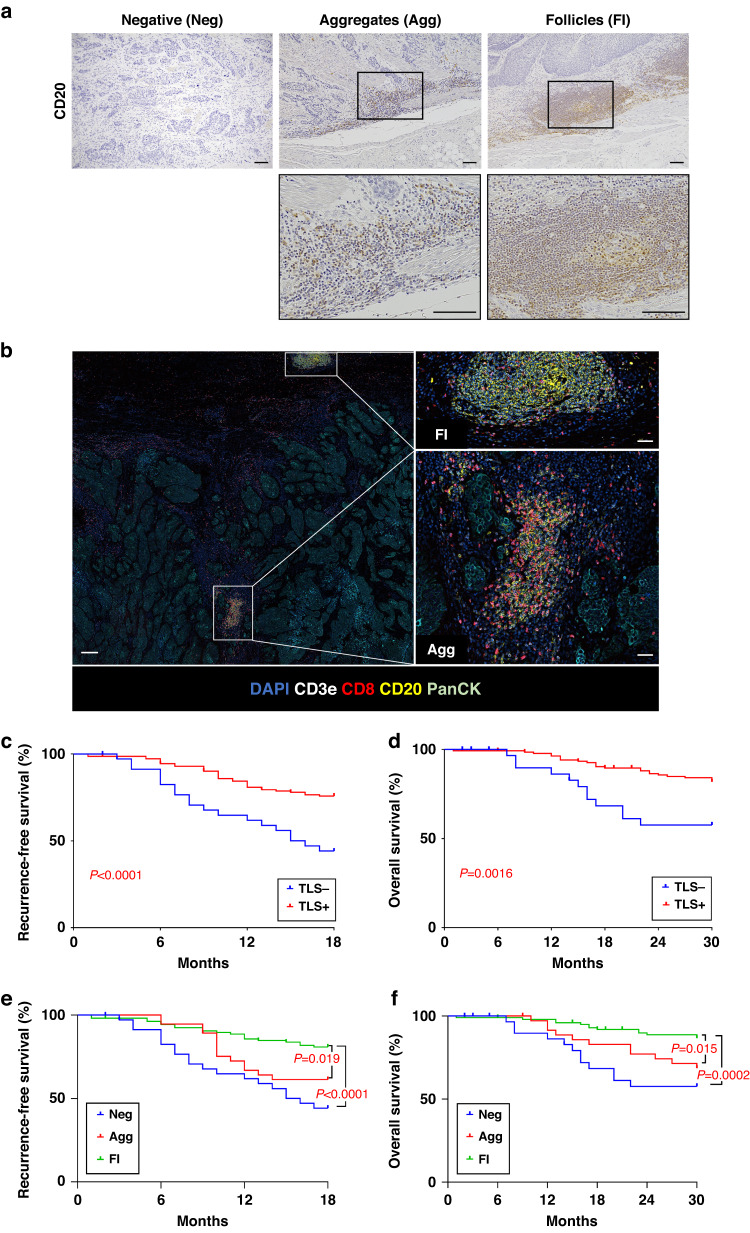
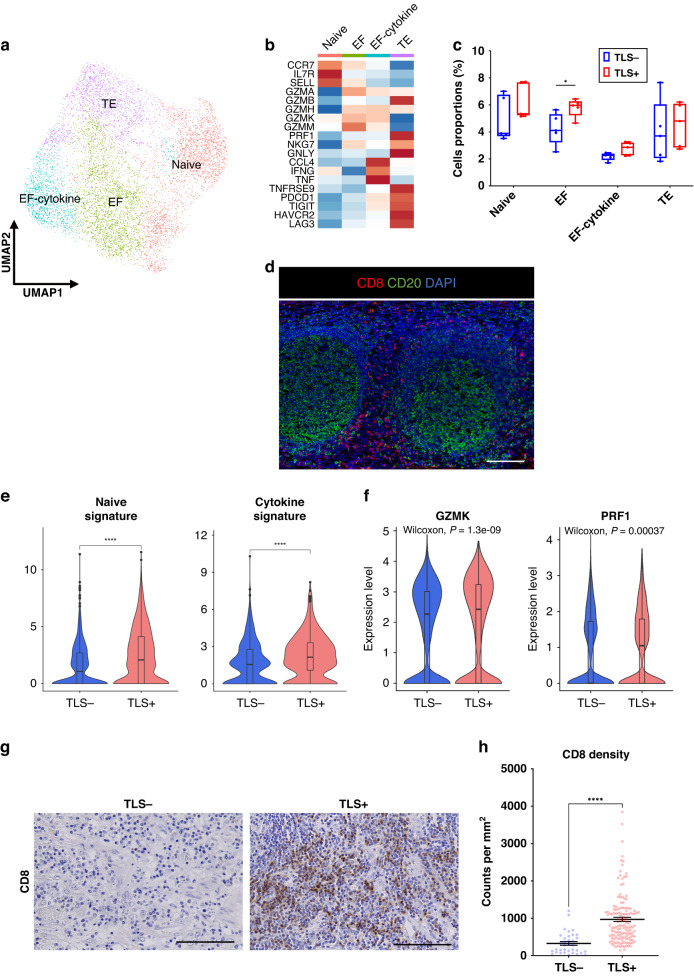
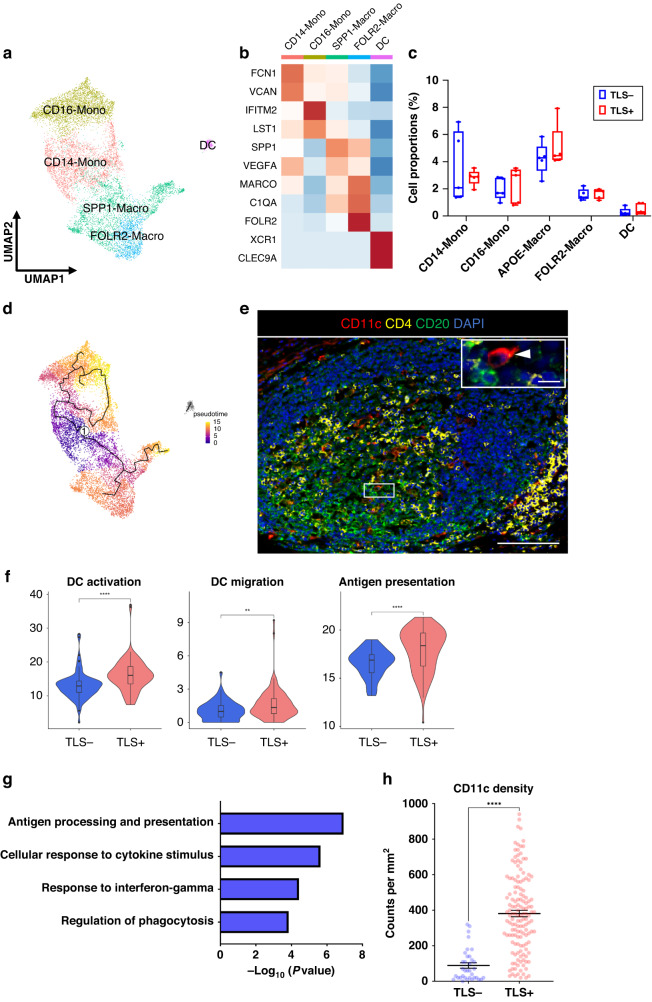
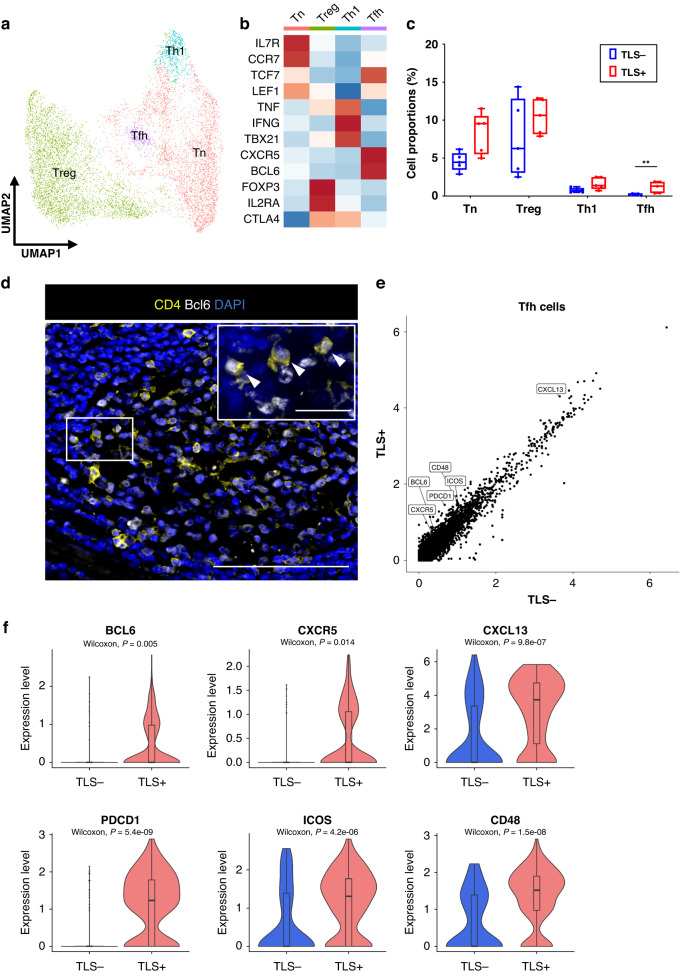
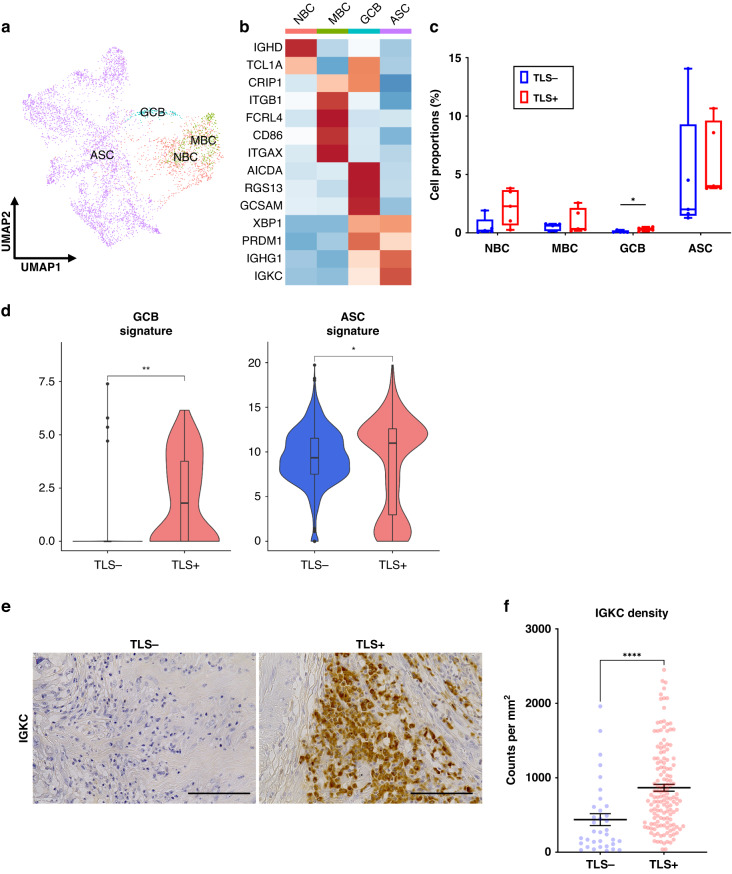
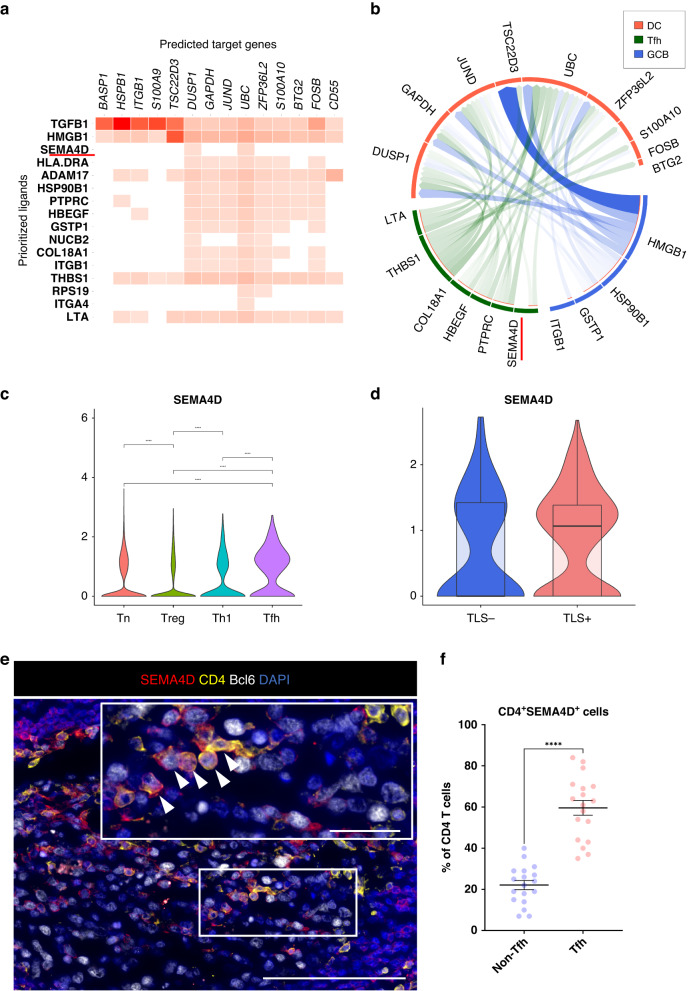
Methods: We pathologically evaluated the significance of TLSs in ESCC focusing on TLS maturation using 180 ESCC specimens and performed single-cell RNA sequencing (scRNA-seq) using 14 ESCC tissues to investigate functional differences of immune cells according to TLS presence.

Results: TLS+ cases had better recurrence-free-survival (RFS) (p < 0.0001) and overall survival (OS) (p = 0.0016) compared with TLS- cases. Additionally, mature TLS+ cases had better RFS and OS compared with immature TLS+ cases (p = 0.019 and p = 0.015) and TLS- cases (p < 0.0001 and p = 0.0002). The scRNA-seq showed that CD8+ T cells in TLS+ tumors expressed high levels of cytotoxic signatures and antigen-presentation of dendritic cells (DCs) was enhanced in TLS+ tumors. Immunohistochemistry showed that the densities of tumor-infiltrating CD8+ T cells and DCs were significantly higher in TLS+ tumors than those in TLS- tumors.

Conclusions: These data suggest the prognostic and functional significance of TLSs in ESCC and provides new insights into TLSs on the TIME.


Conflict of interest statement

The authors declare no competing interests.

Figures

Fig. 1
Fig. 1. The TLS classification and the relationship between TLSs and a prognosis in ESCC patients.
a Representative images of IHC staining of CD20 showing TLSs (Negative (Neg), Aggregates (Agg) and Follicles (Fl)) (×100). The inset shows a higher magnification image of the boxed area. Scale bars, 100 µm. b CODEX multiple staining images showed TLSs. Five-color composite CODEX multiple staining images of DAPI, CD3e, CD8, CD20 and PanCK and high magnification (right). Regions of interest were shown in the white box (Fl, top; Agg, bottom). Scale bars, 1000 µm (left panel) and 200 µm (right panel). cf Kaplan–Meier analyses of recurrence-free survival (RFS) and overall survival (OS) in ESCC by TLS presence or TLS maturation classification (Neg, Agg and Fl). RFS cohort: TLS- (n = 36), TLS+ (n = 144); Neg (n = 36), Agg (n = 37), Fl (n = 107). OS cohort: TLS- (n = 32), TLS+ (n = 138); Neg (n = 32), Agg (n = 36), Fl (n = 102). P values were calculated by log-rank test.
Fig. 2
Fig. 2. CD8+ T cells enhance several functions and enrich tumor-infiltration in TLS+ tumors.
a UMAP plot was color-coded by four subtypes of CD8+ T cells on the basis of representative genes. b Heatmap indicated the representative genes in each CD8+ T cell subtype. c Box and whisker plots showed the CD8+ T cell subtype distributions in accordance with TLS presence. Box middle lines, median; box limits, upper and lower quartiles; box whiskers, 1.5× the interquartile range. Wilcoxon rank-sum test was performed. *p < 0.05. d Representative immunofluorescence staining of TLSs for CD8 (red), CD20 (green) and DAPI (blue) (×200). Scale bars, 100 µm. e Violin plots showed the expressions of naive signature in the Naive subtype and cytokine signature in the EF-cytokine subtype in accordance with TLS presence. Significance of the gene set enrichment (p value) in accordance with TLS presence was determined by Wilcoxon rank-sum test. Boxplots included centerline, median; box limits, upper and lower quartiles; whiskers at most 1.5× the interquartile range past upper and lower quartiles. ****p < 0.0001. f Violin plots showed the expression of GZMK and PRF1 in CD8+ T cells in accordance with TLS presence. Significance of the gene expression (p value) in accordance with TLS presence was determined by Wilcoxon rank-sum test. Boxplots included centerline, median; box limits, upper and lower quartiles; whiskers at most 1.5× the interquartile range past upper and lower quartiles. g Representative images of CD8 immunohistostaining on tumor tissues in accordance with TLS presence (×400). Scale bars, 100 µm. h Graph showed the quantification of CD8+ T cell density in tumors. Patients were divided groups in accordance with TLS presence. Mean ± SEM were shown. Wilcoxon rank-sum test was performed. ****p < 0.0001.
Fig. 3
Fig. 3. DCs are activated and enhance antigen-presentation in TLS+ tumors.
a UMAP plot was color-coded by five subtypes of myeloid cells on the basis of representative genes. b Heatmap indicated representative genes in each myeloid cell subtype. c Box and whisker plots showed the B cell subtype distributions in accordance with TLS presence. Box middle lines, median; box limits, upper and lower quartiles; box whiskers, 1.5× the interquartile range. Wilcoxon rank-sum test was performed. d Trajectory analysis of myeloid cells. The pseudotime trajectory was calculated with lighter colors indicating newer values. e Representative immunofluorescence staining of TLSs for CD11c (red), CD4 (yellow), CD20 (green) and DAPI (blue) (×200). The insets showed a higher-magnification image of the boxed area (×400). Arrowheads indicated DCs. Scale bars, 100 µm and 20 µm (inset). f Violin plots showed the expression of activation, migration and antigen-presentation signatures in accordance with TLS presence. Significance of the gene expression (p value) in accordance with TLS presence was determined by Wilcoxon rank-sum test. Boxplots included centerline, median; box limits, upper and lower quartiles; whiskers at most 1.5× the interquartile range past upper and lower quartiles. **p < 0.01, ****p < 0.0001. g Gragh showed the enriched Gene Ontology term for the top 100 signature genes in DCs with TLS using Metascape. h Graph showed the quantification of CD11c-positive cells in tumors. Patients were divided groups in accordance with TLS presence. Mean ± SEM were shown. Wilcoxon rank-sum test was performed. ****p < 0.0001.
Fig. 4
Fig. 4. Tfh cells upregulate several TLS-related genes in TLS+ tumors.
a UMAP plot was color-coded by four subtypes of CD4+ T cells on the basis of representative genes. b Heatmap indicated representative genes in each CD4+ T cell subtype. c Box and whisker plots showed the CD4+ T cell subtype distributions in accordance with TLS presence. Box middle lines, median; box limits, upper and lower quartiles; box whiskers, 1.5× the interquartile range. Wilcoxon rank-sum test was performed. **p < 0.01. d Representative immunofluorescence staining of Tfh cells in TLSs for CD4 (yellow), Bcl6 (white) and DAPI (blue) (×200). The insets showed a higher-magnification image of the boxed area (×400). Arrowheads indicated Tfh cells. Scale bars, 100 µm and 20 µm (inset). e Scatter plot analysis of DEGs between Tfh cells in tumors with TLS versus without TLS. f Violin plots showed the expression of TLS-related genes in Tfh cells in accordance with TLS presence. Significance of the gene expression (p value) in accordance with TLS presence was determined by Wilcoxon rank-sum test. Boxplots included centerline, median; box limits, upper and lower quartiles; whiskers at most 1.5× the interquartile range past upper and lower quartiles.
Fig. 5
Fig. 5. B cells are promoted for maturation into ASCs in TLS+ tumors.
a UMAP plot was color-coded by four subtypes of B cells on the basis of representative genes. b Heatmap indicated representative genes in each B cell subtype. c Box and whisker plots showed the B cell subtype distributions in accordance with TLS presence. Box middle lines, median; box limits, upper and lower quartiles; box whiskers, 1.5× the interquartile range. Wilcoxon rank-sum test was performed. *p < 0.05. d Violin plots showed the expression of GCB and ASC signature in accordance with TLS presence. Significance of gene expression (p value) in accordance with TLS presence was determined by Wilcoxon rank-sum test. Boxplots included centerline, median; box limits, upper and lower quartiles; whiskers at most 1.5× the interquartile range past upper and lower quartiles. *p < 0.05, **p < 0.01. e Representative images of IGKC immunostaining in tumor tissues with or without TLS (×400). Scale bars, 100 µm. f Graph showed the quantification of IGKC-positive cells in tumors. Patients were divided groups in accordance with TLS presence. Mean ± SEM were shown. Wilcoxon rank-sum test was performed. ****p < 0.0001.
Fig. 6
Fig. 6. SEMA4D expression increases in Tfh cells in TLS+ tumors.
a Ligand activities and predicted target genes were identified by NicheNet analysis. b Circos plot showed the interactions between several cell types (receiver cluster, DCs; sender clusters, Tfh and GCB). c Violin plots showed the expression of SEMA4D in CD4+ T cell subtypes. Significance of gene expression (p value) was determined by Wilcoxon rank-sum test, with all p-values adjusted using Bonferroni correction. d Violin plots showed SEMA4D in Tfh cells in accordance with TLS presence. Boxplots included centerline, median; box limits, upper and lower quartiles; whiskers at most 1.5× the interquartile range past upper and lower quartiles. e Representative immunofluorescence staining of TLSs for SEMA4D (red), CD4 (yellow), Bcl6 (white) and DAPI (blue) (×400). Arrowheads indicated Tfh cells expressing SEMA4D. Scale bars, 100 µm and 20 µm (inset). f Graph showed the frequency of SEMA4D positivity on CD4+ T cells (Tfh cells or non-Tfh cells). Mean ± SEM were shown. Wilcoxon rank-sum test was performed. ****p < 0.0001.

References

    1. Sung H, Ferlay J, Siegel RL, Laversanne M, Soerjomataram I, Jemal A, et al. Global Cancer Statistics 2020: GLOBOCAN estimates of incidence and mortality worldwide for 36 cancers in 185 countries. CA Cancer J Clin. 2021;71:209–49. doi: 10.3322/caac.21660. - DOI - PubMed
    1. Thrift AP. Global burden and epidemiology of Barrett oesophagus and oesophageal cancer. Nat Rev Gastroenterol Hepatol. 2021;18:432–43. doi: 10.1038/s41575-021-00419-3. - DOI - PubMed
    1. Sun J-M, Shen L, Shah MA, Enzinger P, Adenis A, Doi T, et al. Pembrolizumab plus chemotherapy versus chemotherapy alone for first-line treatment of advanced oesophageal cancer (KEYNOTE-590): a randomised, placebo-controlled, phase 3 study. Lancet. 2021;398:759–71. doi: 10.1016/S0140-6736(21)01234-4. - DOI - PubMed
    1. Doki Y, Ajani JA, Kato K, Xu J, Wyrwicz L, Motoyama S, et al. Nivolumab combination therapy in advanced esophageal squamous-cell carcinoma. N Engl J Med. 2022;386:449–62. doi: 10.1056/NEJMoa2111380. - DOI - PubMed
    1. Binnewies M, Roberts EW, Kersten K, Chan V, Fearon DF, Merad M, et al. Understanding the tumor immune microenvironment (TIME) for effective therapy. Nat Med. 2018;24:541–50. doi: 10.1038/s41591-018-0014-x. - DOI - PMC - PubMed

Publication types