. 2023 Oct;28(10):4421-4437.
doi: 10.1038/s41380-023-02216-7. Epub 2023 Aug 21.

Transmission of Alzheimer's disease-associated microbiota dysbiosis and its impact on cognitive function: evidence from mice and patients

Affiliations

Transmission of Alzheimer's disease-associated microbiota dysbiosis and its impact on cognitive function: evidence from mice and patients

Yiying Zhang et al. Mol Psychiatry. 2023 Oct.

Abstract

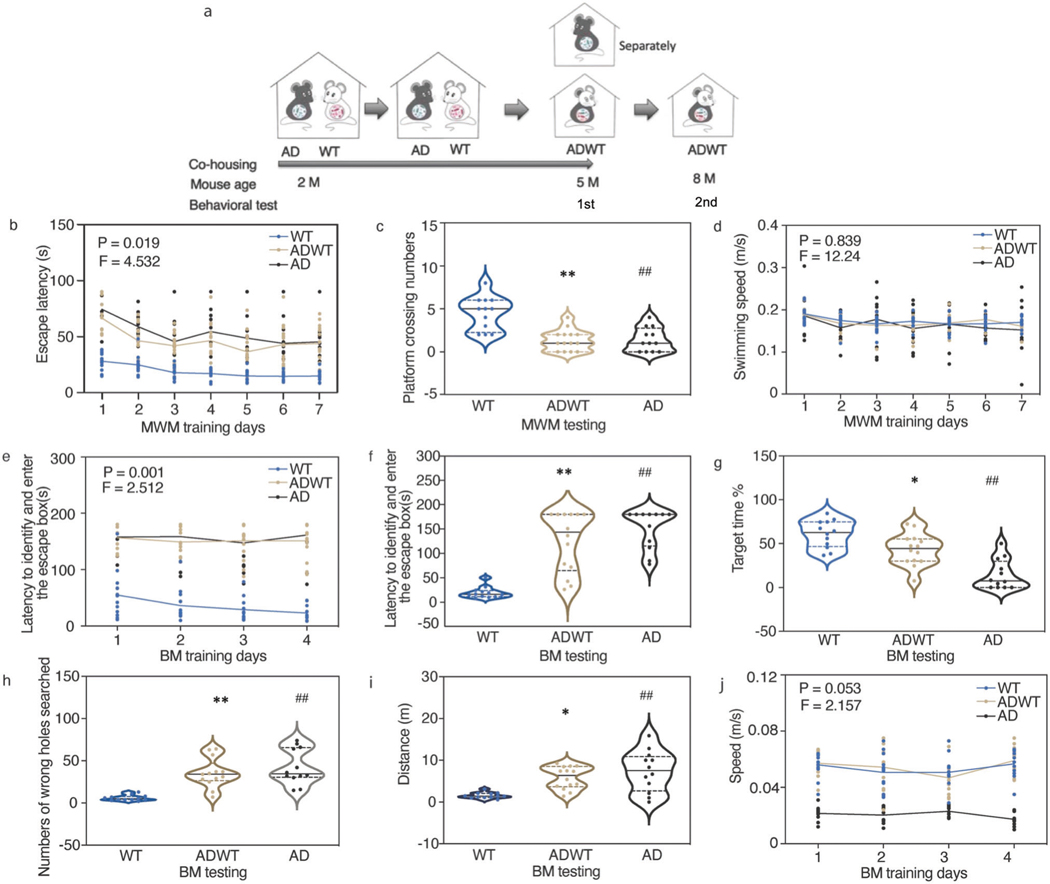
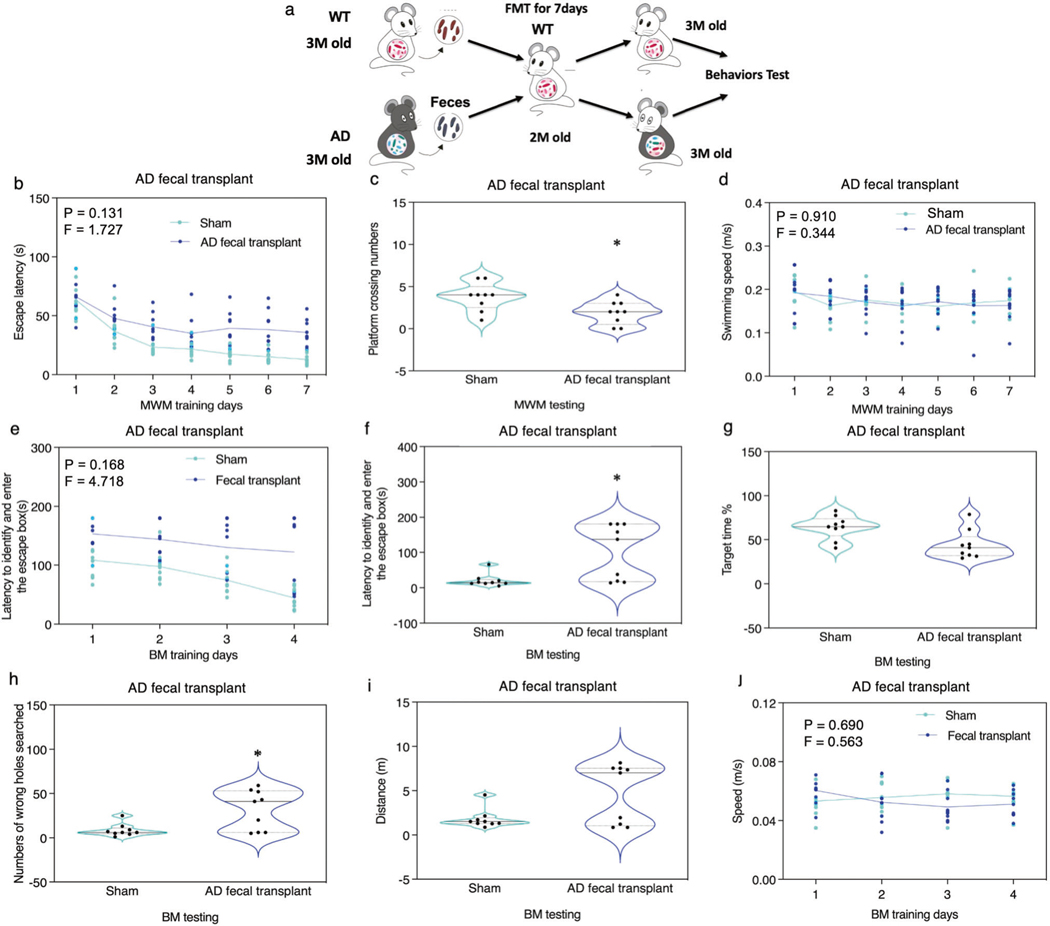
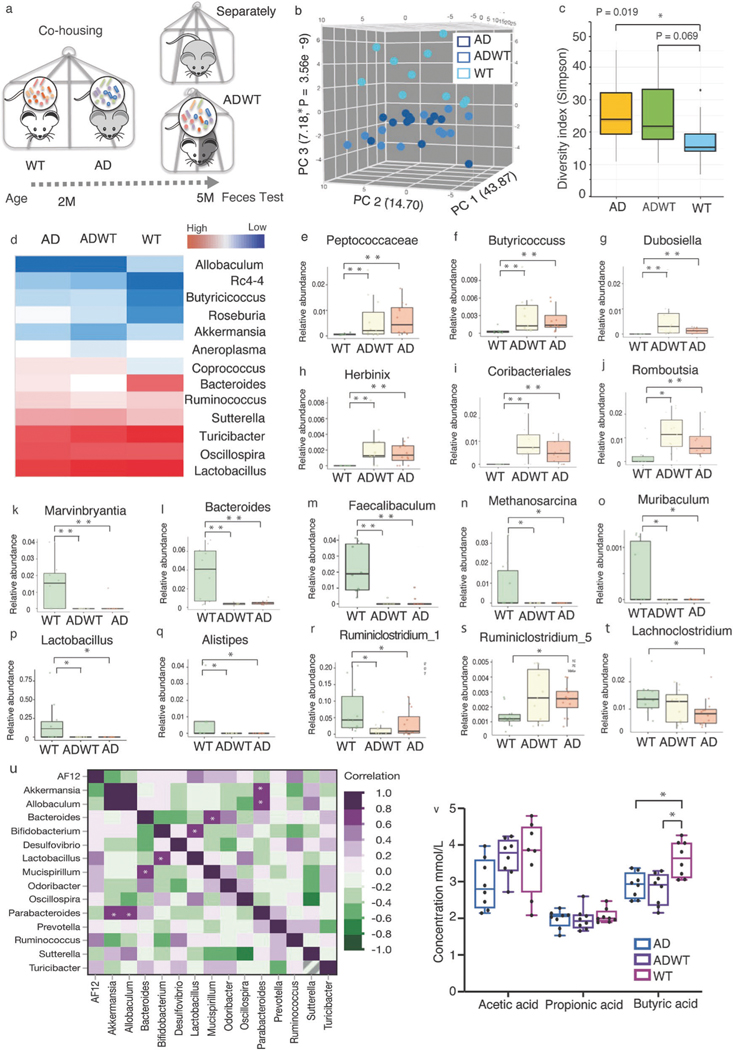
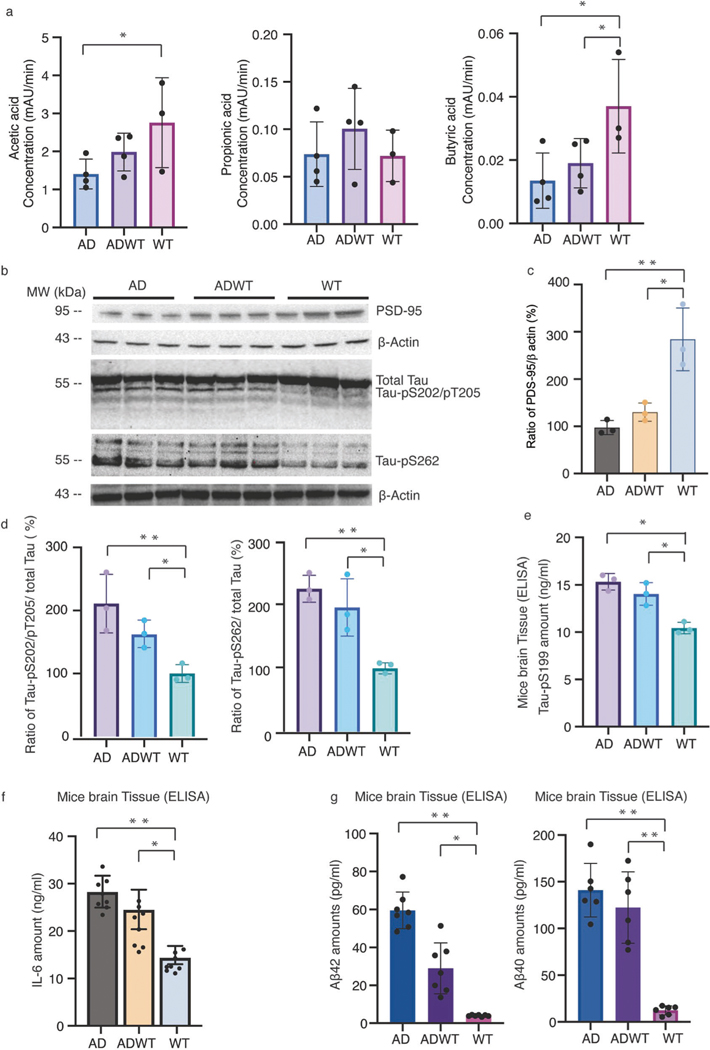
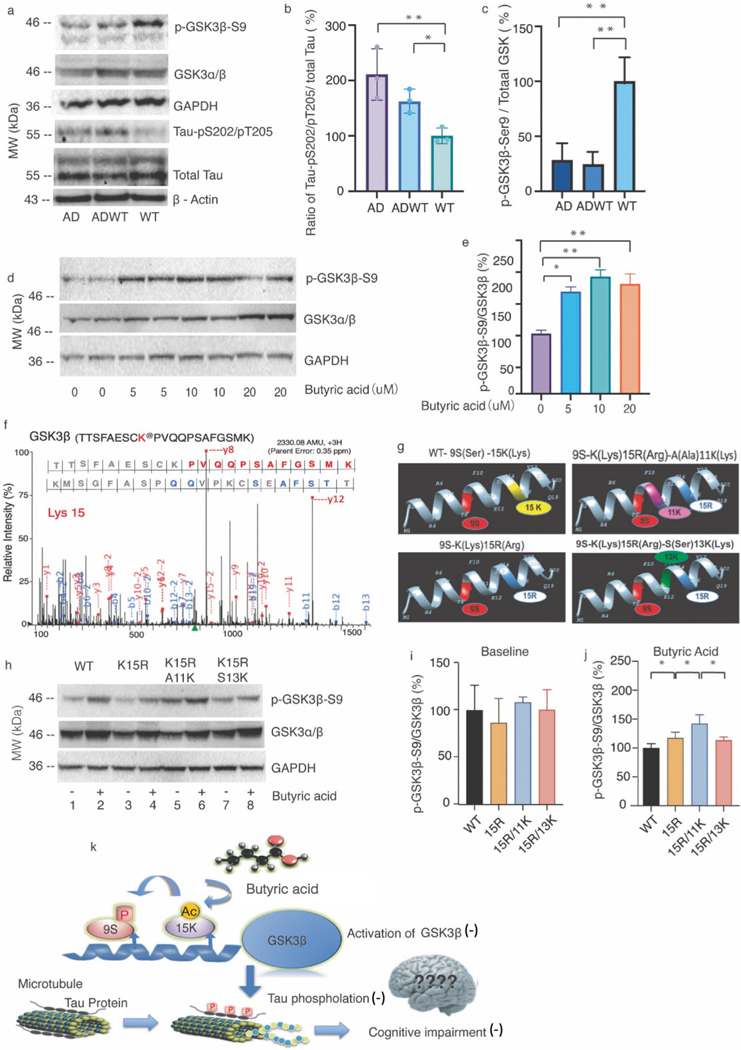
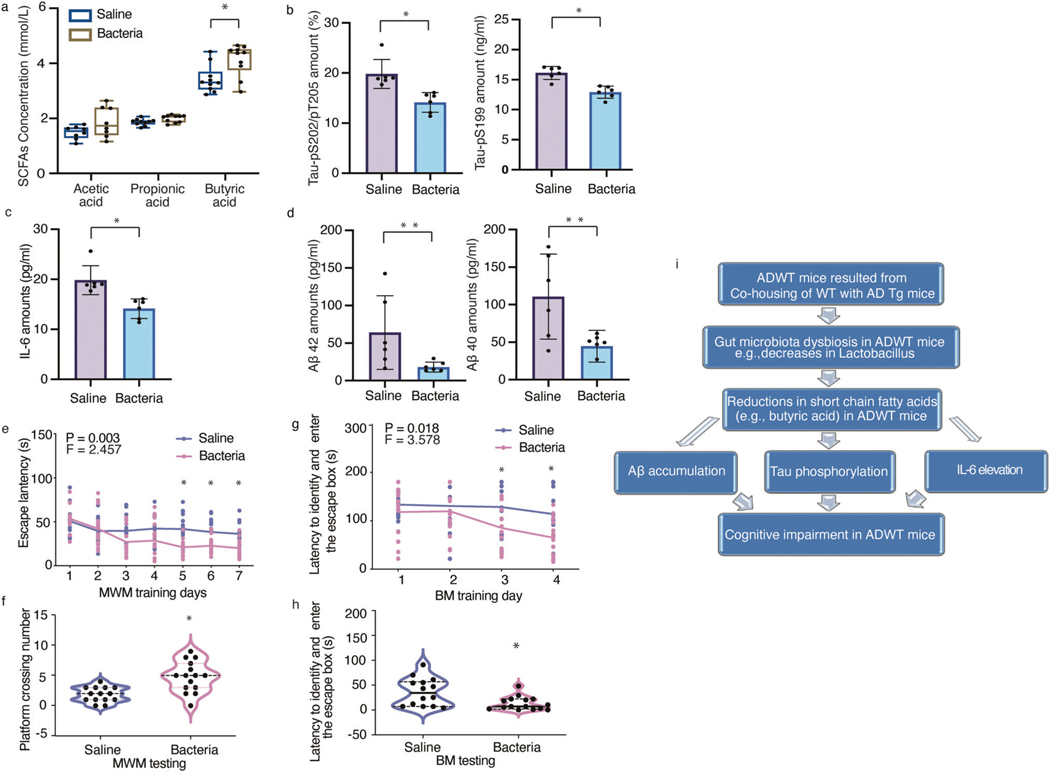
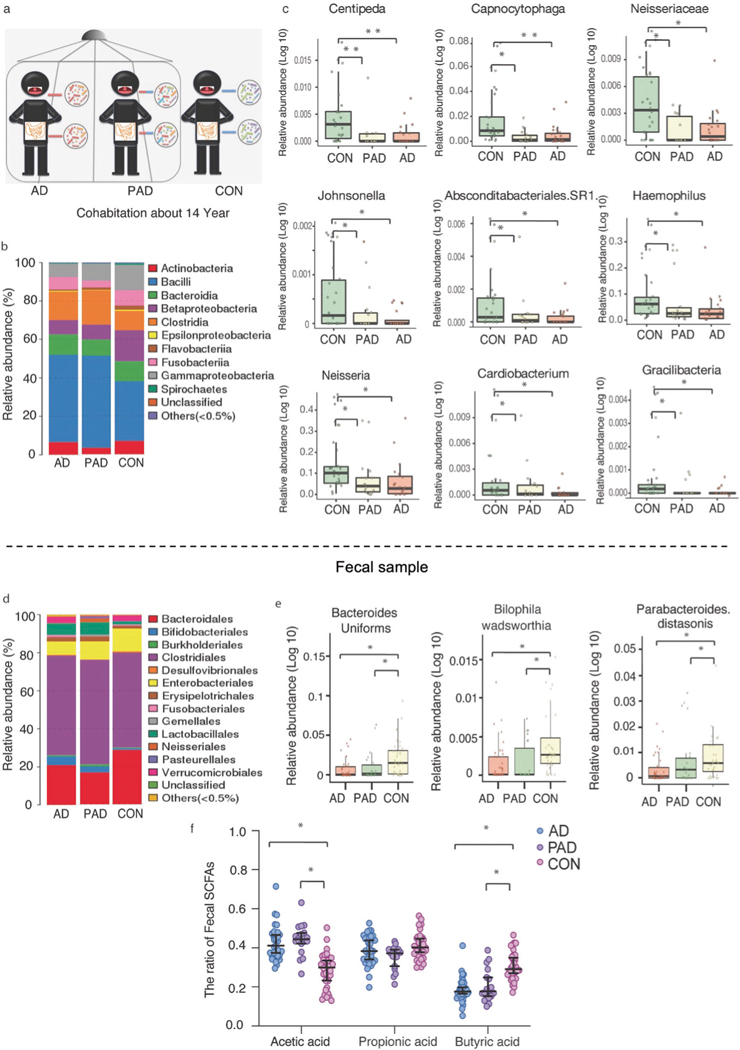
Spouses of Alzheimer's disease (AD) patients are at a higher risk of developing incidental dementia. However, the causes and underlying mechanism of this clinical observation remain largely unknown. One possible explanation is linked to microbiota dysbiosis, a condition that has been associated with AD. However, it remains unclear whether gut microbiota dysbiosis can be transmitted from AD individuals to non-AD individuals and contribute to the development of AD pathogenesis and cognitive impairment. We, therefore, set out to perform both animal studies and clinical investigation by co-housing wild-type mice and AD transgenic mice, analyzing microbiota via 16S rRNA gene sequencing, measuring short-chain fatty acid amounts, and employing behavioral test, mass spectrometry, site-mutations and other methods. The present study revealed that co-housing between wild-type mice and AD transgenic mice or administrating feces of AD transgenic mice to wild-type mice resulted in AD-associated gut microbiota dysbiosis, Tau phosphorylation, and cognitive impairment in the wild-type mice. Gavage with Lactobacillus and Bifidobacterium restored these changes in the wild-type mice. The oral and gut microbiota of AD patient partners resembled that of AD patients but differed from healthy controls, indicating the transmission of microbiota. The underlying mechanism of these findings includes that the butyric acid-mediated acetylation of GSK3β at lysine 15 regulated its phosphorylation at serine 9, consequently impacting Tau phosphorylation. Pending confirmative studies, these results provide insight into a potential link between the transmission of AD-associated microbiota dysbiosis and development of cognitive impairment, which underscore the need for further research in this area.


Figures

Fig. 1
Fig. 1. WT mice developed cognitive impairment after co-housing with AD Tg mice.
a The 2-month-old WT mice co-housed with 2-month-old AD Tg mice for up to 3 months are defined as AD-exposed WT mice (ADWT mice). The ADWT mice were separated from AD Tg mice at age of 5-month-old. The behavioral tests of mice were performed at age of 5- and 8-month-old. After co-housing for 3 months, both AD Tg mice and ADWT mice developed cognitive impairment compared to the WT mice, as demonstrated by increased MWM escape latency during training days (b), decreased MWM platform crossing numbers on testing day (c), but no significant changes in swimming speed in MWM (d), increased latency to enter escape box during BM training days (e), and increased latency to enter escape box on BM testing day (f), decreased BM target time on testing day (g), increased number of wrong holes searched on BM testing day (h), and increased distance on testing day (i) compared to the WT mice. j. AD Tg, but not ADWT mice, had reduced speed compared to WT mice. Data are mean ± standard deviation or medians (with interquartile ranges), N = 12–14 mice in each experimental group. Two-way ANOVA with repeated measurement and Bonferroni correction were used to analyze the data presented in b, d, e, and j. The P values refer to the interaction of group in MWM and BM training days. One-way ANOVA with Bonferroni correction were used to analyze the data presented in c, f–i. The P values refer to the differences of variables among the groups, *P < 0.05; ##P < 0.01. AD Alzheimer’s disease, WT wild-type, ADWT AD-exposed WT, Tg transgenic, MWM Morris water maze, BM Barnes maze.
Fig. 2
Fig. 2. WT mice developed cognitive impairment after fecal microbiota transplantation from AD Tg mice.
a The 2-month-old WT mice received gavage of fecal microbiota from the 3-month-old WT or AD Tg (5XFAD) mice for 7 days; the behaviors of the recipient WT mice were tested one month after the gavage at 3-month-old. The recipient WT mice received AD Tg mice fecal microbiota transplantation developed cognitive impairment compared to the WT mice received saline, demonstrated as slight trending of increased escape latency during training days (b), decreased platform crossing number on testing day (c), but no significant changes in swimming speed (d) of MWM. The recipient WT mice received fecal microbiota transplantation from AD Tg mice developed cognitive impairment compared to the WT mice received saline, demonstrated as slight trending of increased latency to enter escape box during BM training days (e), increased latency to enter escape box on BM testing day (f), but not significant changes in BM target time on testing day (g), increased number of wrong holes searched on BM testing day (h), no significant changes on distance on BM testing day (i), and no significant changes on speed during training days (j). N = 9 mice in each experimental group. Two-way ANOVA with repeated measurement and Bonferroni correction was used to analyze the data presented in b, d, e, and j. The P values refer to the interaction of group in MWM and BM training days. Mann-Whitney U test was used to analyze the data presented in c, f–i. The P values refer to the differences of variables between the groups, *P < 0.05. AD Alzheimer’s disease, WT wild-type, Tg transgenic, MWM Morris water maze, BM Barnes maze, FMT fecal microbiota transplantation.
Fig. 3
Fig. 3. ADWT mice acquired AD-associated gut microbiota dysbiosis after co-housing with AD Tg mice.
a Experimental design of fecal collection after 3 months co-housing. b Principal component analysis (PCA) using the Bray-Curtis dissimilarity metric among fecal samples of WT, ADWT, and AD Tg mice (P = 3.56e−9; permutational multivariate analysis of variance, PERMANOVA). Each dot represents an individual. PC1, PC2, and PC3 represent the percentage of variance explained by each coordinate. c Simpson diversity index was significantly higher in AD Tg mice and borderline significant higher in ADWT mice compared to WT mice. d Heat map indicated the different changes in bacterial community structure represented as relative abundance shown in genus level analysis among the AD Tg, ADWT and WT mice. Relative to the WT mice, the AD Tg and ADWT mice had higher relative abundance of Peptococcaceae (e); Butyricoccuss (f); Dubosiella (g); Herbinix (h); Coribacteriales (i); Romboutsia (j), but lower relative abundance of Marvinbryantia (k); Bacteroides (l); Faecalibaculum (m); Methanosarcina (n); Muribaculum (o); Lactobacillus (p); Alistipes (q); Ruminclostridium_1 (r). Relative to the WT mice, the AD Tg mice had higher relative abundance of Ruminclostridium_5 (s) but lower relative abundance of Lachnoclostridium (t). u The heat map demonstrated the pair-wise correlative relationship between any pair of two bacteria among the WT, ADWT, and AD Tg mice. v Changes in fecal short-chain fat acids showed that the AD Tg and ADWT mice had less butyric acid amounts compared to the WT mice had. N = 8–12 biologically independent samples in each group. MaAsLin2 implementation were used for testing in microbiome profiles taxonomic result (e–t). One-way ANOVA with Bonferroni correction was used to analyze the data presented in (v). The P values refer to the differences of variables between the groups, *P < 0.05; **P < 0.01. AD Alzheimer’s disease, WT wild-type, PC principal component, MaAsLin2, Microbiome Multivariable Association with Linear.
Fig. 4
Fig. 4. Differences in brain levels of SCFAs, PSD-95, phosphorylated Tau, IL-6 and Aβ among AD Tg, ADWT and WT mice.
a The AD Tg mice had less brain acetic acid, but not propionic acid, levels compared to WT mice. Both the AD Tg and ADWT mice had less butyric acid levels in brain tissues compared to the WT mice. b Western blot showed that the AD Tg and ADWT mice had lesser amount of PSD-95, higher amounts of Tau-pS202/pT205 and Tau-pS262, but not total Tau, in the hippocampus compared to WT mice. c The quantification of the Western blots showed that the AD Tg and ADWT mice had a lesser ratio of PSD-95 to β-actin in the hippocampus compared to the WT mice. d The quantification of the Western blots showed that the AD Tg and ADWT mice had a higher ratio of Tau-pS202/pT205 to total Tau and Tau-pS262 to total Tau in the hippocampus compared to the WT mice. e ELISA showed that AD Tg and ADWT mice had higher Tau-pS199 amounts in the hippocampus compared to WT mice. f The AD Tg and ADWT mice had higher amounts of IL-6 in the hippocampus compared to WT mice. g The AD Tg and ADWT mice had higher amounts of Aβ42 and Aβ40 in the hippocampus compared to the WT mice. N = 3–8 biologically independent samples in each group. One-way ANOVA with Bonferroni correction was used to analyze the data presented in a, c–g The P values refer to the differences of variables between the groups, *P < 0.05; **P < 0.01. AD Alzheimer’s disease, WT wild-type, Tg transgenic, PSD-95 postsynaptic density 95, Interleukin 6 IL-6.
Fig. 5
Fig. 5. Butyric acid increased p-GSK3β-S9 levels through lysine acetylation at position 15 of GSK3β.
a Western blot showed that the AD Tg and ADWT mice had higher amounts of Tau- pS202/pT205 and lower amounts of p-GSK3β-S9 in the hippocampus compared to WT mice. b The quantification of the Western blot demonstrated that AD Tg and ADWT mice had higher ratio of Tau-pS202/pT205 to total Tau in the hippocampus compared to WT mice. c The quantification of the Western blot demonstrated AD Tg and ADWT mice had lower ratio of p-GSK3β-S9 to total GSK3β in the hippocampus compared to WT mice. d Western blot showed that the butyric acid increased p-GSK3β-S9 levels in HEK 293 T cells. e The quantification of the Western blot demonstrated the effects of butyric acid on increasing the ratios of p-GSK3β-S9 to GSK3β in HEK 293T cells. f Annotation of representative tandem mass spectra of Trypsin-GluC digested GSK3β, depicting K15 acetylation following the treatment of butyric acid in HEK 293T cells. g The computer-generated WT and three independent site-directed mutations (K15R, K15R/A11K, and K15R/S13K). h The effects of butyric acid on amounts of p-GSK3β-S9 and GSK3β in WT and the three independent site-directed mutants (K15R, K15R/A11K, and K15R/S13K) in HEK 293T cells. i The three mutations did not significantly change the baseline ratio of p-GSK3β-S9 to GSK3β. j However, the mutation of K15R increased the ratio of p-GSK3β-S9 to GSK3β, the mutation of K15R plus A11K had greater increases in the ratios of p-GSK3β-S9 to GSK3β than the mutations of K15R alone following the butyric acid treatment. Mutation of K15R/S13K had less effect on GSK3β phosphorylation at serine 9 than K15R/A11K following butyric acid treatment. k The hypothesized pathway showing that lysine at 15 of GSK3β may play an important role in the butyric acid-mediated inhibition of GSK3β activity, Tau phosphorylation and cognitive impairment. One-way ANOVA with Bonferroni correction was used to analyze the data presented in b, c, e, i, and j. The P values refer to the differences of variables between the groups, *P < 0.05; **P < 0.01. N = 3 biologically independent samples in each group. AD Alzheimer’s disease, WT wild-type, p phosphorylated, pS phosphorylated serine, pT phosphorylated threonine, K lysine, R arginine, S serine, A alanine.
Fig. 6
Fig. 6. Treatment with bacteria (Lactobacillus and Bifidobacterium) mitigated the behavioral and cellular changes in ADWT mice.
a The gavage of Lactobacillus plus Bifidobacterium (in the first 10 days in each month of the total 3 months) increased fecal butyric acid amounts of the ADWT mice compared to saline treatment. The gavage of Lactobacillus plus Bifidobacterium reduced the amounts of Tau-pS202/pT205 and Tau-pS199 (b), IL-6 (c) and Aβ42 and Aβ40 (d) in the hippocampus of the ADWT mice compared to saline treatment. Finally, the ADWT mice with gavage of Lactobacillus plus Bifidobacterium had better cognitive function compared to the ADWT mice with saline treatment, as demonstrated in MWM training (e), MWM testing (f), BM training (g), and BM testing (h). i The hypothesized pathway showing that ADWT mice, resulting from the co-housing of AD Tg and WT mice, acquire the AD-associated gut microbiota dysbiosis and reduced butyric acid amounts in gut and brain, which might cause Tau phosphorylation, IL-6 elevation and Aβ accumulation, leading to the cognitive impairment in the ADWT mice. Data are mean ± standard deviation or median (with interquartile range), N = 6–15 biologically independent samples in each group. Student’s t-tests were used to analyze the data in a–d. Two-way ANOVA with repeated measurement and Bonferroni correction was used to analyze the data presented in e and g. Mann–Whitney U test was used to analyze the data in f and h. The P values refer to the differences of variables or interaction between the groups, *P < 0.05; **P < 0.01. AD Alzheimer’s disease, WT wild-type, p phosphorylated, pS phosphorylated serine, pT phosphorylated threonine, Interleukin 6 IL-6, MWM Morris water maze, BM Barnes maze.
Fig. 7
Fig. 7. Microbiota in oral and fecal samples of Alzheimer’s disease (AD) patients, partners of AD patients (PAD), and control (CON) individuals.
a Schema of oral and fecal sample collection from AD, PAD, and CON. b The average taxonomic distribution of bacteria from oral 16 S RNA sequencing at the order level among the AD, PAD, and CON. c Relative abundances of 9 bacteria in oral samples from AD and those from PAD were similar and significantly lower than those in CON. d The average taxonomic distribution of bacteria from fecal 16S RNA sequencing at the order level among the AD, PAD, and CON. e Relative abundances of 3 bacteria in fecal samples from AD and PAD were similar and significantly lower than those in CON. f The ratios of acetic acid and butyric acid to total SCFAs in fecal samples among the three cohorts showed that the AD and PAD had higher acetic acid, but lower butyric acid compared to CON. There were the following biologically independent samples in each group of oral samples: AD (N = 19), PAD (N = 11), CON (N = 24) and fecal samples: AD (N = 39), PAD (N = 22), CON (N = 33). Microbiome Multivariable Association with Linear (MaAsLin2) implementation was used for testing in microbiome profiles taxonomic result (c, e). One-way ANOVA with Bonferroni correction was used to analyze the data in (f). The P values refer to the differences of variables between the groups, *P < 0.05; **P < 0.01. AD Alzheimer’s disease, PAD partners of AD, CON control.

Update of

Comment in

Similar articles

Cited by

References

    1. Nianogo RA, Rosenwohl-Mack A, Yaffe K, Carrasco A, Hoffmann CM, Barnes DE. Risk factors associated with Alzheimer disease and related dementias by sex and race and ethnicity in the US. JAMA Neurol. 2022;79:584–91. - PMC - PubMed
    1. Selkoe DJ. Alzheimer’s disease: genes, proteins, and therapy. Physiol Rev. 2001;81:741–66. - PubMed
    1. Grundke-Iqbal I, Iqbal K, Quinlan M, Tung YC, Zaidi MS, Wisniewski HM. Microtubule-associated protein tau. A component of Alzheimer paired helical filaments. J Biol Chem. 1986;261:6084–9. - PubMed
    1. Grundke-Iqbal I, Iqbal K, Tung YC, Quinlan M, Wisniewski HM, Binder LI. Abnormal phosphorylation of the microtubule-associated protein tau (tau) in Alzheimer cytoskeletal pathology. Proc Natl Acad Sci USA. 1986;83:4913–7. - PMC - PubMed
    1. Trojanowski JQ, Lee VM. Paired helical filament tau in Alzheimer’s disease. The kinase connection. Am J Pathol. 1994;144:449–53. - PMC - PubMed

Substances

LinkOut - more resources