. 2023 Sep;25(9):1332-1345.
doi: 10.1038/s41556-023-01208-7. Epub 2023 Aug 21.

MacroH2A restricts inflammatory gene expression in melanoma cancer-associated fibroblasts by coordinating chromatin looping

Affiliations

MacroH2A restricts inflammatory gene expression in melanoma cancer-associated fibroblasts by coordinating chromatin looping

Dan Filipescu et al. Nat Cell Biol. 2023 Sep.

Abstract

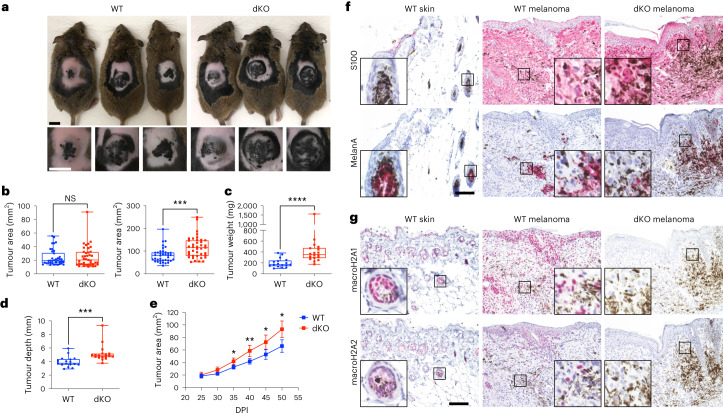
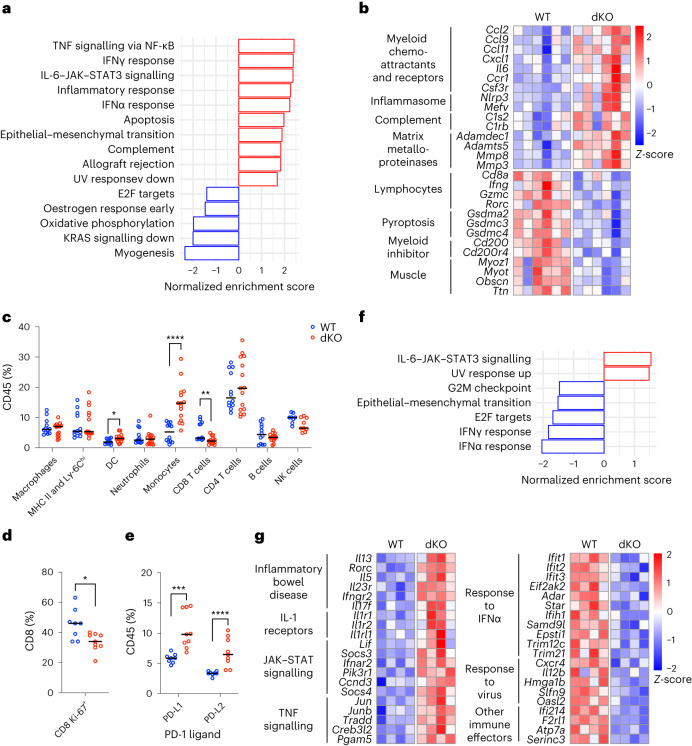
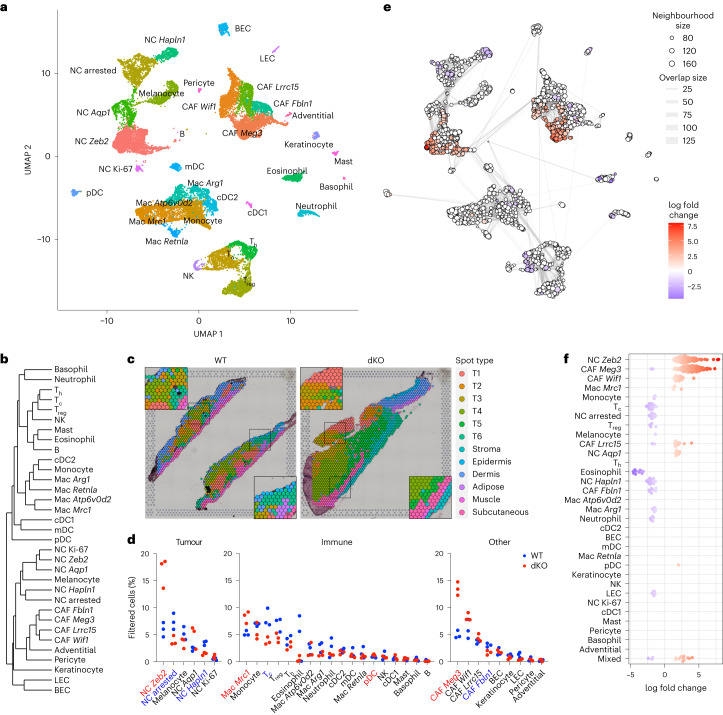
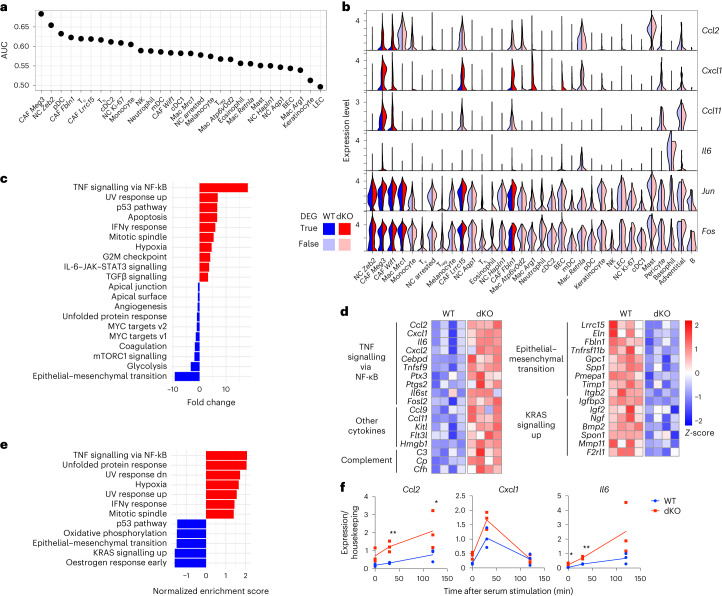
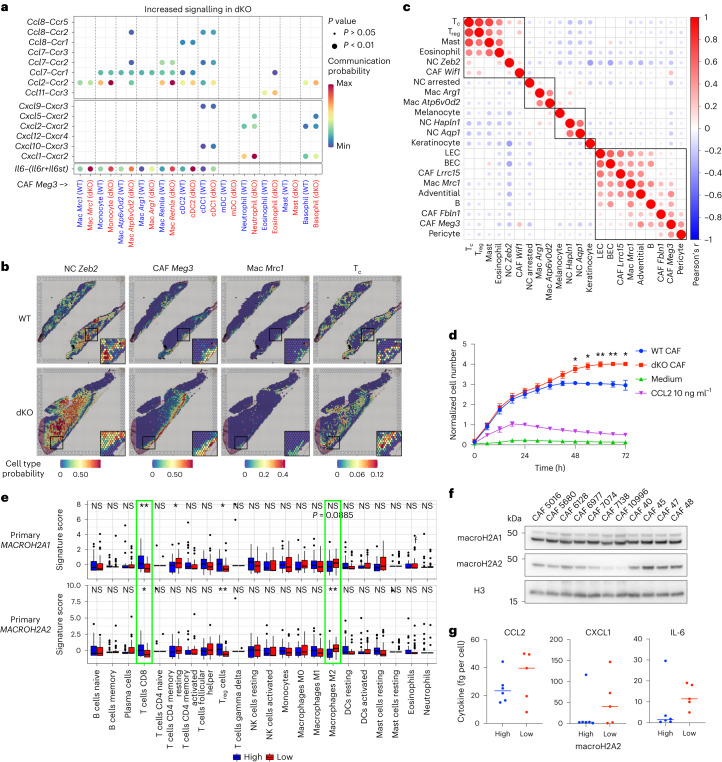
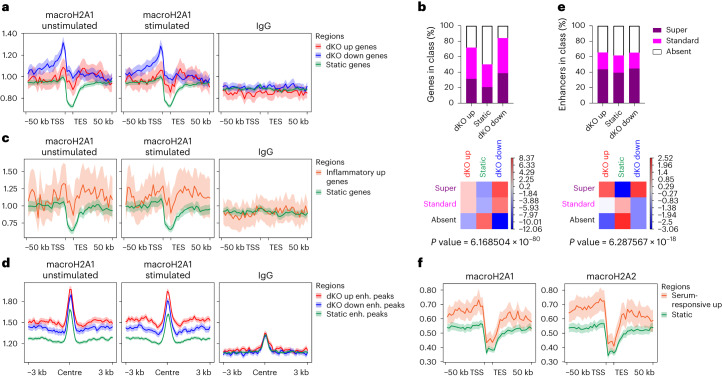
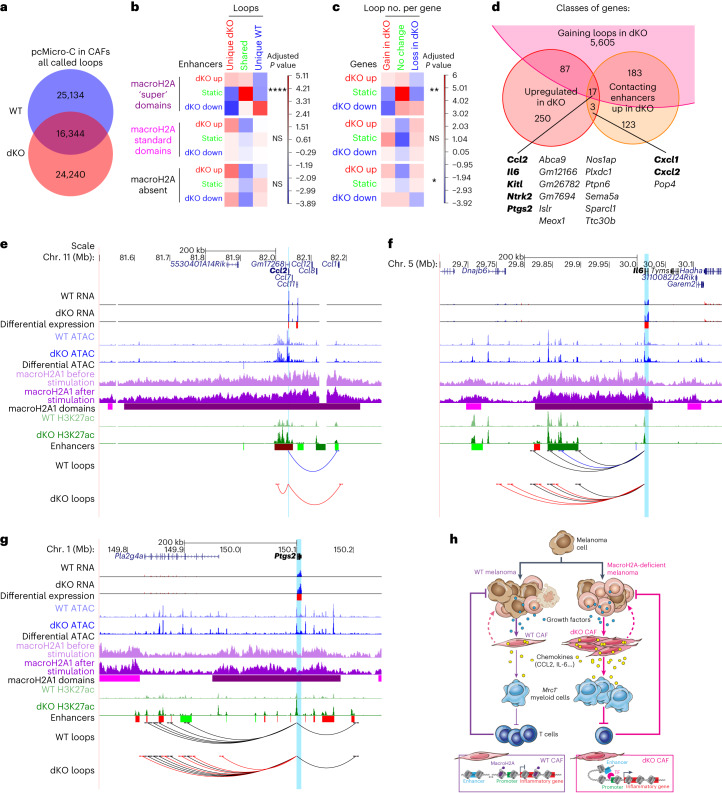
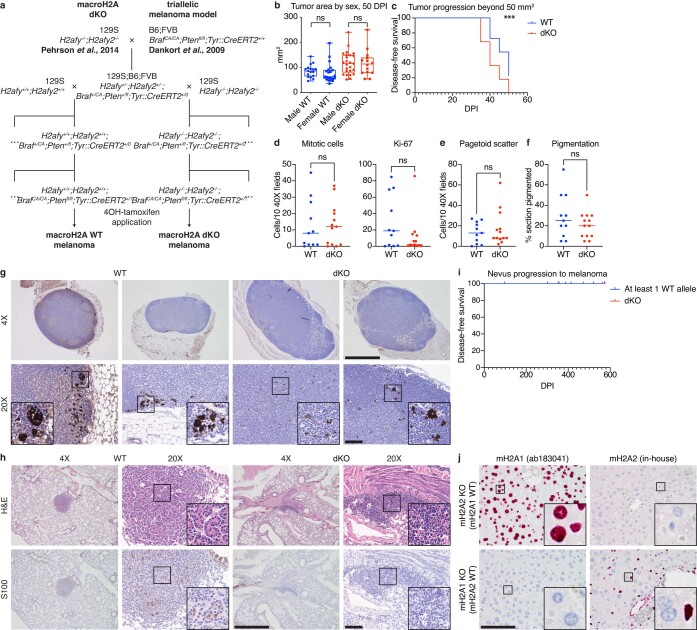
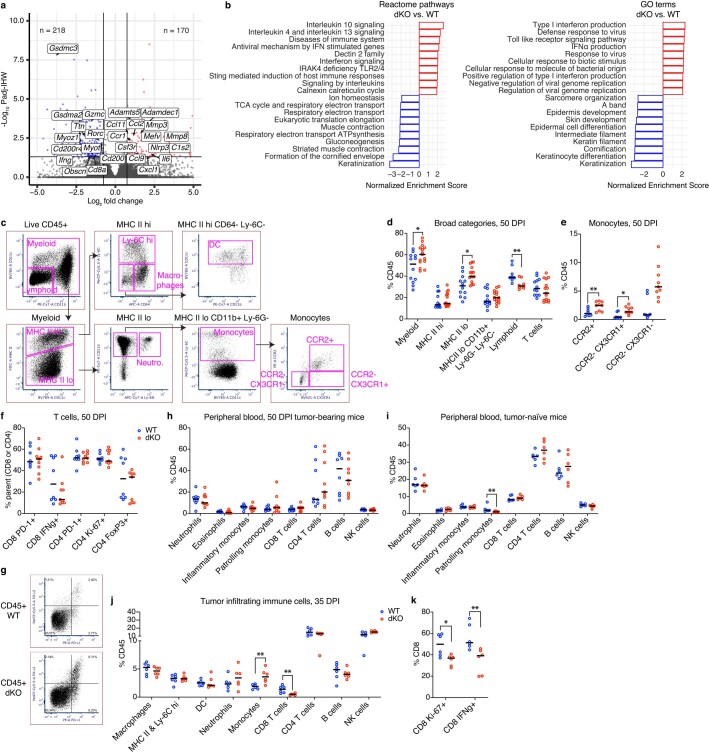
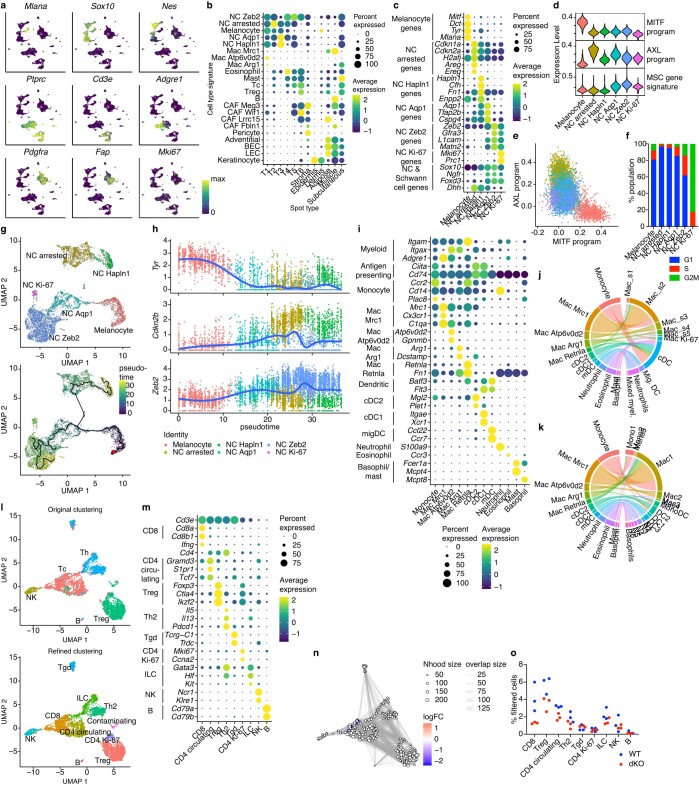
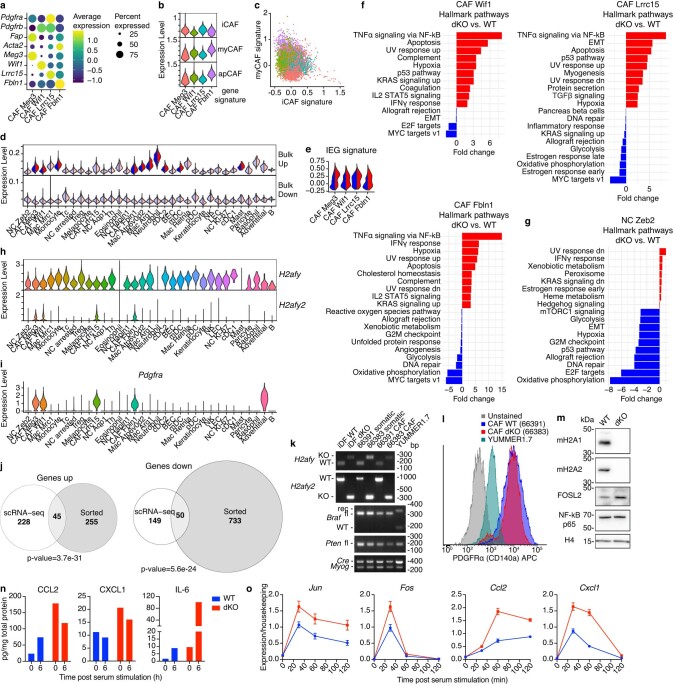
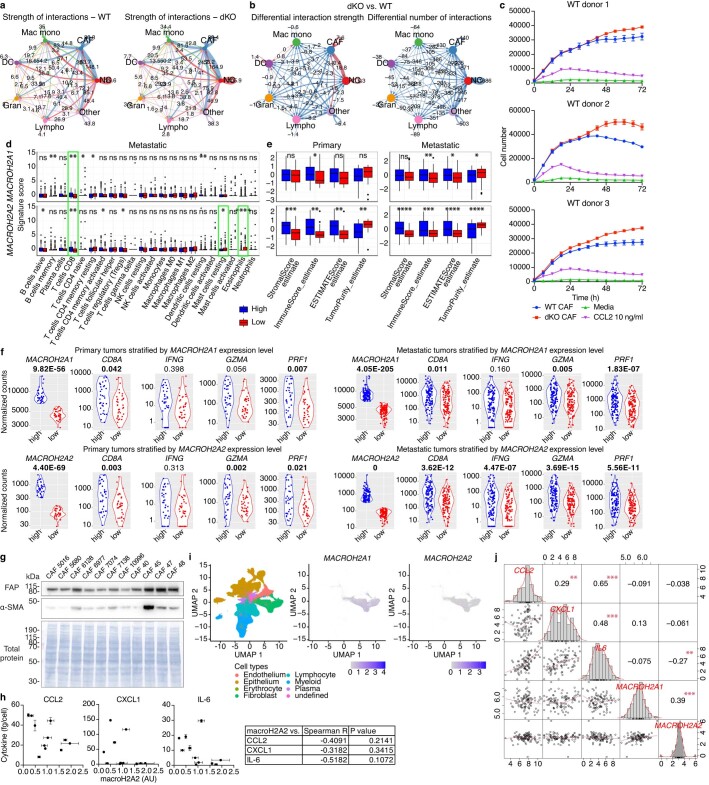
MacroH2A has established tumour suppressive functions in melanoma and other cancers, but an unappreciated role in the tumour microenvironment. Using an autochthonous, immunocompetent mouse model of melanoma, we demonstrate that mice devoid of macroH2A variants exhibit increased tumour burden compared with wild-type counterparts. MacroH2A-deficient tumours accumulate immunosuppressive monocytes and are depleted of functional cytotoxic T cells, characteristics consistent with a compromised anti-tumour response. Single cell and spatial transcriptomics identify increased dedifferentiation along the neural crest lineage of the tumour compartment and increased frequency and activation of cancer-associated fibroblasts following macroH2A loss. Mechanistically, macroH2A-deficient cancer-associated fibroblasts display increased myeloid chemoattractant activity as a consequence of hyperinducible expression of inflammatory genes, which is enforced by increased chromatin looping of their promoters to enhancers that gain H3K27ac. In summary, we reveal a tumour suppressive role for macroH2A variants through the regulation of chromatin architecture in the tumour stroma with potential implications for human melanoma.


Conflict of interest statement

The authors declare no competing interests.

Figures

Fig. 1
Fig. 1. MacroH2A loss in the melanoma TME promotes primary tumour growth.
a, Macroscopic appearance of BRAFV600E/PTEN-deficient autochthonous melanomas in macroH2A WT mice and in dKO mice at 50 DPI. b, Comparison of tumour area across genotypes at the indicated time points. nWT = 38, ndKO = 39. P = 0.7962 at 25 DPI, P = 0.0002 at 50 DPI. c, Measured weight of resected tumours at the end point (50 DPI). nWT = 17, ndKO = 18. P < 0.0001. d, Average tumour depth calculated from the tumour area and volume at the end point (50 DPI). nWT = 17, ndKO = 18. For bd, significance was determined using Mann–Whitney two-tailed test. Box plot whiskers represent the minimum to maximum range, the box plot limits the 25th to 75th percentiles, and the centre line the median. P = 0.0001. e, Tumour growth kinetics between 25 and 50 DPI. nWT = 22, ndKO = 22. Mean and 95% confidence interval error bars are shown. P values adjusted for multiple comparisons: *P < 0.05, **P < 0.01, Mann–Whitney two-tailed test. Exact P values are provided as numerical source data. f, Immunohistochemical characterization of normal dorsal skin and representative tumours in a. Antigens indicated are stained pink (Vector Red substrate). g, Immunohistochemical analysis as in f, but demonstrating macroH2A1 and macroH2A2 staining in normal skin and in WT and dKO melanoma. For f and g, insets are shown at additional ×4 magnification. Staining was repeated on nWT skin = 2, nWT melanoma = 7, ndKO melanoma = 6 mice with similar results. Scale bars, 100 μm (f,g) or 1 cm (a). NS, not significant. Source data
Fig. 2
Fig. 2. MacroH2A-deficient melanomas deregulate genes associated with an immune anti-tumour response, and accumulate monocytes and dysfunctional CD8+ T cells.
a, GSEA of hallmark pathways performed on bulk RNA-seq of triallelic melanomas at 50 DPI. dKO versus WT comparison. The top ten significant (Benjamini–Hochberg adjusted P < 0.05) pathways are shown. Exact P values are provided in Supplementary Table 1. b, Heatmap of DEGs in WT and dKO melanomas (bulk tumour), grouped under selected top gene enrichment terms defined using Homer analysis. Each column represents an independent tumour. Expression values are normalized row-wise as Z-scores. c, Quantification of indicated non-overlapping tumour-infiltrating immune cell populations at 50 DPI, determined by flow cytometry. nWT = 12, ndKO = 15 except for the natural killer (NK) cell population, for which nWT = 8 and ndKO = 11. DC, dendritic cells; MHC, major histocompatibility complex. d, Proliferative status of CD8+ T cells in c assessed as a percentage of Ki-67 positivity by flow cytometry. e, Expression of PD-1 ligands on immune cells assessed as a percentage of PD-L1 or PD-L2 positivity by flow cytometry. For d and e, nWT = 8, ndKO = 9. For ce, Mann–Whitney two-tailed test P values shown: *P < 0.05, **P < 0.01, ***P < 0.001, ****P < 0.0001, with exact P values provided as numerical source data. The centre line represents the median. Non-significant differences are not labelled. f, GSEA of hallmark pathways performed on RNA-seq of CD8+ T cells sorted by flow cytometry from melanomas at 50 DPI. dKO cells versus WT comparison. g, Heatmap of DEGs in WT and dKO melanoma-infiltrating sorted CD8+ T cells, grouped under selected top gene enrichment terms defined using Homer analysis. Each column represents target cells from an independent tumour. Expression values are normalized row-wise as Z-scores. Source data
Fig. 3
Fig. 3. scRNA-seq identifies dKO-associated remodelling of the NC-derived and immune compartments.
a, Dimension-reduced representation using uniform manifold approximation and projection (UMAP) of cell clusters in WT and dKO melanomas profiled by scRNA-seq at 35 DPI. Dots correspond to single cells from three independently processed tumours per genotype, coloured by cluster identity. b, Phylogenetic tree showing the degree of cell type and state similarity based on distances between clusters in principal component analysis space. See Supplementary Table 3 for a description of the cell-type acronyms used. c, Distribution of annotated spot types derived from ST analysis, overlaid on WT and dKO tumour histology. Insets are shown at ×2 magnification. d, Relative cell frequencies across clusters in individual melanomas profiled by scRNA-seq. Values shown are normalized to the total number of high-quality cells per sample included in the analysis. Names in colour represent clusters with significant differences between WT and dKO frequencies (two-tailed unpaired t-test < 0.05); red indicates more abundant in dKO, whereas blue indicates more abundant in WT. P values are provided as numerical source data. e, UMAP representation of differential abundance analysis performed using Milo. Cells are grouped into overlapping neighbourhoods based on their k-nearest neighbour graph position, depicted as circles proportional in size to the number of cells contained, coloured by the log fold change of abundance between genotypes. The graph edge thickness is proportional to the number of cells shared between adjacent neighbourhoods. f, Bee swarm plot of significant differences in e showing distributions of abundance log fold changes between dKO and WT samples in neighbourhoods belonging to the indicated clusters as in a. For e and f, neighbourhoods with significant differential abundance at a 5% false discovery rate are coloured. In f, non-significant neighbourhoods are not shown. Source data
Fig. 4
Fig. 4. Pro-inflammatory signals in dKO tumours originate from CAFs.
a, Prioritization of the contribution of each cell cluster to gene expression changes in dKO versus WT samples using Augur, a method that measures the separation in gene expression space between cells in each cluster as a function of genotype. AUC, area under the curve. b, Genes of interest with significant upregulation in dKO samples in clusters highlighted in bold colours (Wilcoxon rank-sum test adjusted P < 0.05). P values are provided in Supplementary Table 3. c, Significant hallmark pathways in a GSEA of dKO versus WT samples performed in the CAF Meg3 cluster. d, Heatmap of DEGs in CAFs sorted by flow cytometry from WT and dKO melanomas at 50 DPI, grouped under selected top gene enrichment terms defined using Homer analysis. Each column represents CAFs from an independent tumour. Expression values are normalized row-wise as Z-scores. e, Significant hallmark pathways in GSEA of sorted CAFs as in d. f, Expression normalized to housekeeping controls of indicated cytokine genes determined by reverse transcription-qPCR in cultured CAFs isolated from WT and dKO tumours at the indicated times following serum stimulation. Line represents the mean of three independently performed experiments shown. Ratio paired two-tailed t-test P values shown: *P < 0.05, **P < 0.01. Exact P values are provided as numerical source data. Non-significant differences are not labelled. Source data
Fig. 5
Fig. 5. CAFs are the source of pro-inflammatory signals in the dKO TME.
a, Comparison of signalling probability along CCL, CXCL and IL-6 pathways leveraging scRNA-seq data from CAF Meg3 cells to myeloid cell clusters. Dots represent significant ligand–receptor interaction pairs with increased signalling in the dKO. The dot colour represents communication probability, the dot size represents the P value of one-sided permutation test, and the absence of a dot signifies a null probability of signalling. Exact P values are provided as numerical source data. b, Prediction of the spatial localization of indicated scRNA-seq cell clusters in WT and dKO melanoma by label transfer onto ST data. Insets are shown at ×2 magnification. c, Correlation analysis of cell-type scores for all scRNA-seq clusters detected in SC data, based on the combined set of WT and dKO spots. Dots shown correspond to significant correlations (two-tailed t-test adjusted for multiple comparisons, adjusted P < 0.05), heatmap colour corresponds to Pearson’s correlation coefficient. Exact P values are provided as numerical source data. Black squares represent hierarchical clusters of cell types based on correlation coefficients. d, Transwell assay measuring the migration of CMFDA-labelled WT bone-marrow-derived monocytes towards unlabelled WT or dKO CAFs. Monocyte counts are normalized to the CCL2 condition at 24 h. Summary of three independent experiments using different monocyte donors shown. Error bars represent s.e.m. Two-tailed t-test P values shown: *P < 0.05, **P < 0.01. Exact P values are provided as numerical source data. Non-significant differences are not labelled. e, Comparison of deconvoluted immune cell type scores between TCGA primary melanoma tumours with MACROH2A1 and MACROH2A2 high and low expression levels. Wilcoxon rank-sum test P values adjusted for multiple comparisons shown: *P < 0.05, **P < 0.01. Exact P values are provided as numerical source data. N = 35 biologically independent samples per category. The box plot centre line represents the median, the box plot limits indicate the 25th to 75th percentiles, the whiskers extend from the box limit to the most extreme value no further than 1.5× the inter-quartile range from the box limit, any data beyond whiskers are plotted as individual points. f, MacroH2A1 and macroH2A2 levels in a panel of 11 human melanoma CAF lines. Histone H3 was used as a control for total histone content. g, Indicated cytokine levels in CAF lines in f, stratified according to macroH2A2 levels along the median. Nhigh = 6, nlow = 5 biologically independent samples. The western blot was repeated three times. Source data
Fig. 6
Fig. 6. MacroH2A-sensitive genes and enhancers occupy highly enriched macroH2A chromatin domains.
a, Metagene profile of macroH2A1 CUT&RUN signals in cultured WT CAFs before and after serum stimulation at genes differentially up or down or static genes of matched expression levels in dKO versus WT sorted CAFs. ndKO up = 357, ndKO down = 884, nStatic = 3,708. TES, transcription end site; TSS, transcription start site. b, Top, percentage of overlap between DEGs and MCDs. Bottom, deviation from random distribution shown as a heatmap of Chi-square test residuals, together with the associated P value. c, As in a, but at inflammatory genes upregulated in dKO sorted CAFs and static genes of matched expression levels. nInflammatory up = 39, nStatic = 385. d, Average profile of macroH2A CUT&RUN signals in cultured WT CAFs before and after serum stimulation centred around ATAC peaks located in enhancers (enh.) that gain, lose or maintain static H3K27ac levels in dKO versus WT tumours. ndKO up = 6,659, ndKO down = 5,211, nStatic = 18,961. Note the signal pattern at the centre of the ATAC peak, which is probably due to a bias of CUT&RUN for accessible chromatin sites. e, As in b, but for overlap between enhancers with peaks shown in d and MCDs. f, Average profile of macroH2A1 and macroH2A2 signals in dermal fibroblasts analysed by ChIP–seq at genes hyperinduced by serum stimulation in the absence of macroH2A and static genes of matched expression levels. nSerum-responsive up = 139, nStatic = 695. For a, c, d and f, mean signal value and 95% confidence interval as determined by bootstrap analysis are shown. Source data
Fig. 7
Fig. 7. DAEs and DEGs acquire changes in chromatin looping in dKO tumours.
a, Extent of overlap between chromatin loops detected in WT and dKO CAFs after serum stimulation at 10 kb resolution. b, Chi-square test of independence evaluating the association between changes in H3K27ac level at enhancers and gains or losses of loops to these enhancers in the absence of macroH2A. Combinations of loop and enhancer status are stratified according to the position of enhancers with respect to MCDs. c, As in b, but for changes in gene expression and in the total number of loops per gene. For b and c, P values adjusted for multiple comparisons shown: *P < 0.05, **P < 0.01, ****P < 0.0001. Exact P values are provided as numerical source data. d, Overlap between genes upregulated, in contact with enhancers gaining H3K27ac, and with net loop gains in dKO tumours. Genes in bold are associated with inflammatory signalling pathways according to HOMER analysis. e, University of California Santa Cruz (UCSC) genome browser screenshots of the Ccl2 locus and its chromatin environment showing indicated transcriptomic and epigenomic features. Bars under RNA-seq and ATAC–seq tracks indicate significantly upregulated (red) or downregulated (blue) genes or accessible regions in dKO versus WT sorted CAFs. Bars under macroH2A CUT&RUN tracks indicate ‘super’ (purple) and ‘standard’ (magenta) macroH2A chromatin domains. Below H3K27ac tracks, bright and dark bars indicate TEs and SEs, respectively; red, blue and green denote gain, loss and no change, respectively of H3K27ac level in dKO versus WT CAFs. Chromatin loops, originating at the promoter of the highlighted gene, are shown in red if specific for the dKO, blue for the WT, and black if shared. f, As in e, but for the Il6 locus. g, As in e, but for the Ptgs2 locus. h, Model of the impact of macroH2A loss on the melanoma TME. In the absence of macroH2A, inflammatory genes in CAFs become intrinsically hyperinducible owing to increased enhancer activity and promoter–enhancer looping. This leads to an increased production of pro-inflammatory cytokines by CAFs, which in turn attract Mrc1+ myeloid cells with a pro-tumour phenotype. Accumulating myeloid cells inhibit CD8+ T-cell-mediated tumour cell killing, which results in increased tumour size in dKO animals. CAF-driven inflammatory signalling could also promote melanoma dedifferentiation through mechanisms that are yet to be determined (dashed lines). Illustration in h by Jill K. Gregory, reproduced with permission from © Mount Sinai Health System. Source data
Extended Data Fig. 1
Extended Data Fig. 1. Characterization of macroH2A WT and dKO murine melanomas.
a) Breeding strategy to obtain WT and dKO mice used for melanoma induction. b) Tumor area in males and females, nWT-M = 17, nWT-F = 21, ndKO-M = 25, ndKO-F = 14. No significant inter-sex differences were observed within genotypes (Kruskal-Wallis with Dunn’s multiple comparisons test). Box plot whiskers represent min-max range, box plot limits – 25th to 75th percentiles, center line – median. c) Kaplan-Meier analysis of disease-free survival. Events represent melanoma growth beyond an area of 50 mm2, nWT = 22, ndKO = 22. P-value = 0.0009, log-rank (Mantel-Cox) test. d) Immunohistochemical scoring of H3S10ph and Ki-67 at 50 DPI in ten random fields per tumor. e) Pagetoid spread of melanocytic cells into epidermal structures scored in ten epidermis-containing fields per tumor on H&E-stained sections. f) Relative pigmented area of the tumor, estimated on a 2X magnification ensemble view of H&E-stained sections. d-f, nWT = 11, ndKO = 13, center line represents median, significance determined using a Mann-Whitney two-tailed test. Exact P-values are provided as numerical source data. g) Tumor-draining axillary lymph nodes stained for S100 (reddish-brown NovaRed substrate color). h) Lung sections of tumor-bearing mice at 50 DPI. g-h, 4X (scale bar = 1 mm) and 20X (scale bar = 100 μm) magnification shown; inserts shown at 2.5X additional magnification. Staining and analysis were performed in 2 animals per genotype with similar results. i) Kaplan-Meier analysis of disease-free survival following nevus induction, nat least 1 WT allele = 7, ndKO = 6. Progression to melanoma, defined as radial and/or vertical lesion growth, was not observed during the lifespan of the mice. j) Validation of antibody specificity for macroH2A variants in immunohistochemistry, using liver of either macroH2A1 or macroH2A2 single KO mice. Scale bar = 100 μm, inserts shown at 5X additional magnification. Experiment was performed twice with similar results. Source data
Extended Data Fig. 2
Extended Data Fig. 2. Murine macroH2A-deficient melanomas harbor a dysfunctional immune microenvironment.
a) Volcano plot of differential gene expression in dKO vs. WT murine melanomas analyzed by RNA-seq. Significant DEGs are colored: red = up in dKO and blue = down in dKO. X and Y axes are zoomed in to depict genes in Fig. 2b. Independent hypothesis weighted Wald test P-values adjusted for multiple comparisons, computed by DESeq2. b) GSEA analysis of Reactome pathways and GO terms in dKO vs. WT murine melanomas. Top 10 significant pathways shown. c) Gating strategy used to delineate tumor-infiltrating myeloid cell subtypes by flow cytometry, shown in a WT tumor. d) Broad immune cell categories not shown in Fig. 2 at 50 DPI, nWT = 12, ndKO = 15 animals except for lymphoid population (sum of T, B and NK cells) where nWT = 8 and ndKO = 11 animals. e) Relative abundance of monocyte subpopulations identified by CCR2 and CX3CR1 expression. nWT = 8 and ndKO = 9 animals. f) Analysis of additional markers of T cell functionality. nWT = 8 and ndKO = 9 animals. g) PD-L1 and PD-L2 staining of CD45+ cells infiltrating WT and dKO melanomas. h) Quantification of indicated populations of non-overlapping peripheral blood immune cell populations at 50 DPI, determined by flow cytometry, nWT = 8, ndKO = 9 animals. i) As in (h) in tumor-naïve mice, nWT = 6, ndKO = 6 animals. j) Quantification of indicated non-overlapping tumor-infiltrating immune cell populations at 35 DPI. k) Proliferative status and anti-tumor activity of CD8 + T cells in (j), assessed as percentage of Ki-67 positivity and interferon-gamma production, respectively. j-k, nWT = 6, ndKO = 6 animals. d-f and h-k, Mann-Whitney two-tailed test P-values: * < 0.05, ** < 0.01, center line represents median. Exact P-values are provided as numerical source data. Non-significant differences are not labeled. Source data
Extended Data Fig. 3
Extended Data Fig. 3. Details of scRNA-seq analysis to annotate components of the melanoma TME.
a) Expression of marker genes of major cell lineages expected in the TME, shown on UMAP plots. b) Distribution of cell type signatures derived from murine melanoma scRNA-seq in spot types of the murine melanoma ST dataset. c) Selected cluster-specific markers used to annotate neural crest (NC) cell types/states. d) Violin plots of indicated gene expression signatures measured across NC clusters. e) Scatter plot of antagonistic MITF and AXL-driven gene expression signatures identified in human melanoma, across NC clusters in (d). f) Distribution of predicted cell cycle stages across NC clusters in (d). g) Pseudotime analysis of reclustered NC cells. Top, original neural crest clusters after re-integration, dimensionality reduction and UMAP embedding. Bottom, cell trajectories in pseudotime anchored in the melanocyte cluster (red dot). h) Representation of expression profiles of key genes across pseudotime in NC clusters. i) As in (c), for myeloid cells. j) Circos plots showing correspondence between myeloid cell clusters identified and myeloid cell identities in a published scRNA-seq datasets of murine subcutaneous sarcoma. k) As in (j) in murine lung adenocarcinoma. l) UMAP plot of lymphoid cells after re-integration, dimensionality reduction and UMAP embedding, labeled according to their original clusters (top) and annotations generated by reclustering (bottom). m) Selected markers used to annotate lymphoid cell types/states following reclustering in (l). n) UMAP representation of differential abundance analysis of cells in (l) performed with Milo. Cells are grouped into overlapping neighborhoods based on their K-nearest neighbor graph position, depicted as circles proportional in size to the number of cells contained, colored by log fold change of abundance between genotypes. Graph edge thickness is proportional to the number of cells shared between adjacent neighborhoods. o) Relative abundance across lymphoid clusters as annotated in (l) and (m), shown as percentage of total viable cells in each tumor. Source data
Extended Data Fig. 4
Extended Data Fig. 4. Characterization of CAF clusters in the melanoma TME and their in vitro counterparts.
a) Dot plot of markers used to annotate CAFs, and CAF cluster specific genes. b) Violin plots of murine pancreatic cancer CAF population signatures measured across murine melanoma CAF clusters. c) Scatter plot of inflammatory and myocyte-like CAF gene expression signatures identified in pancreatic cancers across murine melanoma CAF clusters. d) Gene signatures derived from differentially expressed genes in the bulk RNA-seq dataset, calculated across clusters and genotypes. Significance defined as Wilcoxon rank sum test adjusted P-value < 0.05, cluster-average log2 fold change > 0.02 or < -0.02. Exact P-values are provided in Table 3. e) Violin plot of an immediate early gene (IEG) signature in CAFs. Significant dKO vs. WT differences are present within each cluster (Wilcoxon rank sum test adjusted P-value < 0.05, cluster-average log2 fold change > 0.1). Exact P-values are provided in Table 3. f) Significant Hallmark pathways in GSEA analysis of dKO vs. WT CAF clusters. g) As in f, for the NC Zeb2 cluster. h) Violin plots of macroH2A gene expression in WT melanoma. i) Violin plot of Pdgfra expression in the melanoma TME. j) Intersections of DEGs across single-cell and bulk RNA-seq modalities in CAFs. DEGs in the scRNA-seq dataset were determined by grouping all CAF clusters as one, prior to contrasting by genotype. P-values of Fisher’s exact test shown. k) Genotyping of cultured CAFs and immortalized dermal fibroblasts (iDFs) compared to somatic DNA. YUMMER1.7 cells are used as a reference for Braf allele recombination. Experiment was performed twice with similar results. l) Flow cytometric detection of PDGFRα on cultured CAFs. YUMMER1.7 is used as a negative control. m) Western blot showing deletion of macroH2A and accumulation of FOSL2 in dKO cultured CAFs. Histone H4 and NF-κB p65 are used as loading controls. Experiment was performed twice with similar results. n) Protein levels of indicated cytokines in serum-starved and stimulated cultured CAFs, measured by multiplexed bead-capture assay. o) Expression normalized to housekeeping controls of indicated immediate-early and cytokine genes determined by RT-qPCR in iDFs from WT and dKO mice at indicated time after serum stimulation. Mean of 3 PCR replicates shown, error bars represent SEM. Source data
Extended Data Fig. 5
Extended Data Fig. 5. MacroH2A regulates pro-inflammatory signals in mouse and human melanoma CAFs.
a) Ligand-receptor analysis of cell signaling performed with CellChat summarizing interaction strength between broad cell types. Arrows depicting signaling direction are colored according to emitting cell type. Arrow weight is proportional to interaction strength. b) Differential interaction strength and number between WT and dKO cell type pairs. Arrows are colored according to direction of change (WT – blue, dKO – red) and weight represents amplitude of change. c) Transwell assay measuring the migration of CMFDA-labeled WT bone marrow-derived monocytes towards unlabelled WT or dKO CAFs. Average cell counts of 3 technical replicates and error bars representing SEM are shown for WT and dKO CAF conditions. No replicates are performed for negative and positive controls. Individual experiments using different monocyte donors shown. d) Comparison of deconvoluted immune cell type scores between TCGA metastatic melanoma tumors with MACROH2A1/2 high and low expression levels. n = 123 biologically independent samples per category. e) As in (d) for estimated immune, stromal and tumor purity scores. nprimary = 35, nmetastatic = 123 biologically independent samples per category. d-e, Wilcoxon rank-sum test P-values adjusted for multiple comparisons shown: * < 0.05, ** < 0.01, *** < 0.001, **** < 0.0001. Exact P-values are provided as numerical source data. Box plot center line represents the median, box plot limits – 25th to 75th percentiles, whiskers extend from the box limit to the most extreme value no further than 1.5 * inter-quartile range from the box limit, any data beyond whiskers is plotted as individual points. f) Expression of genes associated with anti-tumor cytotoxic activity in human primary and metastatic melanoma samples from the TCGA cohort, segregated by MACROH2A1 or MACROH2A2 gene expression levels. High and low terciles are compared. Independent hypothesis weighted Wald test P-values adjusted for multiple comparisons, computed by DESeq2, shown. g) Detection of CAF markers by western blot in a panel of 11 human melanoma primary CAF cultures. Membrane stain for total protein shown for loading control. h) Correlation between macroH2A2 protein levels and indicated cytokine secretion in CAF cultures from (g). n = 11 biologically independent samples. Error bars correspond to SEM of 3 technical replicates of blot-based quantification for macroH2A2 and up to 3 dilutions each in 2 technical replicates for cytokine ELISA. Spearman correlation statistics, calculated on the average values without considering individual technical replicates, are shown. i) UMAP plots of a human pan-cancer scRNA-seq dataset, together with macroH2A gene expression in fibroblasts. j) Correlation analysis between pseudobulk expression levels of selected cytokines and macroH2A genes in CAFs from (i). Pearson correlation coefficients and significance shown above the diagonal, pairwise scatter plots shown below. Histograms of individual gene expression comprise the diagonal. P-values shown: ** < 0.01, *** < 0.001. Exact P-values are provided as numerical source data. Source data
Extended Data Fig. 6
Extended Data Fig. 6. Genome-wide macroH2A2 occupancy in cultured WT CAFs.
a) Correlation of genome-wide enrichment of macroH2A between ChIP-seq and CUT&RUN methodologies. ChIP-seq and associated inputs were previously generated in dermal fibroblasts, CUT&RUN was performed in serum-starved unstimulated and serum-stimulated WT CAFs, with associated IgG control. Pearson’s correlation coefficients shown, conditions are clustered based on Euclidean distance. b) Metagene profile of macroH2A CUT&RUN signal in cultured WT CAFs before and after serum stimulation across genes binned into quartiles according to their expression levels. Genes not detected are either not expressed or not mappable. n = 3000 randomly selected genes within each group. c) Metagene profile of macroH2A CUT&RUN signal in cultured WT CAFs before and after serum stimulation at different classes of MCDs and genomic regions where MCDs are absent. d) Size distributions of regions in (c). Box plot center line represents the median, box plot limits – 25th to 75th percentiles, whiskers extend from the box limit to the most extreme value no further than 1.5 * inter-quartile range from the box limit. c-d, nsuper = 1560, nstandard = 5440, nlow = 1556, nabsent = 23615 regions. e) Proportion of the genome comprised within different classes of MCDs.
Extended Data Fig. 7
Extended Data Fig. 7. Enhancer and chromatin accessibility analysis in the absence of macroH2A in CAFs.
a) Metagene profile of H3K27ac levels in serum-stimulated cultured CAFs across genes binned into quartiles according to their expression levels. Genes not detected are either not expressed or not mappable. n = 3000 randomly selected genes within each group. b) Changes in H3K27ac signal at all detected enhancers in cultured CAFs depicted by MA plot. TEs and SEs are separated by a vertical dashed line. Enhancers with a log2 fold change > 0.75 are shown in color for the respective genotype. c) Heatmap of H3K27ac ChIP signal in serum-stimulated cultured CAFs centered around ATAC peaks located in enhancers that gain, lose or maintain static H3K27ac levels in dKO vs. WT, ndKO up = 6659, ndKO down = 5211, nStatic = 18961. Number of TEs and SEs noted for each cluster. d) ATAC-seq signals at peaks in (c). e) Hockey plot highlighting TEs and SEs gaining H3K27ac in dKO within 50 kb of upregulated inflammatory genes (red) among all TEs and SEs ranked by H3K27ac signal in cultured CAFs. f) Average profile of ATAC-seq signal at differentially accessible regions in dKO vs. WT sorted CAFs, ndKO up = 667, ndKO down = 668, nStatic = 3000 randomly selected non-changing peaks. g) Top 3 hits of HOMER TF motif analysis of regions of increased accessibility in dKO vs. WT sorted CAFs. Fisher Exact test P-values shown. h) H3K27ac ChIP signal in serum-stimulated cultured CAFs at ATAC-seq regions defined in (j). The same scale was used as in (g) for comparison.
Extended Data Fig. 8
Extended Data Fig. 8. Transcriptomic and enhancer analysis in the absence of macroH2A in iDFs.
a) Significant Hallmark pathways in GSEA analysis of dKO vs. WT performed in iDFs prior to (0 min) and post serum stimulation (30 min). b) Venn diagrams representing the extent of overlap between pre- and post- serum stimulation in genes up- and downregulated by macroH2A deficiency in iDFs. c) Heatmap of a subset of inflammatory genes hyper-induced by serum stimulation in the absence of macroH2A. d) Average profile of H3K27ac ChIP signal in serum-stimulated WT vs. dKO iDFs at promoters of all differentially expressed and static genes of matched expression levels following serum stimulation, ndKO up = 494, ndKO down = 485, nStatic = 2937. e) Average profile of macroH2A1 and macroH2A2 signal in dermal fibroblasts at genes described in (d). f) As in (d), for enhancer H3K27ac peaks differentially enriched in H3K27ac, ndKO up = 1438, ndKO down = 1764, nStatic = 7037. g) Average profile of macroH2A1 and macroH2A2 signal in dermal fibroblasts at regions described in (f). d-g, mean signal value and 95% CI as determined by bootstrap shown.
Extended Data Fig. 9
Extended Data Fig. 9. pcMicro-C analysis in WT and dKO CAFs.
a) Size distribution of MNAse-digested double cross-linked input chromatin for Micro-C. b) Distribution of sizes and scores of chromatin loops called at 10 kb resolution, retained for further analysis. c) Enrichment of indicated functional elements at the distal end of loops, compared to a random distribution. Number of overlaps of significantly called interactions with genomic features are shown in solid color for n = 1 biological sample. Random regions of the same length and count of the significant regions are chosen, and the overlaps with genomic features are counted. The operation is permuted n = 100 times and the average number of overlaps is shown in light color. Error bars represent 95% confidence intervals. d) Bait map plots depicting all called interactions for the bait located at the indicated gene promoter. Dotted lines represent significance thresholds. Only highly significant loops (passing threshold = 5, red dots) are considered. Colored bars represent enhancers and MCDs as in (g). e) Proportions of enhancers associated with changes in chromatin looping, according to changes in their H3K27ac level and location within MCDs. f) Proportions of genes associated with net gain or loss of loops, according to changes in their expression level and location within MCDs. g) UCSC browser screenshots of the Kitl locus and its chromatin environment. Bars under RNA-seq and ATAC-seq tracks indicate significantly up- (red) or downregulated (blue) genes or accessible regions in dKO vs. WT sorted CAFs. Bars under macroH2A CUT&RUN tracks indicate ‘super’ (purple) and “standard’ (magenta) macroH2A chromatin domains. Below H3K27ac tracks, bright and dark bars indicate TEs and SEs, respectively; red, blue, and green denote gain, loss, and no change, respectively, of H3K27ac level in dKO vs. WT CAFs. Chromatin loops at 10 kb resolution, originating at the promoter of the highlighted gene, are shown in red if specific for the dKO, blue for the WT, and black if shared. h) as in e, for the Cxcl1 locus. Source data

References

    1. Ghiraldini FG, Filipescu D, Bernstein E. Solid tumours hijack the histone variant network. Nat. Rev. Cancer. 2021;21:257–275. doi: 10.1038/s41568-020-00330-0. - DOI - PMC - PubMed
    1. Bönisch C, Hake SB. Histone H2A variants in nucleosomes and chromatin: more or less stable? Nucleic Acids Res. 2012;40:10719–10741. doi: 10.1093/nar/gks865. - DOI - PMC - PubMed
    1. Pehrson JR, Fried VA. MacroH2A, a core histone containing a large nonhistone region. Science. 1992;257:1398–1400. doi: 10.1126/science.1529340. - DOI - PubMed
    1. Costanzi C, Pehrson JR. MACROH2A2, a new member of the MACROH2A core histone family. J. Biol. Chem. 2001;276:21776–21784. doi: 10.1074/jbc.M010919200. - DOI - PubMed
    1. Sun Z, Bernstein E. Histone variant macroH2A: from chromatin deposition to molecular function. Essays Biochem. 2019;63:59–74. doi: 10.1042/EBC20180062. - DOI - PubMed

Publication types