. 2023 Oct;5(10):1747-1764.
doi: 10.1038/s42255-023-00855-2. Epub 2023 Aug 21.

Glutarate regulates T cell metabolism and anti-tumour immunity

Affiliations

Glutarate regulates T cell metabolism and anti-tumour immunity

Eleanor Minogue et al. Nat Metab. 2023 Oct.

Abstract

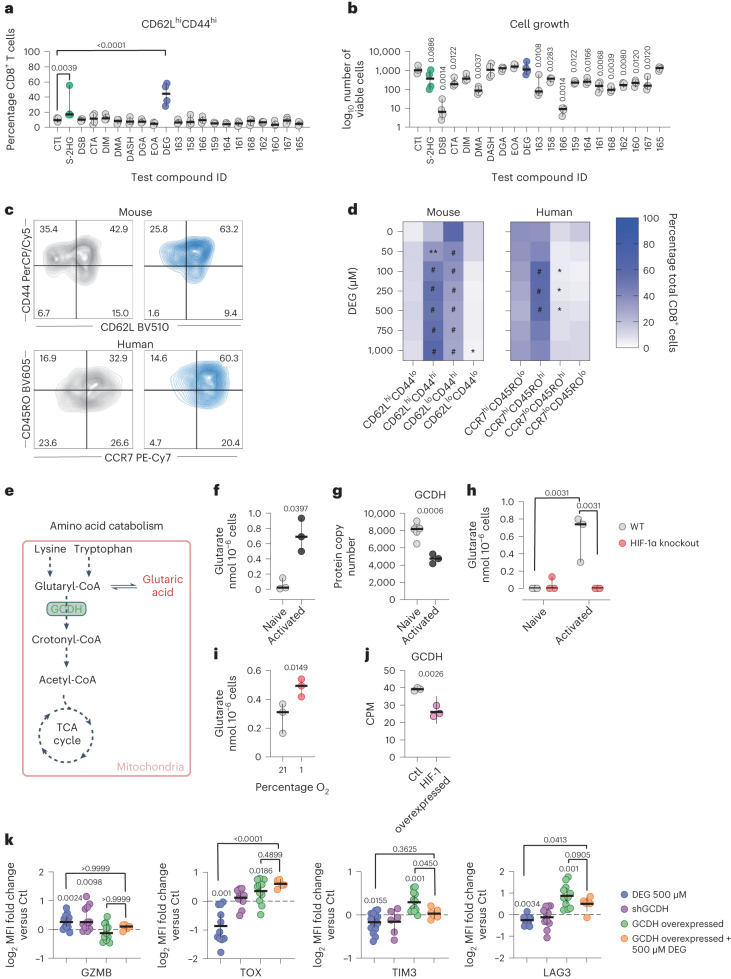
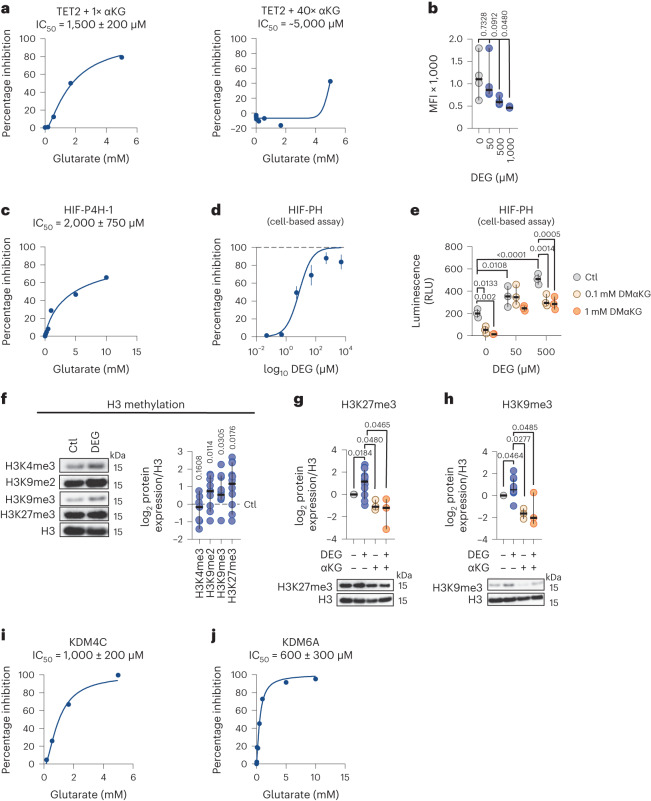
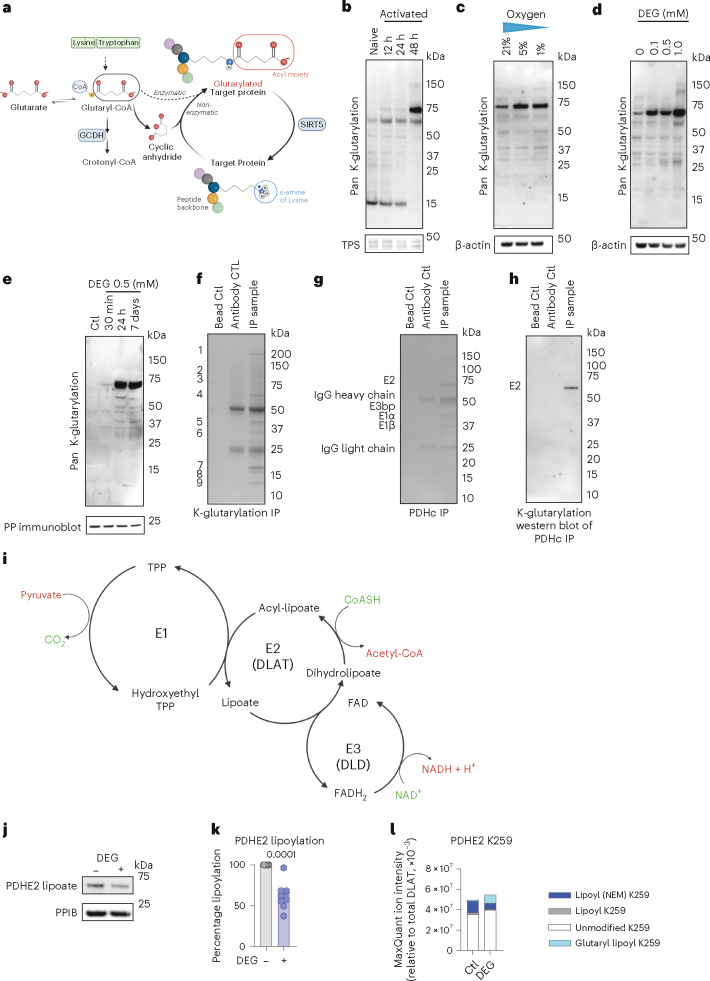
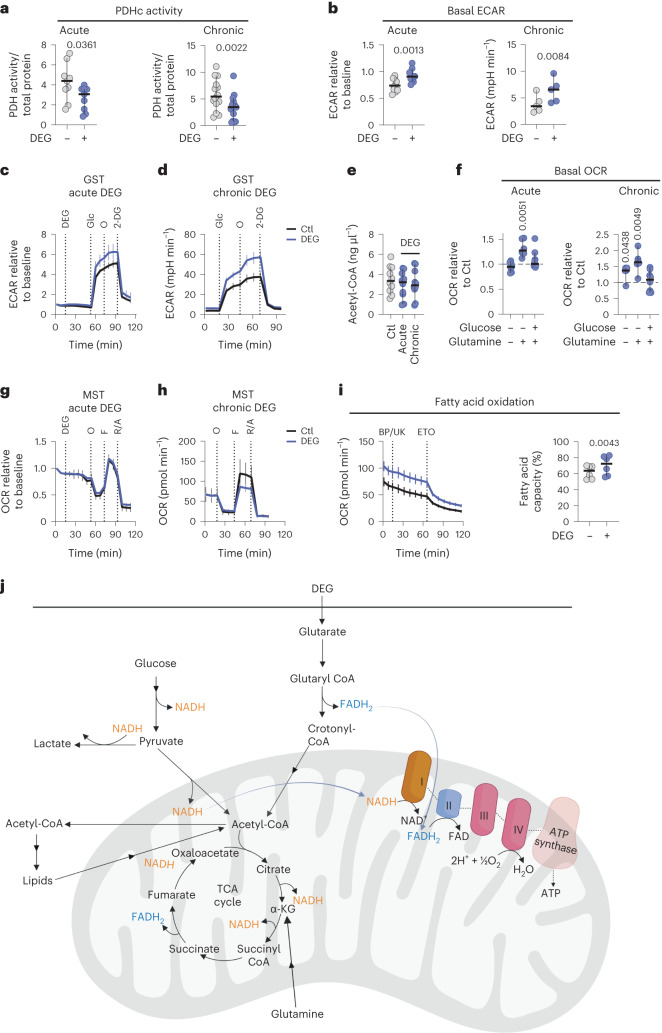
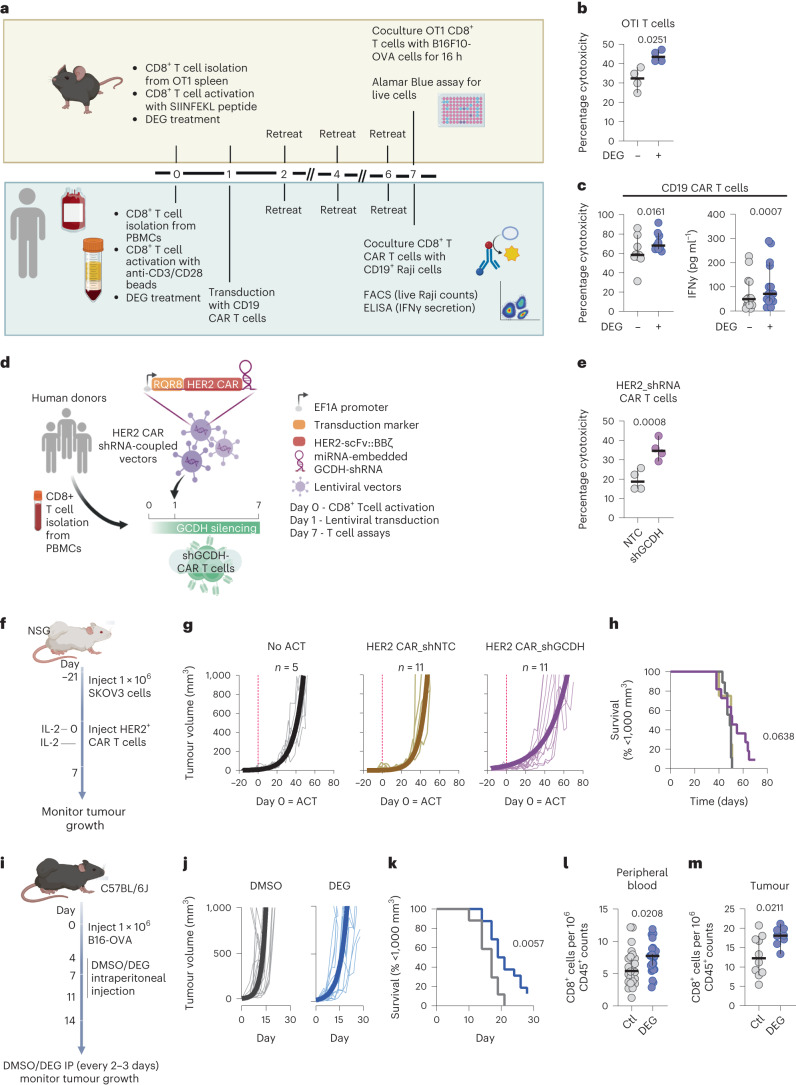
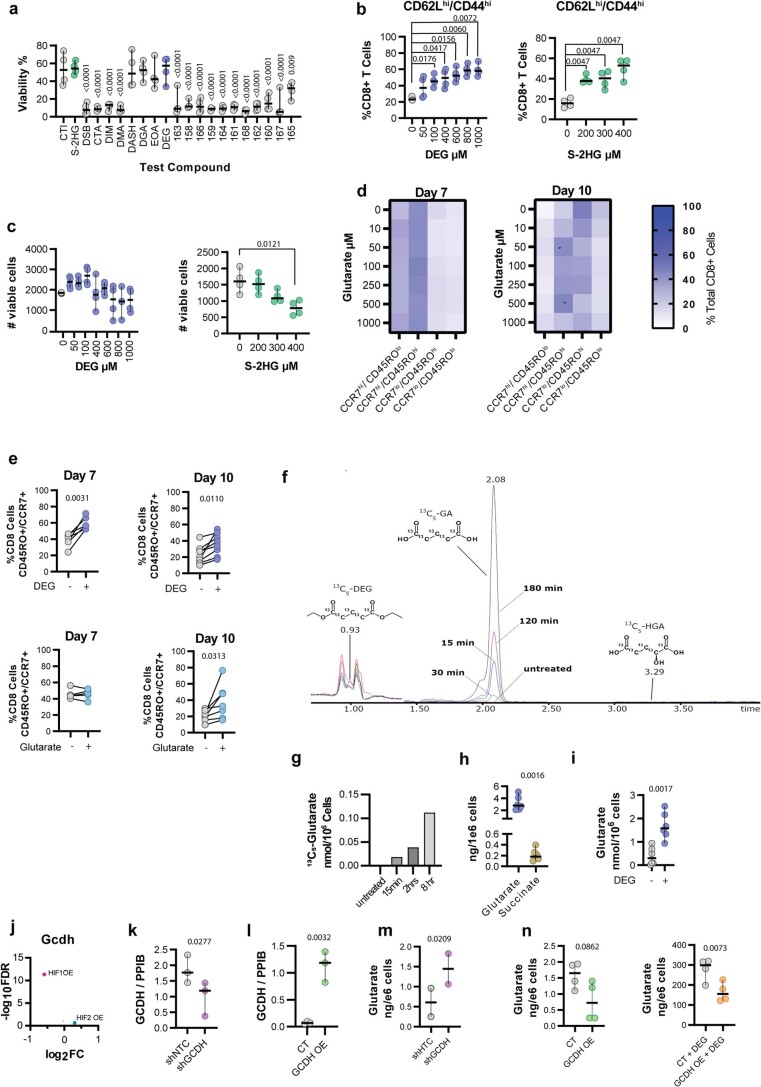
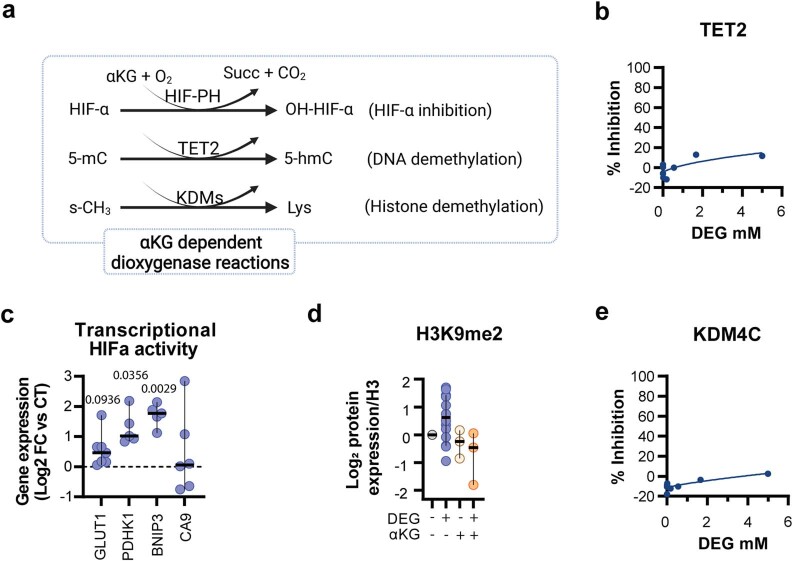
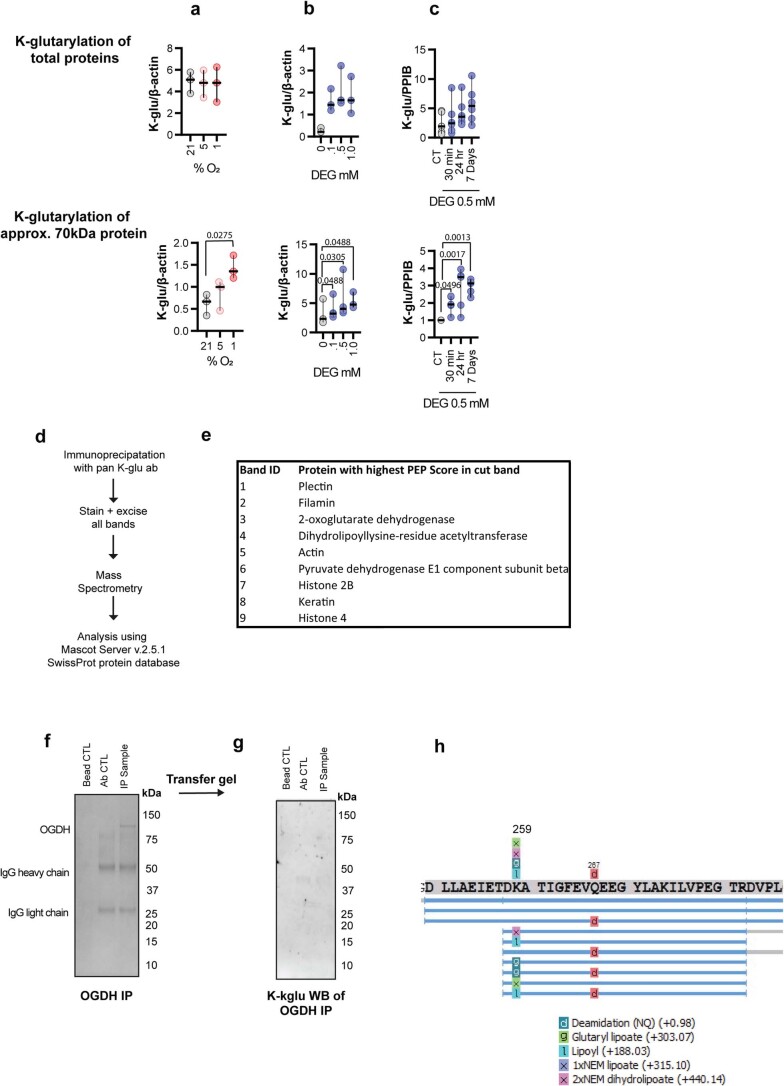
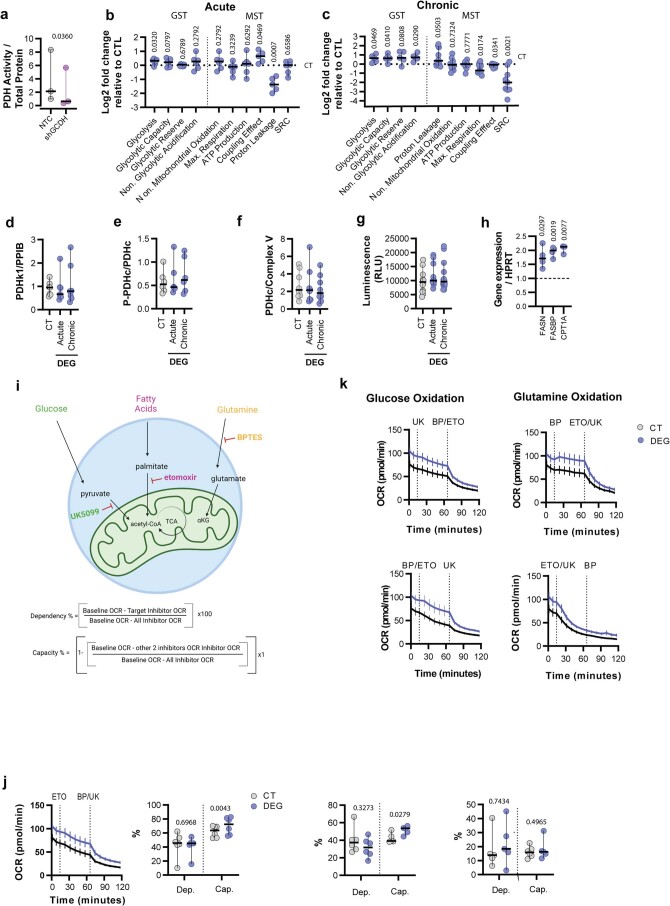
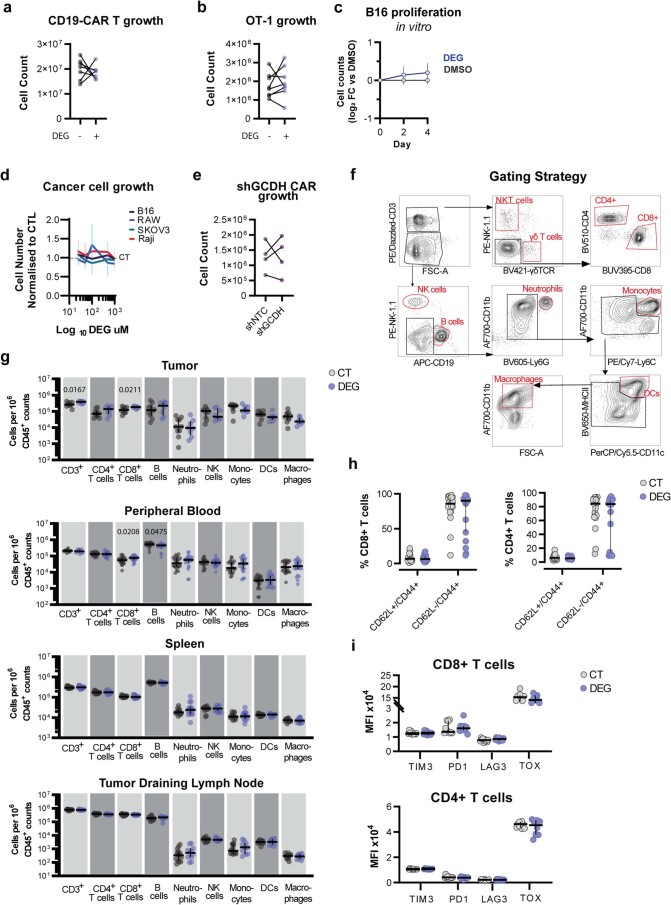
T cell function and fate can be influenced by several metabolites: in some cases, acting through enzymatic inhibition of α-ketoglutarate-dependent dioxygenases, in others, through post-translational modification of lysines in important targets. We show here that glutarate, a product of amino acid catabolism, has the capacity to do both, and has potent effects on T cell function and differentiation. We found that glutarate exerts those effects both through α-ketoglutarate-dependent dioxygenase inhibition, and through direct regulation of T cell metabolism via glutarylation of the pyruvate dehydrogenase E2 subunit. Administration of diethyl glutarate, a cell-permeable form of glutarate, alters CD8+ T cell differentiation and increases cytotoxicity against target cells. In vivo administration of the compound is correlated with increased levels of both peripheral and intratumoural cytotoxic CD8+ T cells. These results demonstrate that glutarate is an important regulator of T cell metabolism and differentiation with a potential role in the improvement of T cell immunotherapy.


Conflict of interest statement

The authors declare no competing interests.

Figures

Fig. 1
Fig. 1. Glutarate is an endogenous regulator of CD8+ T cell function.
a,b, Percentage of CD62LhiCD44hi (a) and number of total murine CD8+ T cells (b) after 7 days of treatment with 400 µM of test compound. Ordinary one-way analysis of variance (ANOVA) relative to untreated control cells (Ctl); n = 4. c, Representative flow cytometry counter of mouse and human CD8+ T cells treated with or without 500 µM DEG for 7 days. Grey (left), Ctl; blue (right), DEG 500 µM. d, Heatmap representing the proportion of mouse CD8+ T cells expressing CD62L/CD44 (left) and the proportion of human CD8+ T cells expressing CCR7/CD45RO (right) after 7 days of treatment with increasing concentrations of DEG. Two-way ANOVA relative to Ctl; n = 4–5. e, Pathway of lysine and tryptophan catabolism (adapted from BioRender.com). f, Glutarate levels in naive and 72-h activated mouse CD8+ T cells. Two-tailed paired t-test; n = 3. g, GCDH protein copy number in naive or activated CD8+ T cells from P14 transgenic mice. Two-tailed unpaired t-test; n = 3. Data from the ImmPRes database. h, Glutarate levels in naive or 72-h activated CD8+ T cells isolated from Hif-1αloxP/loxP or Hif-1αloxP/loxP dlckCre mice (HIF knockout). Two-way ANOVA; n = 3. i, Glutarate levels in mouse CD8+ T cells cultured at 21% or 1% oxygen for 24 h from day 5 after activation. Two-tailed paired t-test; n = 3. j, GCDH gene counts per million (CPM) in HIF-1-overexpressing mouse CD8+ T cells. Two-tailed unpaired t-test; n = 3. k, Expression of markers of T cell differentiation and exhaustion in human CD8+ T cells after 7–10 days of treatment with or without DEG 500 µM or transduction with either shGCDH or GCDH-overexpressing vector. Expression was determined by flow cytometry and is shown as the mean fluorescence intensity (MFI) fold change relative to the untreated control (black dashed line). Two-tailed, one-sample Wilcoxon rank-sum test and ordinary one-way ANOVA. (GZMB DEG 500 µM, n = 13; GZMB shGCDH, n = 11; GZMB GCDH overexpressed, n = 11; GZMB GCDH overexpressed + DEG 500 µM, n = 5; TOX DEG 500 µM, n = 11; TOX shGCDH, n = 11; TOX GCDH overexpressed, n = 11; TOX GCDH overexpressed + DEG 500 µM, n = 5; TIM3 DEG 500 µM, n = 16; TIM3 shGCDH, n = 6; TIM3 GCDH overexpressed, n = 12; TIM3 GCDH overexpressed + DEG 500 µM, n = 6; LAG3 DEG 500 µM, n = 12; LAG3 shGCDH, n = 11; LAG3 GCDH overexpressed, n = 11; LAG3 GCDH overexpressed + DEG 500 µM, n = 6). All scatter plots show the median + the 95% confidence interval (CI), where each dot represents one donor (murine or human as indicated). *P < 0.05, **P < 0.01, ***P < 0.001, ****P < 0.0001.
Fig. 2
Fig. 2. Glutarate is an inhibitor of αKG-dependent reactions.
a, Cell-free enzymatic inhibition assay for TET2 using increasing concentrations of glutarate, using 1× IC50 for αKG (left) or 40× IC50 for αKG (right). b, 5hmC MFI, as determined using flow cytometry, in human CD8+ T cells after 7 days of treatment with increasing concentrations of DEG. Ordinary one-way ANOVA; n = 4. c, Cell-free enzymatic inhibition assay for HIF-P4H-1 using increasing concentrations of glutarate. d, HIF-PH activity luciferase reporter assay in mouse embryonic fibroblasts (MEFs) treated for 16 h with increasing concentrations of DEG. Data points are the mean ± s.e.m. n = 9. e, HIF-PH activity luciferase reporter assay in MEFs treated for 16 h with DEG and dimethyl αKG (DMαKG). Two-way ANOVA; n = 3. RLU, relative light unit. f, Representative western blot and log2 fold change in protein expression of specific histone 3 (H3) methylation sites in human CD8+ T cells treated for 7 days with or without DEG 500 µM. Each dot represents one human donor normalized to total H3 and relative to untreated control (dashed black line). Two-sided, one-sample t-test; H3K4me3, n = 6; H3K9me2, n = 11; H3K9me3, n = 11; H3K27me3, n = 10. g, Representative western blots and log2 fold change protein expression of H3K27me3 in human CD8+ T cells treated with or without 500 µM DEG or 500 µM αKG for 7 days. Ordinary one-way ANOVA; DEG, n = 10; αKG, n = 3; αKG + DEG, n = 3. h, Representative western blots and log2 fold change protein expression of H3K9me3 in human CD8+ T cells treated with or without 500 µM DEG or 500 µM αKG for 7 days. Ordinary one-way ANOVA; n = 3–5. DEG, n = 11; αKG, n = 3; αKG + DEG, n = 3. i, Cell-free enzymatic inhibition assay for KDM4C using increasing concentrations of glutarate. j, Cell-free enzymatic inhibition assay for KDM6A using increasing concentrations of glutarate. Cell-free enzymatic assay graphs showing Michaelis–Menten line of best fit of at least three independent experiments. All scatter plots show the median + 95% CI, where each dot represents one donor as indicated. *P < 0.05, **P < 0.01, ***P < 0.001, ****P < 0.0001. Source data
Fig. 3
Fig. 3. Glutarylation of PDH disrupts lipoylation.
a, Model of protein lysine glutarylation (adapted from BioRender.com). b, Representative western blot of naive and activated human CD8+ T cells. n = 3. TPS, total protein stain. c, Representative western blot of activated human CD8+ T cells cultured at different oxygen tensions (21%, 5% or 1%). n = 3. d, Representative western blot of human CD8+ T cells cultured with increasing concentrations of DEG for 7 days. n = 4. e, Representative western blot of activated human CD8+ T cells cultured with 500 µM DEG for several different time lengths as indicated. All samples were collected 7 days after activation. n = 5. f, Representative Coomassie brilliant blue staining of proteins immunoprecipitated with a pan-K-glutarylation antibody and separated by SDS–polyacrylamide gel electrophoresis (PAGE). A total of 30 × 106 mouse CD8+ T cells, 7 days after activation, were used. n = 3. g, Representative Coomassie brilliant staining of immunoprecipitated PDHc separated by SDS–PAGE. A total of 30 × 106 mouse CD8+ T cells, 7 days after activation, were used. n = 3. h, Representative K-glutarylation western blot of immunoprecipitated PDHc as described in Fig. 4g. n = 3. i, Schematic of the reactions catalysed by the individual subunits of the PDHc (adapted from BioRender.com). j, Representative western blot of PDHE2 lipoate levels in human CD8+ T cells treated with 500 µM DEG for 24 h. n = 12. k, Percentage lipoylation calculated from Fig. 4k, where untreated control represents 100% lipoylation. Two-tailed, paired t-test; n = 12. l, Quantified proteomic analysis of select PTMs on PDHE2 K259, relative to total PDHE2, using HeLa cells treated with 500 µM DEG for 24 h. Source data
Fig. 4
Fig. 4. Glutarate modulates mitochondrial function by inhibiting PDH.
a, PDHc activity of CD8+ T cells treated with DEG for 30 min (acute) or 7 days (chronic), normalized to total protein concentration. Two-tailed, paired t-test; acute, n = 9; chronic, n = 14. b, Basal ECAR in CD8+ T cells as determined by Seahorse analysis after 30-min DEG treatment via Seahorse injection (acute, left) or after 7 days of in vitro culture with DEG (chronic, right). Acutely treated cells normalized to ECAR levels before DEG/Ctl injection. Two-tailed, paired t-test; acute, n = 10; chronic, n = 5. c, Seahorse analysis of ECAR levels in CD8+ T cells 7 days after activation. n = 10. d, Seahorse analysis of ECAR measurements during a standard GST of CD8+ T cells treated with or without DEG for 7 days. n = 6. e, Acetyl-CoA levels in CD8+ T cells treated with DEG for 30 min (acute) or 7 days (chronic). Repeated measures one-way ANOVA; n = 10. f, Basal OCR levels in CD8+ T cells as determined by Seahorse analysis after 30-min DEG treatment via Seahorse injection. During the assay, cells were plated in XF medium with or without glucose and glutamine as indicated. OCR is represented as the fold change relative to untreated control. Two-tailed, one-sample t-test; acute, + glucose, − glutamine, n = 8; acute, − glucose, + glutamine, n = 6; acute, + glucose, + glutamine, n = 10; chronic, − glucose, − glutamine, n = 5; chronic, − glucose, + glutamine, n = 6; chronic, + glucose, + glutamine, n = 8. g, Seahorse analysis of OCR in CD8+ T cells (7 days after activation). n = 10. h, Seahorse analysis of OCR measurements during a standard GST of CD8+ T cells treated with or without DEG for 7 days. n = 6. i, Fatty acid oxidation capacity as determined by OCR measurements during a mitochondrial fuel flex test of CD8+ T cells treated with or without DEG for 7 days as described in Extended Data Fig. 4i. Calculated percentage of fatty acid capacity (right): two-tailed, paired t-test; n = 6. j, Schematic illustrating the contribution of glutarate, glucose, lipids and glutamine to cellular metabolism (adapted from BioRender.com). All experiments shown used 500 µM DEG. All scatter plots show the median + 95% CI, where each dot represents one human. The ECAR and OCR time course graphs show the mean and error with the 95% CI.
Fig. 5
Fig. 5. Glutarate reduces tumour growth and increases CD8+ T cell numbers and tumour infiltration.
a, Model of in vitro cytotoxicity assays; 500 µM DEG was used (adapted from BioRender.com). ELISA, enzyme-linked immunosorbent assay; FACS, fluorescence-activated cell sorting. b, Percentage cytotoxicity of OT1 cells after coculture with B16F10-OVA cells as described in a. Two-tailed, paired t-test; n = 4. c, Percentage cytotoxicity (left) and IFNγ expression (right) of CD19 CAR T cells after coculture with CD19+ Raji cells as described in a. Two-tailed, paired t-test; cytotoxicity, n = 9; IFNγ, n = 14. d, Model of HER2 CAR T shRNA cell generation (adapted from BioRender.com). e, Percentage cytotoxicity of HER2 CAR T cells with embedded shGCDH or shNTC as determined by Alamar Blue assay after coculture with HER2-expressing SKOV3 cells. Two-tailed, paired t-test; n = 4. f, Adoptive cell therapy (ACT) model with CAR T cells. Tumour growth was monitored every 2–3 days until day 70. g, Tumour growth data. The thin lines represent tumour growth from individual mice and the thick lines represent an exponential (Malthusian) growth curve. h, Survival curves using 1,000 mm3 tumour volume as the threshold. log-rank (Mantel–Cox) test. i, Tumour growth model; 1.0 × 106 B16F10-OVA cells were injected subcutaneously into C57BL/6J mice. From day 4 after tumour inoculation, mice were injected interperitoneally with 10 mg kg−1 DEG or dimethyl sulfoxide (DMSO) Ctl every 2–3 days. On day 14 after tumour inoculation, peripheral blood, tumour, spleen and tumour-draining lymph node from some mice were processed to single-cell suspensions and analysed by flow cytometry. Tumour growth was monitored until day 30. j, Tumour growth data. The thin lines represent tumour growth from individual mice and the thick lines represent an exponential (Malthusian) growth curve. k, Survival curves using 1,000 mm3 tumour volume as the threshold. log-rank (Mantel–Cox) test; n = 14. l, Frequency of CD8+ T cells in peripheral blood 14 days after tumour inoculation. Two-tailed t-test; n = 25. m, Frequency of CD8+ T cells in the tumours 14 days after tumour inoculation. Two-tailed, t-test; Ctl, n = 10; DEG, n = 8. All scatter plots show the median and 95% CI, where each dot represents one donor (human or murine as indicated).
Extended Data Fig. 1
Extended Data Fig. 1. Glutarate is an endogenous regulator of CD8+ T cell function.
a, Percentage viability of murine CD8+ T cells following 7 days of treatment with 400 µM of test compound, as determined by flow cytometry. Ordinary one-way ANOVA relative to CT; n = 4. b, Percentage of murine CD62Lhi/CD44hi CD8+ T cells following 7 days of treatment with increasing concentrations of DEG (left) or S-2HG (right). Ordinary one-way ANOVA; n = 4. c, Number of viable murine CD8+ cells following 7 days of treatment with increasing concentration of DEG (right) or S-2HG (left), as determined by counting beads and flow cytometry. Ordinary one-way ANOVA relative to CT; n = 4. d, Heatmap representing the proportion of human CD8+ T cells expressing CCR7/CD45RO following 7 or 10 days treatment with increasing concentrations of DEG. Two-way ANOVA relative to CT; n = 4-5. e, Percentage of CD62Lhi/CD44hi human CD8+ T cells human 7- or 10-days culture with DEG 500 µM or Glutarate 500 µM. Two-tailed paired t-test; DEG 7 days n = 6; DEG 10 days n = 8, Glutarate 7 days n = 5; Glutarate 10 days n = 8. f, Chromatograms of isotope tracing. Human CD8+ T cells were treated with 13C5-DEG for varying time length and mass spectrometry for glutarate was performed. g, Quantified 13C5-Glutarate from cells treated as described and shown as chromatograms in Extended Data Fig. 1f. h, Glutarate and succinate levels in activated human CD8+ T cells. Two-tailed paired t-test; n = 6. i, Glutarate levels in CD8+ T cells cultured -/+ DEG 500 µM for 7 days. Two-tailed paired t-test; n = 6. j, Gcdh levels in transcripts HIF1 OE (HIF1AAA) and HIF2 OE (HIF2AAA) – transduced mouse CD8+ T cells, relative to vector control. k, GCDH levels in T cells transduced with an shNTC or shGCDH vectors as determined by western blot analysis. Two-tailed paired t-test; n = 3. l, GCDH levels in T cells transduced with a CT or GCDH overexpressing vector as determined by western blot analysis. Two-tailed paired t-test; n = 3. m, Glutarate levels in HEK293 cells transduced with shGCDH overexpressing vectors used in Fig. 1k and Extended Data Fig. 1k. Two-tailed paired t-test; n = 2. n, Glutarate levels in HEK293 cells transduced with GCDH overexpressing vectors and treated with 500 µM and used in Fig. 1k and Extended Data Fig. 1l. Two-tailed paired t-test; n = 4. All scatter plots and bar charts show median and 95% CI where each dot represents one human donor. *p < 0.05. Source data
Extended Data Fig. 2
Extended Data Fig. 2. Glutarate is an inhibitor of αKGDDs.
a, Illustration of alpha-ketoglutarate (αKG) dependent dioxygenase (αKGDD) reactions investigated in this study. (Adapted from BioRender.com) b, Cell free enzymatic inhibition assay for TET2 using increasing concentrations of DEG. c, qPCR analysis of CD8+ T cells treated with 500 µM DEG for 7 days. Each dot represents one human donor relative to untreated donor control (dotted black line), normalised to HPRT. Two-tailed one sample t-test; GLUT1 n = 8; PDHK1 n = 5; BNIP3 n = 5; CA9 n = 6. d, Log2 FC protein expression of H3K9me2 in human CD8+ T cells treated with +/- 500 µM DEG and 500 µM αKG for 7 days. Ordinary one-way ANOVA; DEG n = 11, αKG n = 3; αKG + DEG n = 3. e, Cell free enzymatic inhibition assay for TET2 using increasing concentrations of glutarate and 5x αKG than in Fig. 2I. Cell free enzymatic assay graphs show Michaelis-Menten line of best fit of at least 3 independent experiments. All scatter plots show median + 95% CI, where each dot represents one donor as indicated. Source data
Extended Data Fig. 3
Extended Data Fig. 3. Glutarylation of pyruvate dehydrogenase disrupts lipoylation.
a, Quantified total protein lysine-glutarylation or lysine-glutarylation of 67-70 kDa protein, as determined by western blot analysis and relative to β-actin, of human CD8+ T cells which were cultured at different oxygen tensions for 24 h prior to harvest (as in described in Fig. 4c). Ordinary one-way ANOVA; n = 3. b, Quantified total protein lysine-glutarylation or lysine-glutarylation of 67-70 kDa protein, as determined by western blot analysis and relative to β-actin, of cells treated with increasing concentrations of DEG for 7 days (as described in Fig. 4d). Ordinary one-way ANOVA; n = 3. c, Quantified total protein lysine-glutarylation or lysine-glutarylation of 67-70 kDa protein, as determined by western blot analysis and relative to PPIB, of human CD8+ T cells 7 days post activation. Cells were treated with DEG 500 µM for different time lengths as indication and harvested at the same time 7 days post activation (as described in Fig. 4e). Ordinary one-way ANOVA; n = 5. d, Model of lysine-glutarylated protein isolation and identification by mass spectrometry. Lysine-glutarylation immunoprecipitation was performed on 30×106 mouse CD8+ T cells, 7 days post activation. Following protein separation by SDS-PAGE, gel was stained with Coomassie blue and stained bands were excised, gel was digested and mass spectrometry was performed. Data was analysed using the Mascot Server v.2.3.1 and the SwissProt protein database. 3 independent experiments and analysis performed. e, Top hits for each excised band from mass spectrometry described in Fig. 4g. f, Representative immunoprecipitation of Oxoglutarate dehydrogenase (OGDH) complex isolated from 30×106 mouse CD8+ T cells by immunoprecipitation. N = 3. g, Representative K-glutarylation western blot of immunoprecipitated OGDH complex as described in Extended Data Fig. 4f. N = 3. h, Schematic illustrating PEAKS PTM K259 on PDHE2 (selected modifications). All scatter plots show median and 95% CI where each dot represents one human donor. Source data
Extended Data Fig. 4
Extended Data Fig. 4. Glutarate modulates mitochondrial function by inhibiting pyruvate dehydrogenase.
a, PDHc activity of CD8+ T cells transduced with a NTC or shGCDH normalised to total protein. Two-tailed unpaired t-test; n = 3. b-c, Quantitative analysis of MST and GST following acute (30 min) (left) and chronic (7 days) (right) DEG exposure, as described in Fig. 4c-d and Fig. 4h-i, shown as log2 FC relative to untreated control (black dotted line). Two-tailed one sample t-test; Acute GST n = 6; Acute MST n = 6; Chronic GST n = 5, Chronic MST n = 10. d, Protein expression of PDHK1 as determined by western blot analysis. Ordinary one-way ANOVA; n = 7. e, Protein expression of phosphorylated PDHE1α (ser239) as determined by western blot analysis. Ordinary one-way ANOVA; n = 7. f, Protein expression of PDHc as determined by western blot analysis. Ordinary one-way ANOVA; n = 8. g, Glucose uptake by human CD8+ T cells treated with DEG. Data represented as relative light units (RLU). Mixed-effects analysis; n = 9 (acute), n = 14 (chronic). h, qPCR analysis of CD8+ T cells treated with DEG for 7 days. Each dot represents one human donor relative to untreated donor control (dotted black line), normalised to HPRT. Two-tailed one sample t-test; FASN n = 4, FASBP n = 4; CPT1A n = 3. i, Model of mitochondrial fuel flexibility tests and illustration of calculations used to determine mitochondrial fuel oxidative capacity and dependency. (Adapted from BioRender.com) j, Fatty acid oxidation dependency as determined by OCR measurements during a mitochondrial fuel flex test of CD8+ T cells treated with +/- DEG 500 µM for 7 days as described in Extended Data Fig. 4i. Calculated percentage fatty acid dependency (right): Two-tailed paired t-test; n = 5. k, OCR measurements and percentage fuel oxidative capacity (cap) or dependency (dep) during a mitochondrial fuel flex test of CD8+ T cells treated with +/- DEG 500 µM for 7 days, as described in Extended Data Fig. 4i. Calculated percentage fuel capacity and dependency (bottom): Two-tailed paired t-test; Glucose oxidation dependency n = 6; Glucose oxidation capacity n = 5; Glutamine oxidation dependency n = 5; Glutamine oxidation capacity n = 6. All experiment describes used 500 µM DEG. All scatter plots show median and 95% CI where each dot represents one human donor. OCR time course graphs show Mean and Error with 95% CI. Source data
Extended Data Fig. 5
Extended Data Fig. 5. Glutarate reduces tumor growth and increases T cell numbers and tumor infiltration.
a, Cell count of human CAR-T cells treated +/- 500 µM for 7 days. Two-tailed paired t-test; n = 6. b, Cell count of murine OT1 CD8+ T cells treated +/- 500 µM for 7 days. Two-tailed paired t-test; n = 6. c, In vitro B16F10-OVA cell growth +/- DEG 500 µM as determined by cell counting and represented as log2 FC. One way ANOVA; n = 3. d, Cell count of different cancer cell lines treated with increasing concentrations of DEG for 72 h. Cell count relative to appropriate untreated control. One way ANOVA; n = 3. e, Cell count of human HER2-CAR-T_shRNA cell numbers 7 days post transduction. Two-tailed paired t-test; n = 4. f, Gating strategy used for analysis of Fig. 5-m and Extended Data Fig. 5g. g, Frequency of immune cell types in peripheral blood, tumor, spleen, and tumor draining lymph nodes, 14 days post tumor inoculation, represented as log2 FC relative to CD45+ count. Two-tailed unpaired t-test; Tumor CT n = 10; Tumor DEG n = 8; Peripheral Blood CT + DEG n = 15; Spleen CT + DEG n = 15; Tumor Draining Lymph Nodes CT n = 15; Tumor Draining Lymph Nodes DEG n = 15. h, Percentage of CD8+/CD4+ T cells expressing CD44/CD62L in tumors 14 days post tumor inoculation. Two-tailed unpaired t-test; Ct n = 20; DEG n = 18. i, MFI of TIM3, PD1, LAG3 and TOX on CD8+/CD4+ T cells in tumor s, 14 days post tumor inoculation. Two-tailed unpaired t-test; n = 10. Graph shows median + 95% CI where each dot represents one murine or human donor as indicated. *p < 0.05, **p < 0.01.

References

    1. Kaech SM, Cui W. Transcriptional control of effector and memory CD8+ T cell differentiation. Nat. Rev. Immunol. 2012;12:749–761. doi: 10.1038/nri3307. - DOI - PMC - PubMed
    1. Sallusto F, Lanzavecchia A, Araki K, Ahmed R. From vaccines to memory and back. Immunity. 2010;33:451–463. doi: 10.1016/j.immuni.2010.10.008. - DOI - PMC - PubMed
    1. Crompton JG, et al. Lineage relationship of CD8+ T cell subsets is revealed by progressive changes in the epigenetic landscape. Cell Mol. Immunol. 2016;13:502–513. doi: 10.1038/cmi.2015.32. - DOI - PMC - PubMed
    1. Harland KL, et al. Epigenetic plasticity of Cd8a locus during CD8+ T-cell development and effector differentiation and reprogramming. Nat. Commun. 2014;5:3547. doi: 10.1038/ncomms4547. - DOI - PMC - PubMed
    1. Russ BE, et al. Distinct epigenetic signatures delineate transcriptional programs during virus-specific CD8+ T Cell differentiation. Immunity. 2014;41:853–865. doi: 10.1016/j.immuni.2014.11.001. - DOI - PMC - PubMed

Publication types

MeSH terms

LinkOut - more resources