. 2023 Sep;29(9):2347-2357.
doi: 10.1038/s41591-023-02521-2. Epub 2023 Aug 21.

Postacute sequelae of COVID-19 at 2 years

Affiliations

Postacute sequelae of COVID-19 at 2 years

Benjamin Bowe et al. Nat Med. 2023 Sep.

Abstract

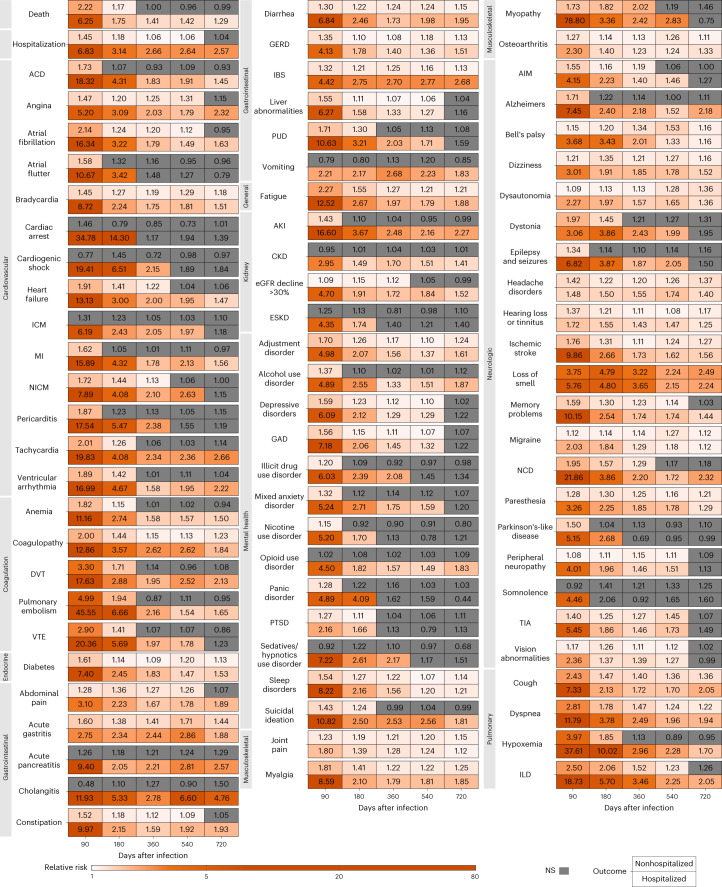
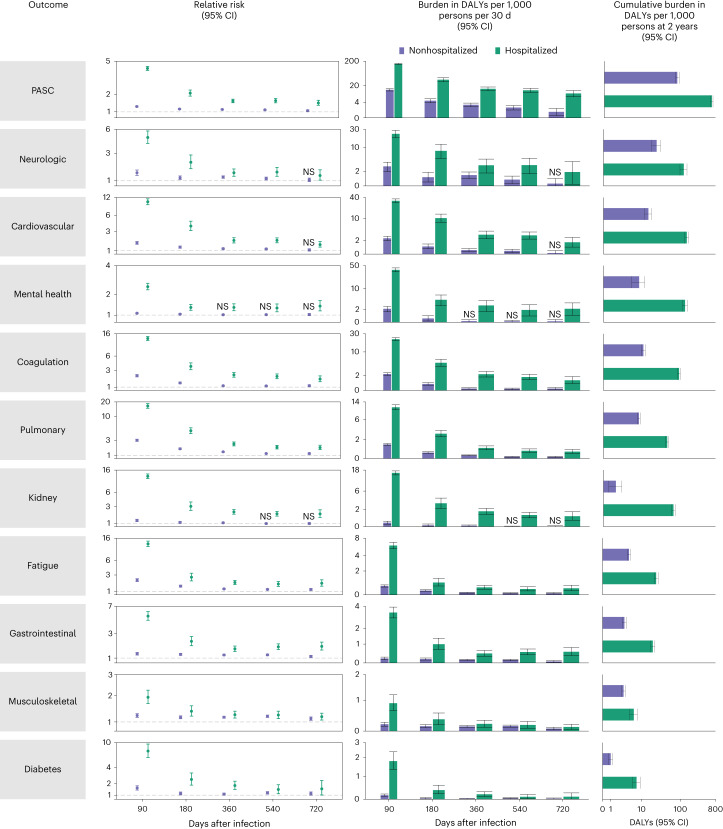
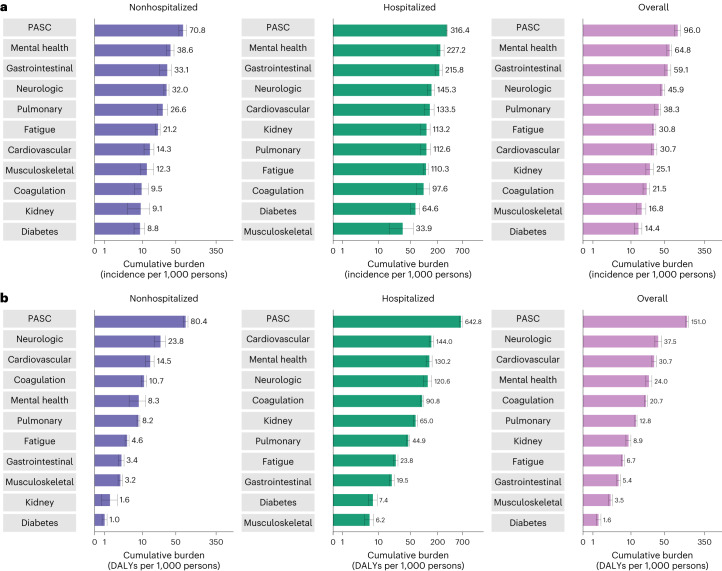
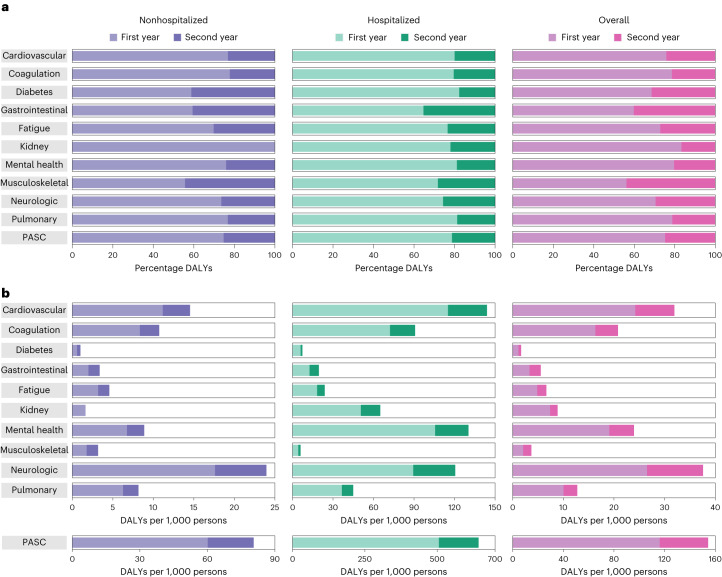
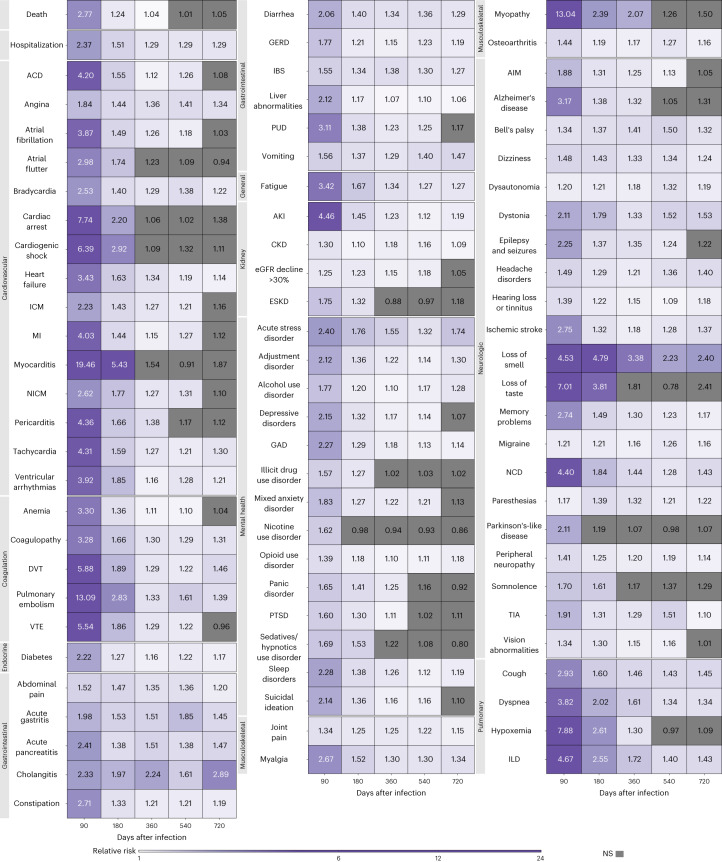
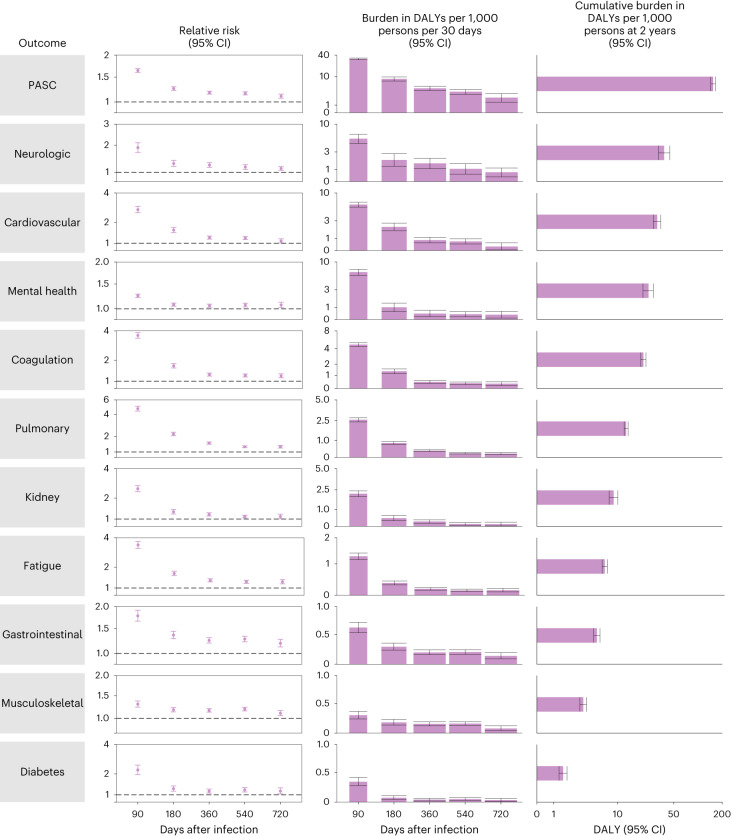
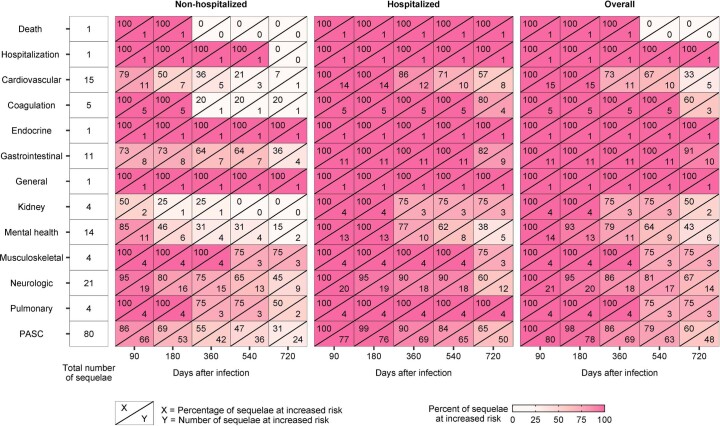
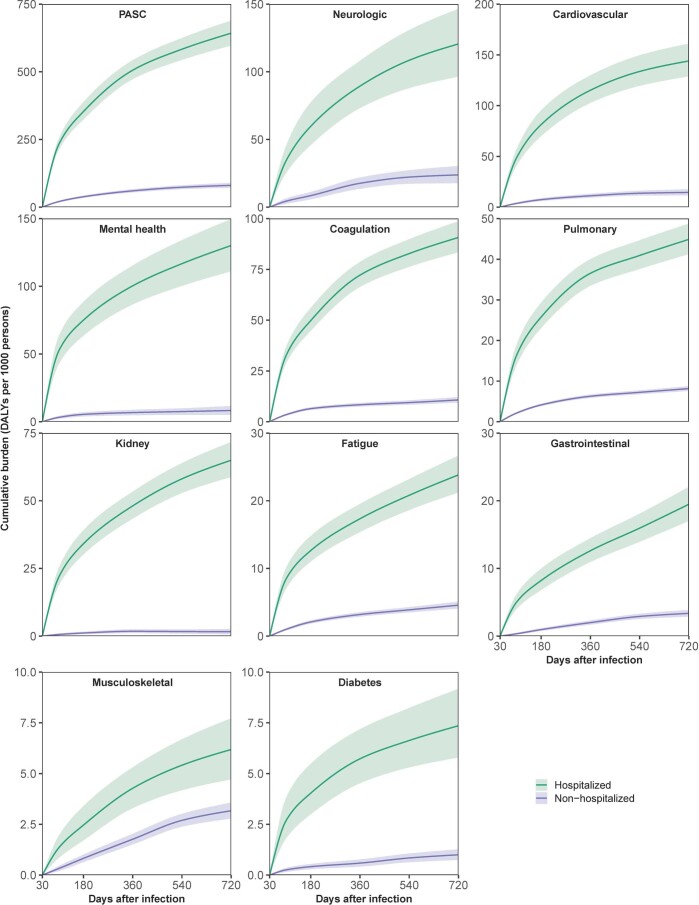
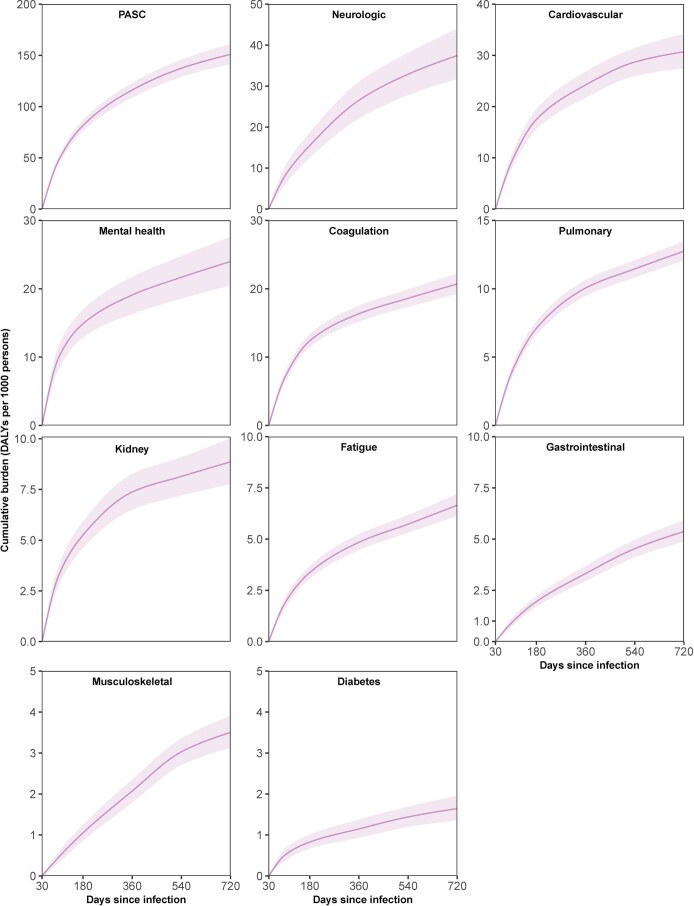
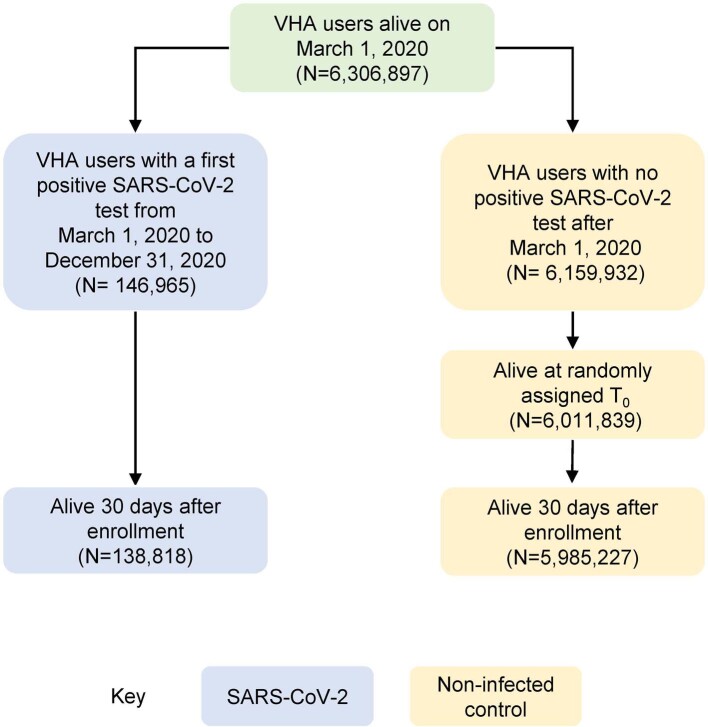
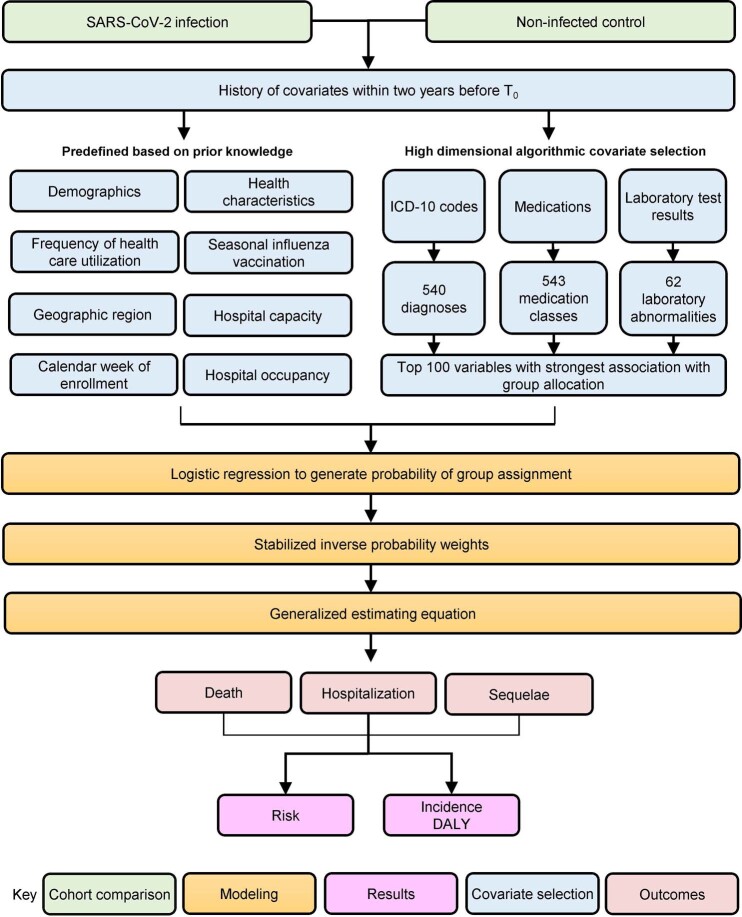
Severe acute respiratory syndrome coronavirus 2 (SARS-CoV-2) infection can lead to postacute sequelae in multiple organ systems, but evidence is mostly limited to the first year postinfection. We built a cohort of 138,818 individuals with SARS-CoV-2 infection and 5,985,227 noninfected control group from the US Department of Veterans Affairs and followed them for 2 years to estimate the risks of death and 80 prespecified postacute sequelae of COVID-19 (PASC) according to care setting during the acute phase of infection. The increased risk of death was not significant beyond 6 months after infection among nonhospitalized but remained significantly elevated through the 2 years in hospitalized individuals. Within the 80 prespecified sequelae, 69% and 35% of them became not significant at 2 years after infection among nonhospitalized and hospitalized individuals, respectively. Cumulatively at 2 years, PASC contributed 80.4 (95% confidence interval (CI): 71.6-89.6) and 642.8 (95% CI: 596.9-689.3) disability-adjusted life years (DALYs) per 1,000 persons among nonhospitalized and hospitalized individuals; 25.3% (18.9-31.0%) and 21.3% (18.2-24.5%) of the cumulative 2-year DALYs in nonhospitalized and hospitalized were from the second year. In sum, while risks of many sequelae declined 2 years after infection, the substantial cumulative burden of health loss due to PASC calls for attention to the care needs of people with long-term health effects due to SARS-CoV-2 infection.


Conflict of interest statement

B.B. reports receiving consultation fees from AstraZeneca. Z.A.A. reports receiving consultation fees from Gilead Sciences and funding (unrelated to this work) from Tonix Pharmaceuticals. Z.A.A. and Y.X. report consulting (uncompensated) for Pfizer.

Figures

Fig. 1
Fig. 1. Risk of postacute sequelae of COVID-19 up to 2 years after infection by care setting of the acute phase of the disease.
Relative risks by days after infection plotted for time periods of 30–90, 91–180, 181–360, 361–540 and 541–720 days after infection, labeled by the last day of the corresponding time period. Heatmaps include (top row) nonhospitalized for COVID-19 during the acute phase of the disease (n = 118,238) corresponding to each sequela and (bottom row) COVID-19 hospitalization during the acute phase of the disease (n = 20,580). Relative risks were estimated in comparison to a noninfected control (n = 5,985,227). Sequelae are grouped by organ system. ACD, acute coronary disease; AIM, abnormal involuntary movements; AKI, acute kidney injury; CKD, chronic kidney disease; DVT, deep vein thrombosis; ESKD, end-stage kidney disease; GAD, general anxiety disorder; GERD, gastroesophageal reflux disease; IBS, irritable bowel syndrome; ICM, ischemic cardiomyopathy; ILD, interstitial lung disease; MI, myocardial infarction; NCD, neurocognitive decline; NICM, nonischemic cardiomyopathy; PTSD, post-traumatic stress disorder; PUD, peptic ulcer disease; TIA, transient ischemic attack; VTE, venous thromboembolism. NS, non-significant.
Fig. 2
Fig. 2. Risks and DALYs of postacute sequelae overall and by organ system by care setting of the acute phase of the disease.
The first column includes risk due to COVID-19 of the outcome by time periods of 30–90, 91–180, 181–360, 361–540 and 541–720 days after infection The dot represents the relative risk, while the error bars correspond to the 95% confidence intervals. The second column includes the DALYs rate per 1,000 persons per 30 days by time period. The center of the vertical bar represents the DALYs rate, while the error bars correspond to the 95% confidence intervals. Bar widths differ by the duration of the time period. No adjustment for multiple comparisons was made for the prespecified analyses. Risks and DALYs not significantly different from the control are marked by NS. The third column presents cumulative DALYs per 1,000 persons at 2 years after infection. The center of the horizontal bar represents the cumulative DALYs rate, while the error bars correspond to 95% confidence intervals. Nonhospitalized for COVID-19 (n = 118,238), COVID-19 hospitalization (n = 20,580) and control group (n = 5,985,227). Outcomes are ordered from top to bottom by largest cumulative DALYs at 2 years after infection in the overall COVID-19 cohort. NS, non-significant.
Fig. 3
Fig. 3. Cumulative incidence and DALYs of postacute sequelae overall and by organ system at 2 years after infection.
a, Cumulative incidence defined as at least one sequela within that organ system; b, cumulative DALYs from sequelae in an organ system. Presented for COVID-19 overall (n = 138,818) and by care setting of the acute phase of the disease (nonhospitalized (n = 118,238) and hospitalized (n = 20,580)) at 2 years after infection. The center of the horizontal bars represents the magnitude of incidence or DALY per 1,000 persons at 2 years after infection and is numerically labeled. Each plot is ordered in a descending fashion. Error bars represent 95% confidence intervals.
Fig. 4
Fig. 4. Cumulative DALYs of postacute sequelae overall and by organ system within the first and second years after infection.
a, Percentage of cumulative DALYs at 2 years contributed from first and second year after infection; b, cumulative DALYs per 1,000 persons in the first and second year after infection. Plots presented for nonhospitalized COVID-19 (n = 118,238), hospitalized COVID-19 (n = 20,580) and overall COVID-19 (n = 138,818) compared to control group (n = 5,985,227).
Fig. 5
Fig. 5. Risk of postacute sequelae of COVID-19 overall up to 2 years after infection.
Relative risks by days after infection are plotted for time periods of 30–90, 91–180, 181–360, 361–540 and 541–720 days after infection, labeled by the last day during the corresponding time period. The relative risk is included in the text for each time period and outcome. Relative risks were estimated for overall COVID-19 (n = 138,818) in comparison to a noninfected control (n = 5,985,227). Sequelae are grouped by organ system. CICM, ischemic cardiomyopathy; KD, chronic kidney disease. NS, non-significant.
Fig. 6
Fig. 6. Risk and DALYs of postacute sequelae overall and by organ system in COVID-19 overall.
The first column includes risk of the outcome due to COVID-19 by time periods of 30–90, 91–180, 181–360, 361–540 and 541–720 days after infection. The dot represents the relative risk, while the error bars correspond to the 95% confidence intervals. The second column includes the DALYs rate per 1,000 persons per 30 days by time period. The center of the vertical bar represents the DALYs rate, while the error bars correspond to the 95% confidence intervals. Bar widths differ by the duration of the time period. The third column presents the cumulative DALYs per 1,000 persons during the postacute phase at 2 years after infection. The center of the horizontal bar represents the cumulative DALYs rate, while the error bars correspond to 95% confidence intervals. No adjustment for multiple comparisons was made for the prespecified analyses. Outcomes are ordered from top to bottom by the largest cumulative DALYs at 2 years after infection. The horizontal bar represents the cumulative DALYs rate, while the error bars correspond to the 95% confidence intervals. Overall COVID-19 (n = 138,818) and control group (n = 5,985,227).
Extended Data Fig. 1
Extended Data Fig. 1. Standardized mean differences between COVID-19 non-hospitalized, hospitalized, and the control before and after weighting in analyses of death, hospitalization, and sequelae.
Plots standardized mean differences before weighting (left) and after weighting (right). Each row represents a sub-cohort used in analysis of the risks of death, hospitalization, and sequelae that was free of history of the respective outcome at baseline. Rows are ordered, from top to bottom, on the basis of the lowest to highest percent of SMD that were unbalanced (SMD > 0.1) among unweighted sub-cohorts. Each row consists of the distribution of SMD within the sub cohort. Each cell represents a percentile (from 0th to 100th) of the distribution of the SMD within the respective sub-cohort (x-axis). Includes SMD for non-hospitalized COVID-19 compared to the control, hospitalized COVID-19 compared to the control, and non-hospitalized compared to hospitalized COVID-19. SMD was estimated for differences in participant characteristics including pre-defined covariates, algorithmically selected high dimensional covariates, and non-selected high dimensional covariates. After weighting, no covariates had an SMD greater than 0.1 in any sub-cohorts.
Extended Data Fig. 2
Extended Data Fig. 2. Standardized mean differences between COVID-19 non-hospitalized, hospitalized, and control before and after weighting in analyses of post-acute sequelae (PASC) and sequelae by organ system.
Plots includes the standardized mean difference (SMD) (x-axis) and the percent distribution (y-axis), for analyses of post-acute sequelae and sequelae by organ system. Includes differences for non-hospitalized compared to the control, hospitalized compared to the control, and non-hospitalized compared to hospitalized. Covariates examined included pre-defined covariates, algorithmically selected high dimensional covariates, and non-selected high dimensional covariates. An SMD > 0.1 (dotted red line) was taken as evidence of imbalance. After weighting, no SMD were > 0.1.
Extended Data Fig. 3
Extended Data Fig. 3. Summary of risk of sequelae by time period of follow-up.
Plots present, by time period of analyses, risk summaries of death, hospitalization, sequelae by organ system, and sequelae overall for non-hospitalized COVID-19, hospitalized COVID-19, and overall COVID-19. The column on the left denotes the total number of sequelae examined in the organ system. Within each cell, the top number represent the number of sequelae at increased risk in those with COVID-19 compared to the control, while the bottom number is the percentage at risk among the number of sequelae examined in the organ system.). In analyses by care setting the total number of sequelae examined was 14 cardiovascular sequelae, 13 mental health sequelae, and 20 neurologic sequelae, leading to a total of 77 sequelae examined as part of PASC. PASC, post-acute sequelae of COVID-19.
Extended Data Fig. 4
Extended Data Fig. 4. Cumulative disability-adjusted life years (DALYs) of post-acute sequelae and sequelae by organ system in those non-hospitalized and hospitalized with COVID-19.
Lines present the cumulative disability adjusted life years (DALYs) due to COVID-19 per 1000 persons (y-axis) by days after infection (x-axis). Bands represent the 95% confidence intervals. Plots are ordered, from left to right and up to down, by cumulative burden at two years after infection. PASC, post-acute sequelae of COVID-19.
Extended Data Fig. 5
Extended Data Fig. 5. Standardized mean differences between COVID-19 overall and control before and after weighting in analyses of death, hospitalization, and sequelae.
Plots standardized mean differences before weighting (left) and after weighting (right). Each row represents a sub-cohort used in analysis of the risks of death, hospitalization, and sequelae that was free of history of the respective outcome at baseline. Rows are ordered, from top to bottom, on the basis of the lowest to highest percent of SMD that were unbalanced (>0.1) among unweighted sub-cohorts. Each row consists of the distribution of SMD within the sub cohort. Each cell represents a percentile (from 0th to 100th) of the distribution of the SMD within the respective sub-cohort (x-axis). Includes SMD for COVID-19 compared to the control. SMD was estimated for differences in participant characteristics including pre-defined covariates, algorithmically selected high dimensional covariates, and non-selected high dimensional covariates. After weighting, no covariates had an SMD greater than 0.1 in any sub-cohorts.
Extended Data Fig. 6
Extended Data Fig. 6. Standardized mean differences between COVID-19 overall and control before and after weighting in analyses of post-acute sequelae (PASC) and sequelae by organ system.
Plots includes the standardized mean difference (x-axis) and the percent distribution (y-axis), for analyses of post-acute sequelae and sequelae by organ system. Covariates examined included pre-defined covariates, algorithmically selected high dimensional covariates, and non-selected high dimensional covariates. An SMD > 0.1 (dotted red line) was taken as evidence of imbalance. After weighting, no SMD were > 0.1.
Extended Data Fig. 7
Extended Data Fig. 7. Cumulative disability-adjusted life years (DALYs) of post-acute sequelae and sequelae by organ system in COVID-19 overall.
Lines present the cumulative disability adjusted life years (DALYs) due to COVID-19 per 1000 persons (y-axis) by days after infection (x-axis). Bands represent the 95% confidence intervals. Plots are ordered, from left to right and up to down, by cumulative burden at two years after infection. PASC, post-acute sequelae of COVID-19.
Extended Data Fig. 8
Extended Data Fig. 8. Cohort flowchart.
Cohort flowchart of the study.
Extended Data Fig. 9
Extended Data Fig. 9. Analytic flowchart.
Analytic flowchart of the study.

Similar articles

Cited by

References

    1. Davis HE, McCorkell L, Vogel JM, Topol EJ. Long COVID: major findings, mechanisms and recommendations. Nat. Rev. Microbiol. 2023;21:408. doi: 10.1038/s41579-023-00896-0. - DOI - PMC - PubMed
    1. Al-Aly Z, Xie Y, Bowe B. High-dimensional characterization of post-acute sequelae of COVID-19. Nature. 2021;594:259–264. doi: 10.1038/s41586-021-03553-9. - DOI - PubMed
    1. Xie Y, Xu E, Bowe B, Al-Aly Z. Long-term cardiovascular outcomes of COVID-19. Nat. Med. 2022;28:583–590. doi: 10.1038/s41591-022-01689-3. - DOI - PMC - PubMed
    1. Xie Y, Xu E, Al-Aly Z. Risks of mental health outcomes in people with COVID-19. BMJ. 2022;376:e068993. doi: 10.1136/bmj-2021-068993. - DOI - PMC - PubMed
    1. Xie Y, Al-Aly Z. Risks and burdens of incident diabetes in long COVID: a cohort study. Lancet Diabetes Endocrinol. 2022;10:311–321. doi: 10.1016/S2213-8587(22)00044-4. - DOI - PMC - PubMed

Publication types

Substances