. 2023 Aug 21;30(1):70.
doi: 10.1186/s12929-023-00966-8.

Mitochondrial impairment and synaptic dysfunction are associated with neurological defects in iPSCs-derived cortical neurons of MERRF patients

Affiliations

Mitochondrial impairment and synaptic dysfunction are associated with neurological defects in iPSCs-derived cortical neurons of MERRF patients

Yu-Ting Wu et al. J Biomed Sci. .

Abstract

Background: Myoclonic epilepsy with ragged-red fibers (MERRF) syndrome is a rare inherited mitochondrial disease mainly caused by the m.8344A > G mutation in mitochondrial tRNALys gene, and usually manifested as complex neurological disorders and muscle weakness. Currently, the pathogenic mechanism of this disease has not yet been resolved, and there is no effective therapy for MERRF syndrome. In this study, MERRF patients-derived iPSCs were used to model patient-specific neurons for investigation of the pathogenic mechanism of neurological disorders in mitochondrial disease.

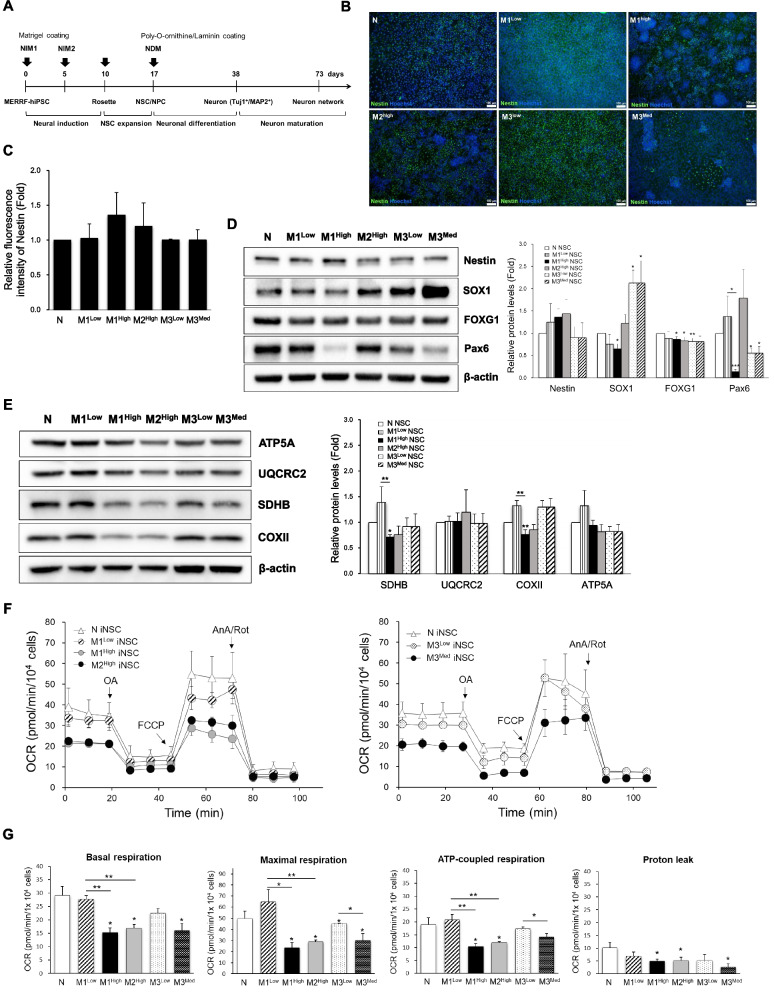
Methods: MERRF patient-derived iPSCs were differentiated into excitatory glutamatergic neurons to unravel the effects of the m.8344A > G mutation on mitochondrial bioenergetic function, neural-lineage differentiation and neuronal function. By the well-established differentiation protocol and electrophysiological activity assay platform, we examined the pathophysiological behaviors in cortical neurons of MERRF patients.

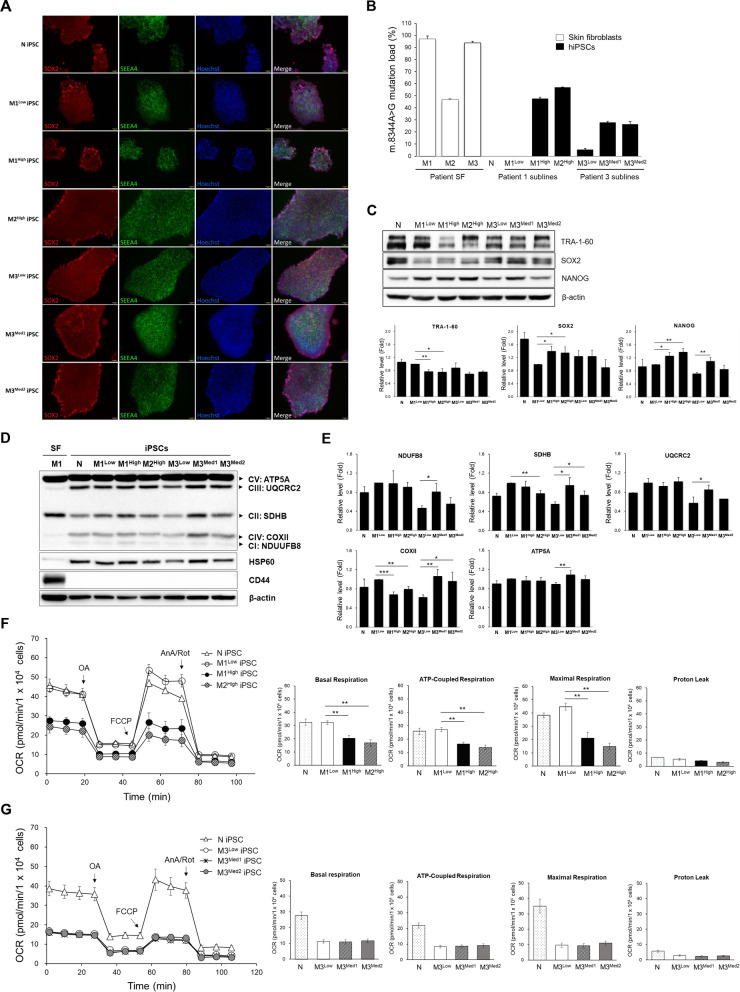
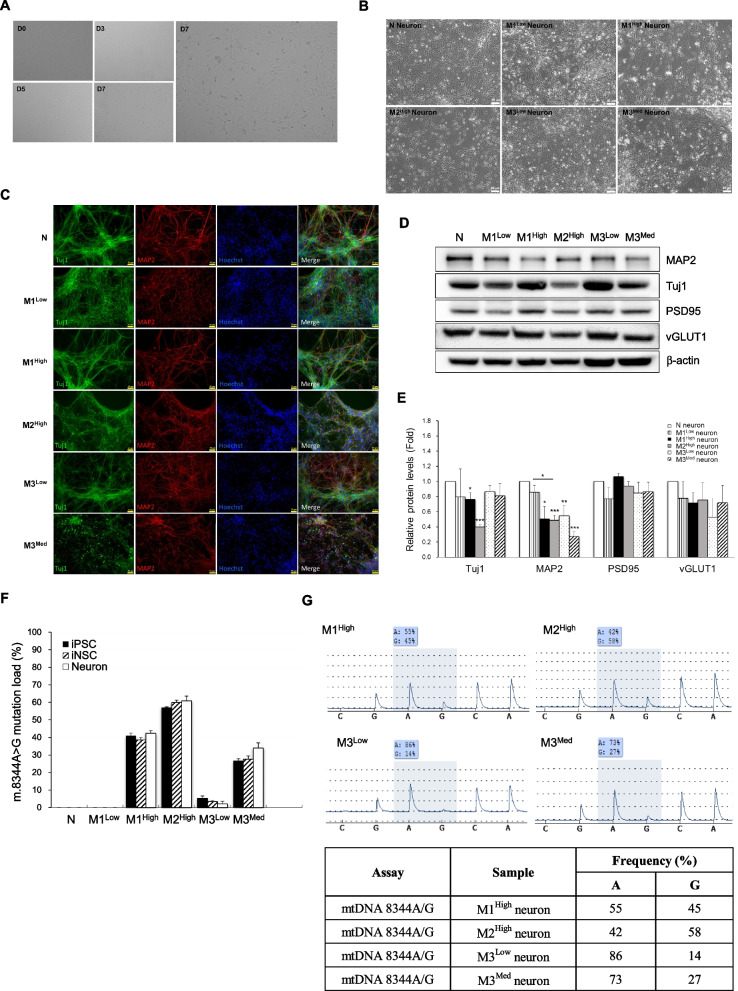
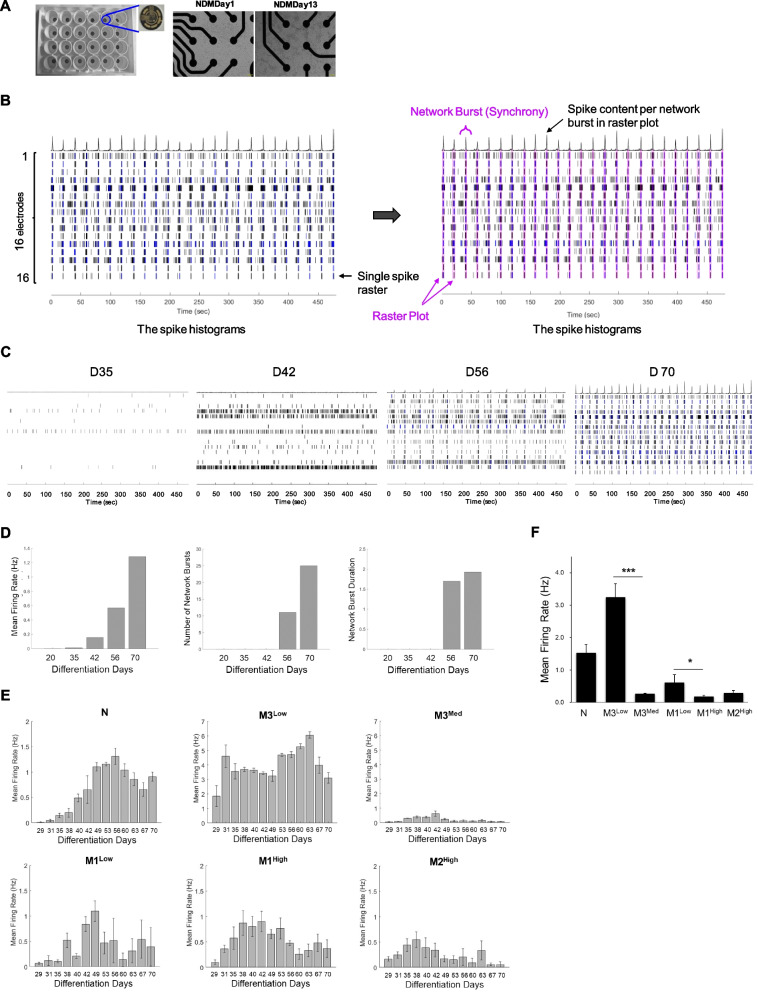
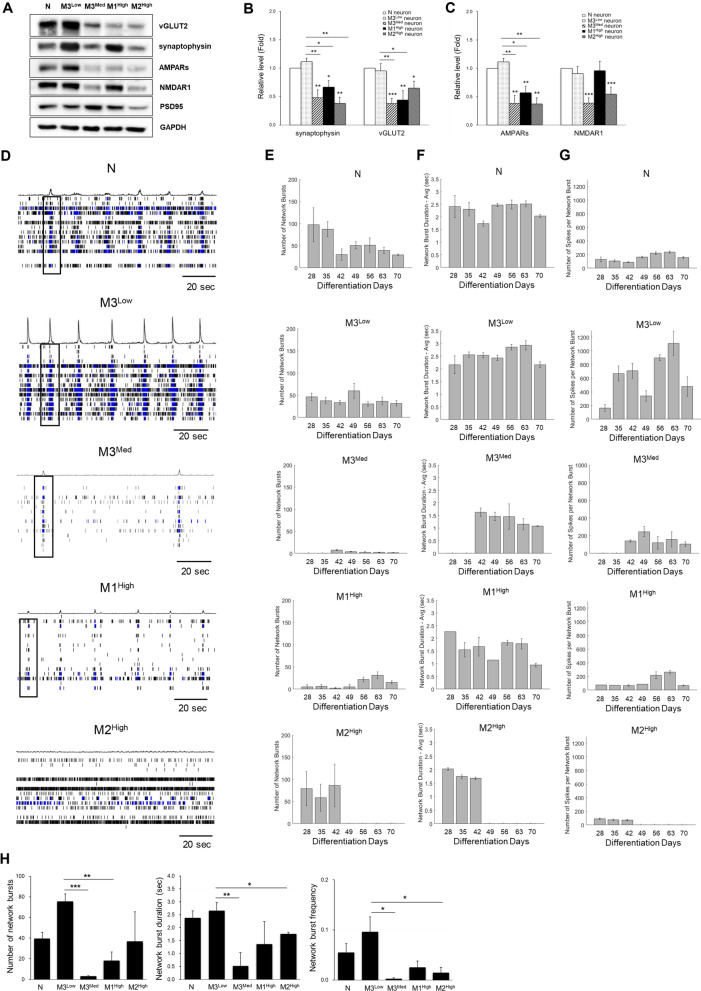
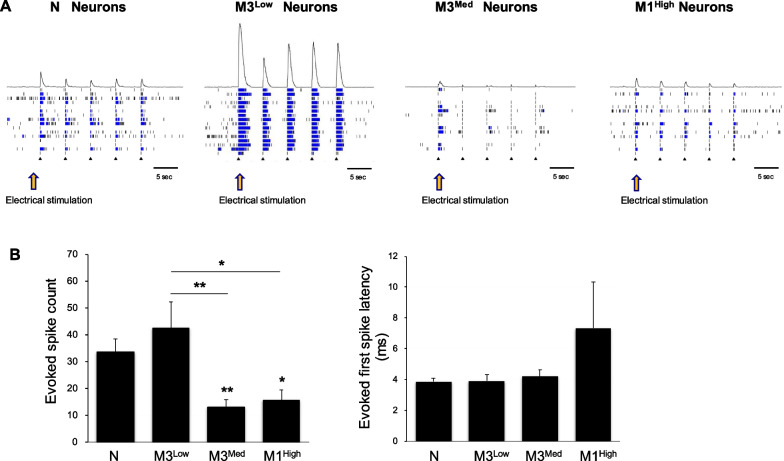
Results: We have successfully established the iPSCs-derived neural progenitor cells and cortical-like neurons of patients with MERRF syndrome that retained the heteroplasmy of the m.8344A > G mutation from the patients' skin fibroblasts and exhibited the phenotype of the mitochondrial disease. MERRF neural cells harboring the m.8344A > G mutation exhibited impaired mitochondrial bioenergetic function, elevated ROS levels and imbalanced expression of antioxidant enzymes. Our findings indicate that neural immaturity and synaptic protein loss led to the impairment of neuronal activity and plasticity in MERRF neurons harboring the m.8344A > G mutation. By electrophysiological recordings, we monitored the in vivo neuronal behaviors of MERRF neurons and found that neurons harboring a high level of the m.8344A > G mutation exhibited impairment of the spontaneous and evoked potential-stimulated neuronal activities.

Conclusions: We demonstrated for the first time the link of mitochondrial impairment and synaptic dysfunction to neurological defects through impeding synaptic plasticity in excitatory neurons derived from iPSCs of MERRF patients harboring the m.8344A > G mutation. This study has provided new insight into the pathogenic mechanism of the tRNALys gene mutation of mtDNA, which is useful for the development of a patient-specific iPSCs platform for disease modeling and screening of new drugs to treat patients with MERRF syndrome.

Keywords: AMPARs; Disease modeling; Electrophysiological activity; Excitatory neurons; MERRF syndrome; Neurological defect; Synaptic plasticity; Synaptophysin; iPSCs; mtDNA mutation.


Conflict of interest statement

The authors declare no competing interests.

Figures

Fig. 1
Fig. 1
Effect of the m.8344A > G mutation on mitochondrial bioenergetic function of MERRF-iPSCs. A Characterization of all MERRF-iPSCs lines by the immunofluorescence staining with pluripotency markers, SOX2 (red), SEEA4 (green) and Hoechst 33342 (blue). Scale bars, 100 μm. B Preservation of the heteroplasmy levels of the m.8344A > G mutation in MERRF-iPSCs. The proportion of mtDNA with the m.8344A > G mutation was quantified by PCR–RFLP in the skin fibroblasts from patients with MERRF syndrome, normal (N) and MERRF-iPSCs sublines. C The protein expression patterns and quantification of stemness genes in normal and MERRF-iPSCs lines analyzed by Western blots. β-actin was used as the internal control. D The protein levels of some subunits of respiratory enzyme complexes in MERRF-iPSCs were analyzed by Western blot. E Comparison of the OXHPOS protein expression levels in different MERRF-iPSCs. Quantification of the proteins in Western blots was normalized with β-actin. All the data are expressed as the fold change of that of control (M1Low iPSCs). F The representative data showing the oxygen consumption rate (OCR) in normal (N), M1Low, M1High and M2High iPSCs lines. OCR was analyzed by a Seahorse XFe24 extracellular flux analyzer after sequential injection of 1 μM oligomycin A (OA), 0.5 μM FCCP, and 2.5 μM antimycin A plus 2 μM rotenone (AA/Rot), respectively. Quantitative data of the bioenergetic parameters including the basal respiration rate, maximal, and ATP-coupled mitochondrial respiration rates of MERRF-iPSCs. G OCR and quantitative data in M3 iPSCs sublines (M3Low, M3Med) as compared with those of N iPSCs. Data are presented as mean ± SEM, n = 3. *p < 0.05; **p < 0.01; ***p < 0.001
Fig. 2
Fig. 2
Impairment of mitochondrial respiratory function in iNSCs derived from mutant MERRF-iPSCs. A A schematic diagram to depict the stages for cortical neuronal differentiation of MERRF-iPSCs. B Characterization of neural stem cells (NSCs) derived from MERRF-iPSCs after going through the neural-lineage differentiation by the immunofluorescence staining of neural stem cell marker, Nestin (Green). Nuclei were counterstained with Hoechst 33342 (blue). Scale bars, 100 μm. C Quantification of the Nestin fluorescent intensity in immunofluorescence image was normalized with nuclei counts. All the data are presented as a fold change of normal iNSCs (N iNSCs). D The protein expression patterns of NSCs marker genes in normal and MERRF-iNSCs lines. Quantification of the proteins in Western blots was normalized with β-actin. All data displayed as a fold of N iNSCs. E The protein expression levels of some subunits of respiratory enzyme complexes in normal and MERRF-iNSCs. Quantification of the proteins in Western blots was normalized with β-actin. All the data displayed as a fold change of N iNSCs. F Mitochondrial respiration rates of normal and MERRF-iNSCs were analyzed by a Seahorse XFe24 extracellular flux analyzer. G Quantitative data of the basal respiration rate, maximal, and ATP-coupled mitochondrial respiration rates of MERRF-iNSCs (M1Low, M1High, M2High, M3Low, and M3Med) as compared with those of N iNSCs. Data are presented as mean ± SEM, n = 3. *p < 0.05; **p < 0.01
Fig. 3
Fig. 3
Imbalanced expression of antioxidant enzymes and accumulation of intracellular H2O2 in MERRF-iNSCs harboring the m.8344A > G mutation. A The protein expression levels of antioxidant enzymes in normal and MERRF-iPSCs. B Quantification of the proteins in Western blots was normalized with β-actin. All the data displayed as a fold of M1Low iPSCs. C The protein expression levels of antioxidant enzymes in normal and MERRF-iNSCs. D Quantification of the antioxidant enzyme proteins in iNSCs was normalized with β-actin. All the data are expressed as the fold change of those of N iNSCs. E Intracellular levels of H2O2 in MERRF-iPSCs and MERRF-iNSCs were analyzed by staining cells with DCFH-dA and were quantified in comparison with those of the control (M1Low iPSCs and M1Low iNSCs), respectively. The fluorescence intensity is expressed as the percentage change of M1Low. Data are presented as mean ± SEM, n = 3. *p < 0.05; **p < 0.01; ***p < 0.001
Fig. 4
Fig. 4
Generation and characterization of cortical-like neurons derived from MERRF-iPSCs undergoing neural-lineage differentiation. A Morphological change in the normal iNSCs at early stage of neuronal differentiation was observed at the indicated time points. B Morphological characterization of the iNSCs-derived neurons at day 14 of neuronal differentiation. Scale bars, 50 μm. C Phenotypic characterization of MERRF iNSCs-derived cortical-like neurons after 3 weeks of differentiation by the immunofluorescence staining with pan neuron markers, MAP2 (red), Tuj1 (green), and Hoechst 33342 (blue). Scale bars, 50 μm. D The protein expression levels of neuron-specific markers in normal and MERRF neurons after 3 weeks of differentiation. E Quantification of the proteins in Western blots was normalized with β-actin. All the data displayed as a fold change of normal neurons (N neurons). F Preservation of the heteroplasmy levels of the m.8344A > G mutation in MERRF neurons and the parental MERRF-iNSCs and MERRF-iPSCs. The proportion of mtDNA with the m.8344A > G mutation was quantified by PCR–RFLP. G The mutation level of m.8344A > G in MERRF neurons was confirmed by pyrosequencing. Data are presented as mean ± SEM, n = 3. *p < 0.05; **p < 0.01; ***p < 0.001
Fig. 5
Fig. 5
Electrophysiological assessment of spontaneous activity in iPSCs-derived cortical-like neurons. A The image of a 24-well Axion microelectrode array (MEA) containing 16 electrodes and used for measuring the electrophysiological activity of neurons. iNSCs were cultured on MEA, and spontaneous excitatory activity was recorded during neuronal differentiation. B A representative raster trace of M3Low neurons in a well measured from an 8-min recording at day 70 of differentiation. Each horizontal row represents an electrode in the well. The spike histogram shows a synchronous network burst recording plotted over all electrodes (purple bar). C The alteration of spontaneous neuron activity in M3Low neurons at indicated time of differentiation (day 35, day 42, day 56, and day 70). D A plot represents mean firing rate (MFR), network burst numbers, and burst duration measured by the MEA. E Normal and MERRF-iNSCs were replaced in the MEA and allowed to undergo neuronal differentiation for 10 weeks, the spontaneous electrical activity of neurons was recorded over a period of 8 min. The plot represents the mean firing rate in neurons measured from day 29 to day 70 after neuron differentiation. Data were calculated as the average of 3 to 4 replicate wells of each neuron group in the experiment. F Mean firing rate in N and MERRF neurons at 7-week maturation. Data are presented as mean ± SEM, n = 3. *p < 0.05; **p < 0.01; ***p < 0.001
Fig. 6
Fig. 6
Synaptic defects in MERRF neurons harboring the m.8344A > G mutation. A The protein expression levels of presynaptic vesicular proteins and excitatory glutamate receptors in normal and MERRF neurons. B Quantitative data of the synaptic vesicular proteins, synaptophysin and vGLUT2. C Quantitative data of the excitatory receptors, AMPARs and NMDARA. Quantification of the proteins in Western blot was normalized with β-actin. All data are presented as the fold change of that in N neurons. D Representative image of spike histograms showing the spontaneous network bursting in N neurons and MERRF neurons from 2-min recording plotted over all electrodes. Temporal changes in E the number of network bursts, F network burst duration, and G the number of spikes per network burst during 10 weeks of differentiation. Data are presented as the average of 3–4 replicate wells of each neuron group in the experiment. H Quantitative parameters in N neurons and MERRF neurons at 7 weeks of maturation. Data are presented as mean ± SEM, n = 3. *p < 0.05; **p < 0.01; ***p < 0.001
Fig. 7
Fig. 7
Attenuation of evoked potential-stimulated excitability in MERRF neurons harboring the m.8344A > G mutation. A The spike histograms shows the evoked electrical activity of neurons during 5 times of continuous current stimulation in neurons after 10 weeks of differentiation. B A plot represents the number of evoked potential-stimulated spike and evoked first spike latency in MERRF neurons compared to those of N and M3Low neurons. Data are presented as mean ± SEM, n = 3. *p < 0.05; **p < 0.01

Similar articles

Cited by

References

    1. Park SY, Kim SH, Lee YM. Molecular diagnosis of myoclonus epilepsy associated with ragged-red fibers syndrome in the absence of ragged red fibers. Front Neurol. 2017;8:520. - PMC - PubMed
    1. Russell OM, Gorman GS, Lightowlers RN, Turnbull DM. Mitochondrial diseases: hope for the future. Cell. 2020;181:168–188. - PubMed
    1. Mavraki E, Labrum R, Sergeant K, Alston CL, Woodward C, Smith C, et al. Genetic testing for mitochondrial disease: the United Kingdom best practice guidelines. Eur J Hum Genet. 2023;31:148–163. - PMC - PubMed
    1. Lorenzoni PJ, Scola RH, Kay CS, Arndt RC, Silvado CE, Werneck LC. MERRF: clinical features, muscle biopsy and molecular genetics in Brazilian patients. Mitochondrion. 2011;11:528–532. - PubMed
    1. Son G, Han J. Roles of mitochondria in neuronal development. BMB Rep. 2018;51:549–556. - PMC - PubMed

Substances