. 2023 Dec;94(6):1048-1066.
doi: 10.1002/ana.26770. Epub 2023 Sep 14.

Ferroptosis of Microglia in Aging Human White Matter Injury

Affiliations

Ferroptosis of Microglia in Aging Human White Matter Injury

Philip A Adeniyi et al. Ann Neurol. 2023 Dec.

Abstract

Objective: Because the role of white matter (WM) degenerating microglia (DM) in remyelination failure is unclear, we sought to define the core features of this novel population of aging human microglia.

Methods: We analyzed postmortem human brain tissue to define a population of DM in aging WM lesions. We used immunofluorescence staining and gene expression analysis to investigate molecular mechanisms related to the degeneration of DM.

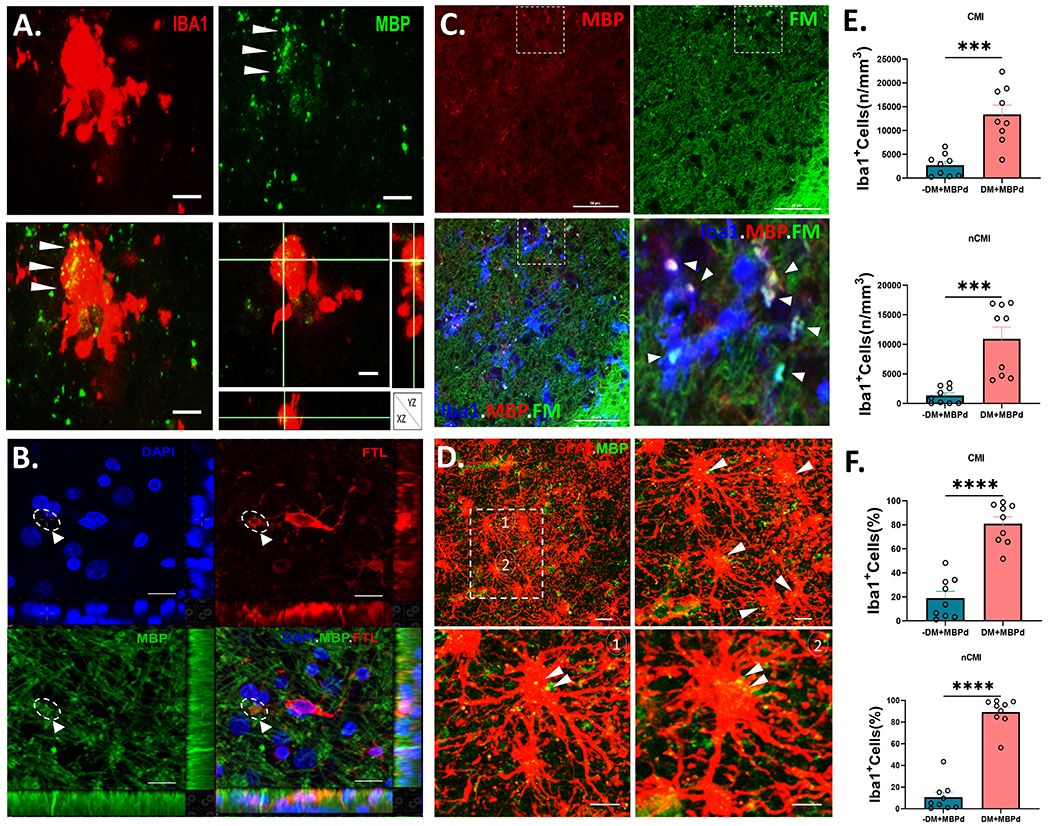
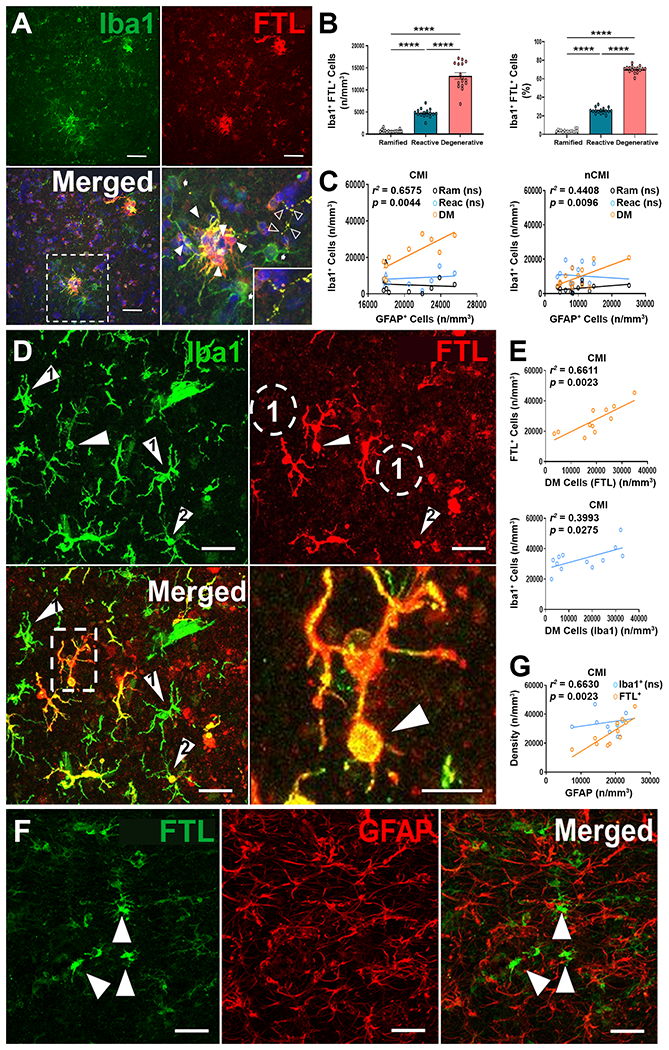
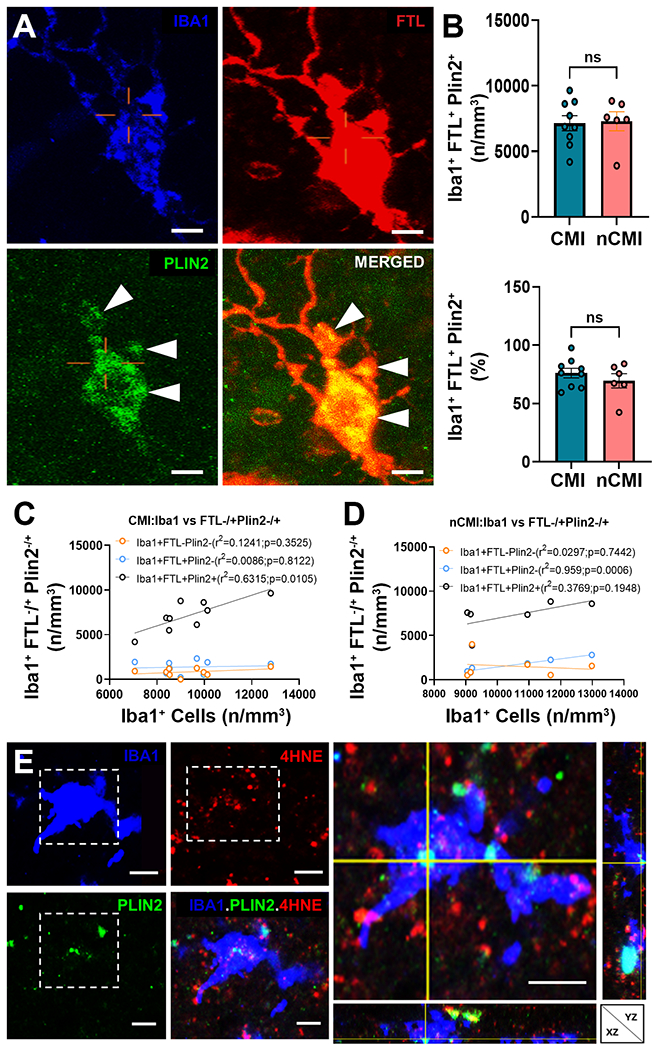
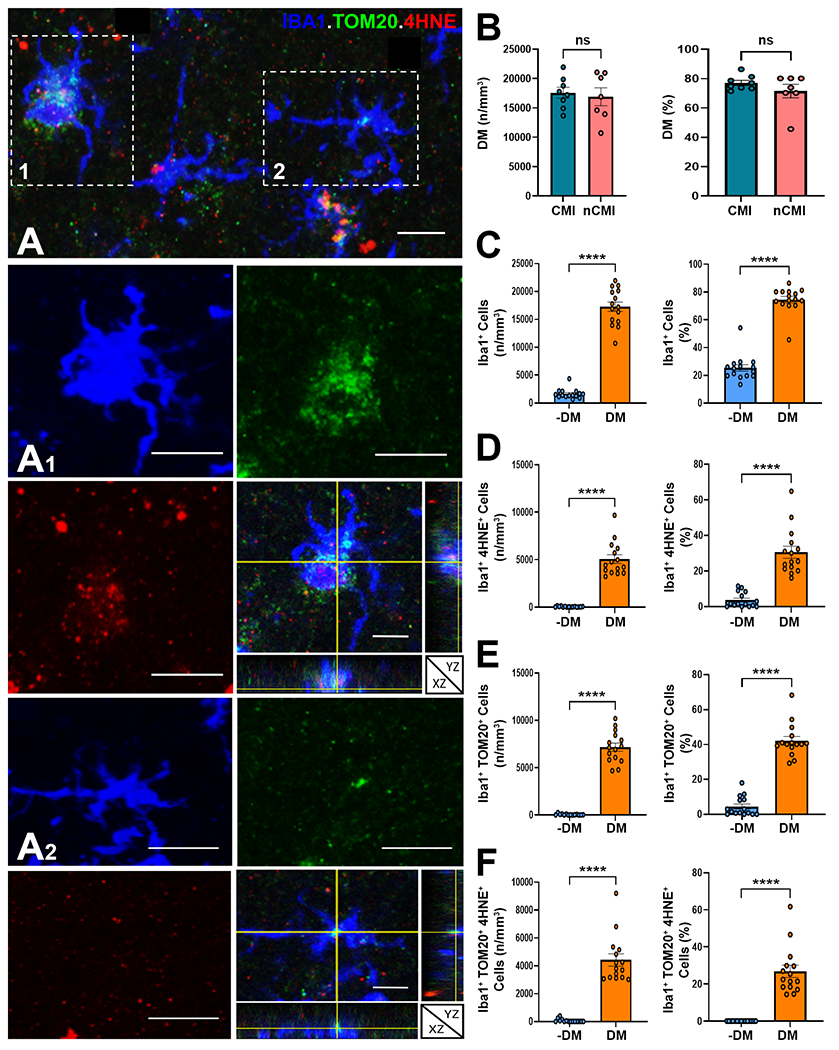
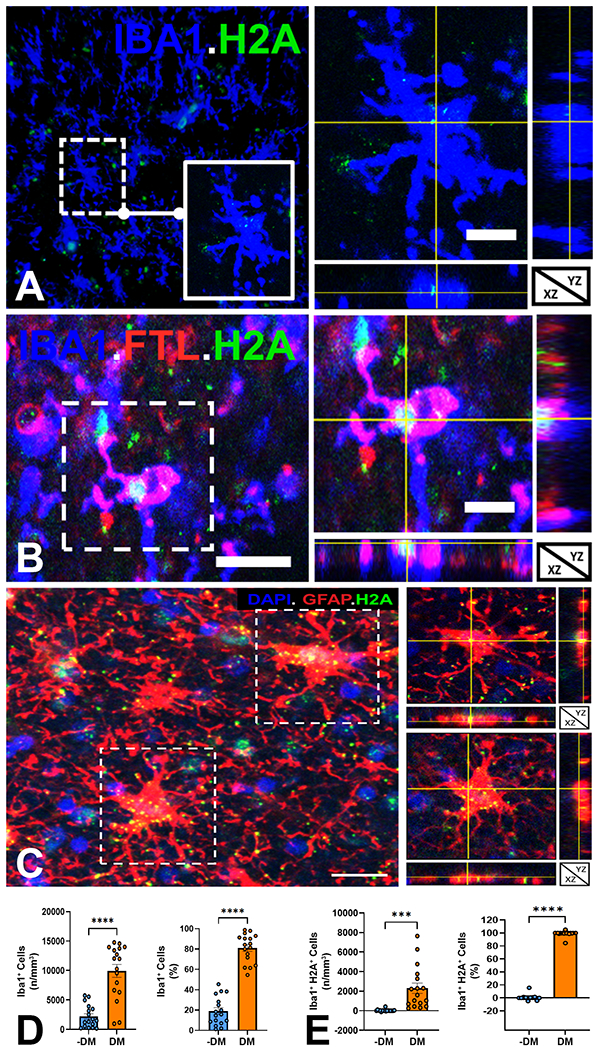
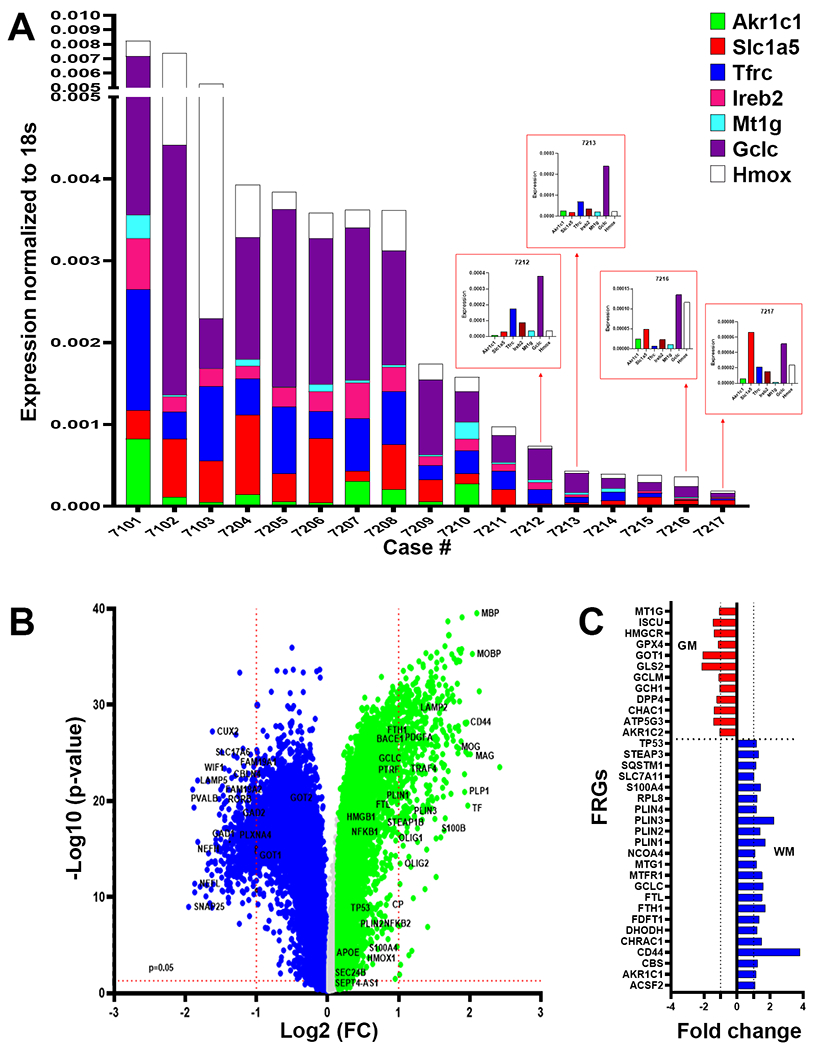
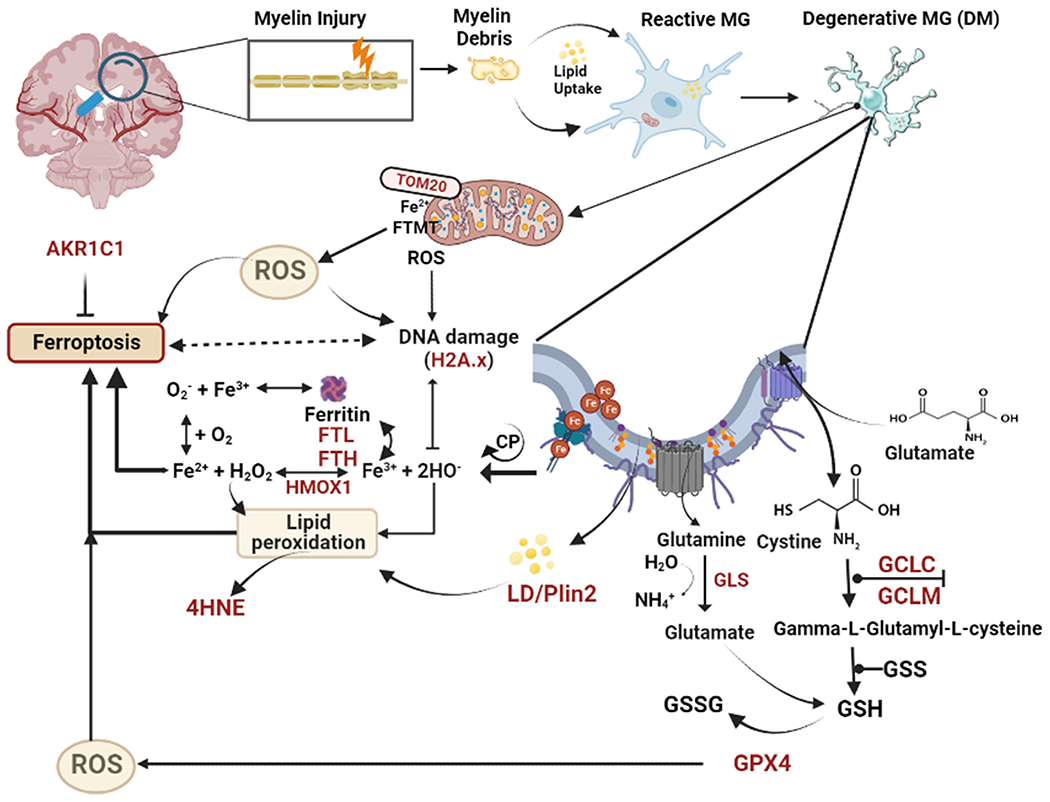
Results: We found that DM, which accumulated myelin debris were selectively enriched in the iron-binding protein light chain ferritin, and accumulated PLIN2-labeled lipid droplets. DM displayed lipid peroxidation injury and enhanced expression for TOM20, a mitochondrial translocase, and a sensor of oxidative stress. DM also displayed enhanced expression of the DNA fragmentation marker phospho-histone H2A.X. We identified a unique set of ferroptosis-related genes involving iron-mediated lipid dysmetabolism and oxidative stress that were preferentially expressed in WM injury relative to gray matter neurodegeneration.

Interpretation: Ferroptosis appears to be a major mechanism of WM injury in Alzheimer's disease and vascular dementia. WM DM are a novel therapeutic target to potentially reduce the impact of WM injury and myelin loss on the progression of cognitive impairment. ANN NEUROL 2023;94:1048-1066.


Conflict of interest statement

Potential Conflicts of Interest: All of the authors declare that they have no potential conflicts of interest.

Figures

Fig. 1.
Fig. 1.
Degenerative microglial (DM) phagocytose myelin debris. (A) A typical Iba1+ DM (red) with a paucity of shrunken processes. Myelin debris (MBPd; green), visualized by staining for myelin basic protein (MBP), was extensively colocalized in the DM soma (merged; arrowheads), as confirmed in the orthogonal views. Scale bars, 20 μm. (B) Example of a DM visualized with ferritin light chain (FTL; red) that extends a prominent phagosome containing myelin debris visualized with MBP (green; arrowhead). DAPI counterstain (blue). See also supplemental figure 2 for a video reconstruction of this cell visualized by 3-D confocal microscopy. Scale bars, 50 μm. (C) Typical example of extensive co-localization of myelin debris in Iba1+ microglia (blue) double-labeled with FluoroMyelin (FM; green) and immunostaining for MBP (red). The boxed region in the triple-labeled panel at lower left is shown in higher detail in the lower right panel and shows the extensive distribution of myelin debris in and around the microglia (arrowheads). Scale bars, 10 μm. (D) Typical appearing reactive astrocytes visualized with GFAP (red) in a demyelinated white matter lesion with a striking lack of myelinated fibers labeled with MBP (green). Inset shows two hypertrophic astrocytes (1 and 2) shown at higher magnifications, that contain scattered puncta of MBPd (yellow; arrowheads). Scale bars, 30 μm. (E and F) Stereological counts of the density and percentage of total Iba1+ microglia that co-localized MBPd among nondegenerative microglia (-DM; teal) vs. DM (salmon) for cases diagnosed with cerebral microinfarcts (CMI) in E and cases lacking CMI’s (nCMI) in F. Student’s t-test, ***p<0.001; ****p<0.0001.
Fig. 2.
Fig. 2.
Degenerative microglia (DM) are iron-enriched and selectively express light chain ferritin (FTL). (A) A subset of Iba1+ microglia (green) label for the iron-binding protein light chain ferritin (FTL; red). A higher magnification detail of the boxed region in the merge image is shown on right. Note clusters of DM (closed arrowheads), which label for FTL, whereas non-degenerative microglia (arrows) label for Iba1 but not for FTL. An intensely labeled fragmented DM process is seen at the upper right (open arrowheads) and shown in the inset at lower left. Scale bars, 50 μm. (B) Density and percentage of ramified (Ram), reactive (Reac), and Degenerative (DM) microglia that were Iba1+FTL+. Note that FTL+DM comprised the major population of microglia in WM lesions. ****p<0.0001; ANOVA with Tukey’s post hoc test. (C) DM but not ramified or reactive microglia were significantly associated with the magnitude of WMI quantified as the density of GFAP+ astrocytes (r2=0.6575; p=0.0044). (D) Microglia labeled for Iba1 (green) and FTL (red) display considerable heterogeneity in terms of iron labeling. Note examples from the subset of non-degenerative microglial (green only; arrowhead #1) that do not label with FTL, with their location noted in the ferritin image as dashed circles (#1). In contrast, in the merge image, numerous DM are visualized (red/yellow) which varied from FTL labeling restricted to the soma (arrowhead #2) to extensive labeling of the processes. Note FTL+ DM with swollen phagosome (dashed box), which is shown at right at higher magnification (arrowhead indicates the phagosome). Scale bar, 50 μm. (E) FTL is a superior marker for DM when compared to DM identified by morphology using Iba1 alone. A plot of total FTL+ microglia vs. FTL+ DM yielded a more significant association (r2=0.6611; p=0.0023) when compared with analysis using Iba1 alone (r2=0.3993; p=0.0275). (F) FTL (green) does not label GFAP+ astrocytes (red) in WM lesions. Note in the merged image that FTL+ DM (green; arrowheads) were distinguished from astrocyte labeling (red). Scale bars, 50 μm. (G) Total FTL+ DM are significantly associated with the magnitude of WMI, defined as the density of GFAP+ astrocytes (r2=0.0.6630; p=0.0023), whereas no significant association is seen for total Iba1+ microglia.
Fig. 3.
Fig. 3.
DM accumulate lipid droplets visualized with PLIN2. (A) Detail of a DM triple-labeled for Iba1 (blue), FTL (red) and PLIN2 (green). Note the extensive cytoplasmic labeling (arrowheads) of PLIN2 visualized in the merged image of FTL and PLIN2. Scale bars, 30 μm. (B) The density and percentage of Iba1+FTL+PLIN2+DM were similar in CMI and nCMI cases. (C and D) The density of lipid droplets containing DM (Iba1+FTL+PLIN2+; black) was significantly associated with total microglia in white matter lesions (r2=0.6315; p=0.0105). Nondegenerative microglia that lacked PLIN2 (Iba1+FTL, salmon) and DM that lacked PLIN2 (Iba1+FTL+; blue) were not significantly associated with the lesion burden of microgliosis. (E) Detail of an Iba1+ (blue), PLIN2+ (green) microglial cell with lipid peroxidation injury visualized by staining for 4-hydroxynonenol (4-HNE; red). Orthogonal view at right. Scale bars, 30 μm.
Fig. 4.
Fig. 4.
Microglial lipid accumulation is a target for lipid peroxidation injury and mitochondrial oxidative stress in white matter lesions. (A) Example of lesion associated Iba1+ microglia (blue) with varying degrees of lipid peroxidation injury, visualized with 4-hydroxynonenol (4-HNE; red), and mitochondrial oxidative stress, visualized with Tom20 (green). Insets of cells 1 and 2 are shown at higher magnification below together with orthogonal views. Scale bars, 30 μm. (B) The density and percentage of DM were similar in CMI and nCMI cases. (C) The density and percentage of DM in CMI cases was significantly higher than nondegenerative microglia (−DM). (D to F) The density and percentage of DM in CMI cases that labeled for 4-HNE (D), TOM20 (E) and both 4-HNE and TOM20 (F) was significantly higher compared to nondegenerative microglia (−DM). Student’s t-test, ****p<0.0001 in C to F.
Fig. 5.
Fig. 5.
Microglia in white matter lesions sustain DNA damage. (A) Low power view of Iba1+ microglia (blue) stained for DNA double strand breaks with phospho-histone H2A.X (H2A, green). Inset and orthogonal views of a microglia cell with scattered H2A staining consistent with a low level of DNA damage. Scale bars, 30 μm. (B) Detail and orthogonal views of a typical Iba1+ (blue) FTL+ (red) DM with truncated and shrunken processes and intense H2A labeling (arrowheads) consistent with a high level of DNA damage. Scale bars, 30 μm. (C) Low power view of a lesion with several reactive astrocytes (GFAP+, red). Orthogonal views of two cells (dashed boxes) with H2A labeling (green) and DAPI (blue). Scale bars, 30 μm. (D) The density and percentage of DM in white matter lesions was significantly higher than nondegenerative microglia (-DM). (E) The density and percentage of microglia that stained for DNA damage with H2A in white matter lesions was significantly higher for DM compared to nondegenerative microglia (-DM). Because there were no significant differences between CMI and nCMI cases, data was analyzed as the full cohort of 17 cases in D and E. Student’s t-test; ***p< 0.001; ****p<0.0001 in D and E.
Fig. 6.
Fig. 6.
DM are enriched in markers of ferroptosis. (A) Analysis of white matter lesions from 17 cases enrolled in the ACT study diagnosed with dementia-related to microvascular brain injury (mVBI) or ADNC. Gene expression was variably enhanced for seven markers associated with distinct ferroptosis pathways (GCLC, HMOX1, TFRC, IREB2, MR1G, AKRC1c and SLC1A5) quantified by qRT-PCR and normalized to 18S rRNA. (B) Analysis of bulk RNAseq data set from the Allen Institute for Brain Science of gene expression in 110 cases enrolled in the ACT study diagnosed with a spectrum of mVBI or ADNC. Volcano plot of the p-value (−Log 10) and fold change of genes with significantly higher expression in white matter relative to gray matter (green; 21,879 genes) or gray matter relative to white matter (blue; 22,569 genes). A unique set of white matter-associated ferroptosis-related genes were significantly upregulated together with highly expressed genes linked to myelination. (C) Comparison of the fold expression changes for ferroptosis-related genes in white matter (blue) vs. gray matter (red).
Fig. 7.
Fig. 7.
Summary of data supporting a role for ferroptosis in microglial degeneration in human WMI related to vascular dementia or AD. Injury to myelin promotes the accumulation of myelin debris and lipid uptake by senescent reactive microglia (MG). Disturbances in multiple molecules and genes (brown text) appear to contribute to pronounced oxidative stress that leads to a pronounced increase in the number of DM. Central factors appear to involve dysregulation of iron metabolism, impaired generation of glutathione anti-oxidants and mitochondrial metabolic stress, which together contribute to lipid peroxidation injury and DNA damage. Abbreviations: AKR1C1, Aldo-keto reductase family 1 member C1; DM, degenerative microglia; FTL, Ferritin light chain; FTH, Ferritin heavy chain; FTMT, Ferritin mitochondrial; GPX4, Glutathione peroxidase 4; GCLC, Glutamate-cysteine ligase catalytic subunit; GCLM, Glutamate-cysteine ligase modifier subunit; GSH, reduced glutathione; GSSG, oxidized glutathione; 4-HNE, 4-hydxoynonenol; HMOX1, Heme oxygenase 1; H2A.X, phospho-histone H2A.X; LD, lipid droplets; MG, microglia; PLIN2, perilipin 2; ROS, reactive oxygen species; Tom 20, translocase of outer membrane 20.

References

    1. Attems J, Jellinger KA. The overlap between vascular disease and Alzheimer’s disease--lessons from pathology. BMC Med 2014;12:206. - PMC - PubMed
    1. Iadecola C. The pathobiology of vascular dementia. Neuron 2013;80:844–866. - PMC - PubMed
    1. Rosenberg GA, Wallin A, Wardlaw JM, et al. Consensus statement for diagnosis of subcortical small vessel disease. J Cereb Blood Flow Metab 2016;36:6–25. - PMC - PubMed
    1. Sam K, Crawley AP, Conklin J, et al. Development of white matter hyperintensity is preceded by reduced cerebrovascular reactivity. Ann Neurol 2016;80:277–285. - PubMed
    1. Chen A, Akinyemi RO, Hase Y, et al. Frontal white matter hyperintensities, clasmatodendrosis and gliovascular abnormalities in ageing and post-stroke dementia. Brain 2016;139:242–258. - PMC - PubMed

Publication types