. 2023 Oct;30(7):e12826.
doi: 10.1111/micc.12826. Epub 2023 Aug 22.

Three-dimensional spatial quantitative analysis of cardiac lymphatics in the mouse heart

Affiliations

Three-dimensional spatial quantitative analysis of cardiac lymphatics in the mouse heart

Evan H Phillips et al. Microcirculation. 2023 Oct.

Abstract

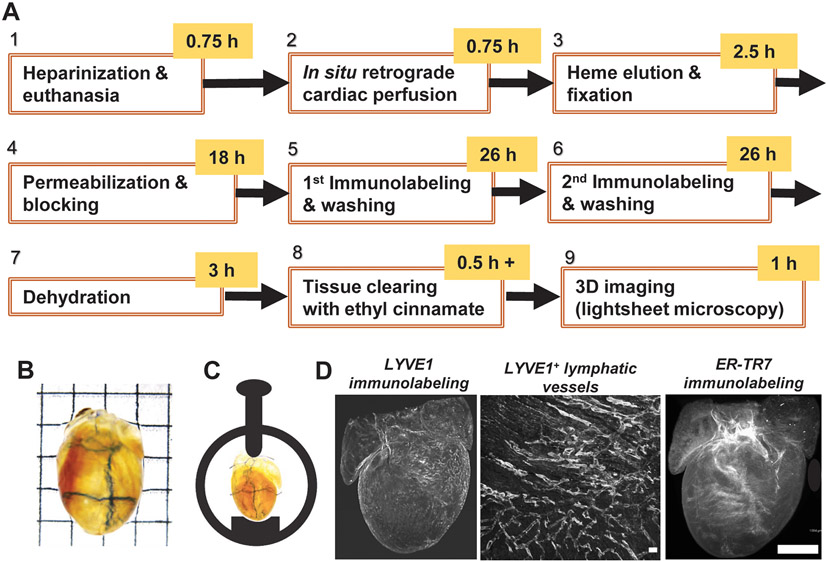
Objective: Three-dimensional (3D) microscopy and image data analysis are necessary for studying the morphology of cardiac lymphatic vessels (LyVs) and their association with other cell types. We aimed to develop a methodology for 3D multiplexed lightsheet microscopy and highly sensitive and quantitative image analysis to identify pathological remodeling in the 3D morphology of LyVs in young adult mouse hearts with familial hypertrophic cardiomyopathy (HCM).

Methods: We developed a 3D lightsheet microscopy workflow providing a quick turn-around (as few as 5-6 days), multiplex fluorescence detection, and preservation of LyV structure and epitope markers. Hearts from non-transgenic and transgenic (TG) HCM mice were arrested in diastole, retrograde perfused, immunolabeled, optically cleared, and imaged. We built an image-processing pipeline to quantify LyV morphological parameters at the chamber and branch levels.

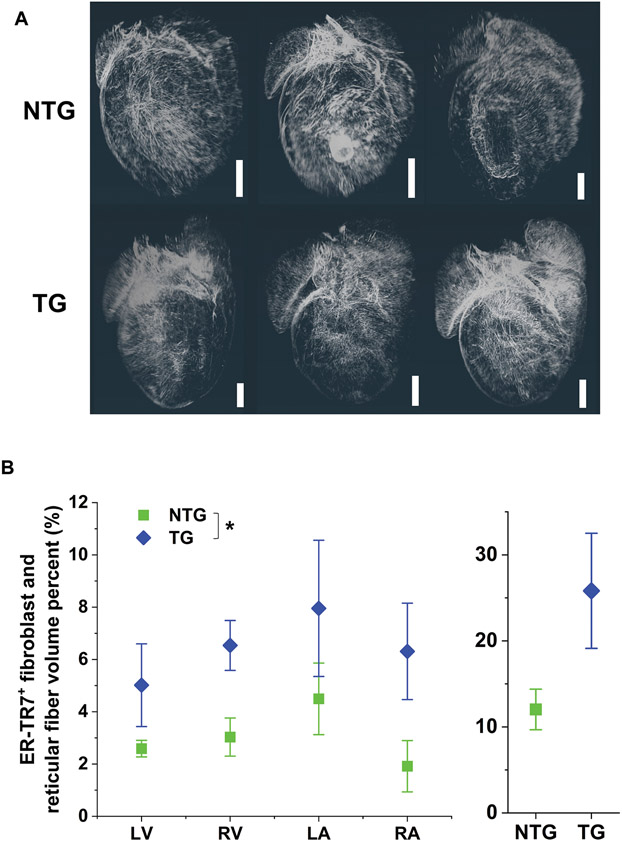
Results: Chamber-specific pathological alterations of LyVs were identified, and significant changes were seen in the right atrium (RA). TG hearts had a higher volume percent of ER-TR7+ fibroblasts and reticular fibers. In the RA, we found associations between ER-TR7+ volume percent and both LyV segment density and median diameter.

Conclusions: This workflow and study enabled multi-scale analysis of pathological changes in cardiac LyVs of young adult mice, inviting ideas for research on LyVs in cardiac disease.

Keywords: 3D imaging; cardiac lymphatics; multiplex fluorescence; optical tissue clearing; vessel morphology.


Conflict of interest statement

Conflict of Interest: The authors declare no conflicts of interest.

Figures

FIGURE 1
FIGURE 1
Workflow for multiplex lightsheet fluorescence microscopy. (A) Nine-step protocol to process and image whole mouse hearts. (B) Dehydrated and optically transparent whole P40 mouse heart used for imaging. Grid edge: 2.5 mm. (C) Orientation and horizontal mounting of heart in a sample holder. The heart is left unembedded and secured in place while immersed in ethyl cinnamate. (D) Left: Raw 3D image data of LYVE1 immunostaining. Middle: 2D maximum intensity projection showing LYVE1+ lymphatic vessels near ventricular surface. Scale bar: 0.1 mm. Right: Raw 3D image data of ER-TR7 immunostaining against endogenous autofluorescence. Scale bar: 1 mm.
FIGURE 2
FIGURE 2
LyV distribution in NTG and TG P40 hearts and chamber-level measurements. (A) Superficial LyV segments are displayed as vessel centerlines and viewed in 3D from a posterior perspective of each imaged sample. The color scale corresponds to average diameter of a given LyV segment, with red being largest (48 μm maximum). Of note are the enlarged left and right atria in the TG hearts (white arrows point to RA). Scale bar: 1 mm. (B) Cardiac tissue volume (μm3) of each chamber in NTG and TG hearts was determined by 3D segmentation. (C) LyV segment density was calculated as number of segments normalized to respective cardiac tissue volume (open circle symbols; left y-axis). Number of LyV segments in each chamber is also plotted (square symbols; right y-axis). (D-E) Chamber average values of LyV average segment diameter (D) and LyV average segment length (E). Each symbol corresponds to a chamber-level measurement for a mouse heart. *, p<0.05 by two sample t-test; otherwise, no statistically significant difference between NTG/TG pairs for each chamber.
FIGURE 3
FIGURE 3
Branch-level measurements of LyV segments across chambers. Histograms show distributions of LyV segments for NTG (green) and TG (blue) hearts according to segment diameter (left column: A, C, E, G) and segment length (right column: B, D, F, H) in RA, LA, RV, and LV. Bin sizes: 1 μm (diameter) and 10 μm (length). Thick distribution lines: average. Shaded areas: standard error of mean. Interquartile ranges were analyzed and Mann Whitney U-tests were run to compare each set of binned distributions for NTG and TG hearts (see Table 1).
FIGURE 4
FIGURE 4
Distribution and chamber-level measurements of ER-TR7+ fibroblasts and reticular fibers. (A) Voxelized renderings of the final structure-enhanced ER-TR7+ fibroblasts and reticular fibers in all chambers are shown in 3D from a posterior perspective of each imaged sample. Scale bar: 1 mm. (B) Volume percent of ER-TR7+ fibroblasts and reticular fibers measured in individual chambers of NTG and TG hearts (left). There was a statistically significant difference in the population means of the NTG and TG groups (two-way ANOVA; *, p=0.0042). Summed ER-TR7+ signal is displayed for NTG and TG hearts (right).
FIGURE 5
FIGURE 5
Association between ER-TR7+ volume percent and LyVs. (A) LyVs tubes (color-coded according to segment diameter) overlaid on voxelized fibroblasts and reticular fibers (grayscale) from a posterior view of the top half of an NTG (left) and TG (right) heart. Scale bar: 700 μm. The color scale corresponds to average diameter of a given LyV segment, with red being largest (48 μm maximum). (B) Inverse association between ER-TR7+ volume percent (Figure 4B) and LyV segment density (Figure 2C) in RA and LA (black colored symbols; n=5) in TG and NTG hearts. RV and LV values (red colored symbols; n=6) failed to fit linear regression curve. (C) Association between ER-TR7+ volume percent (Figure 4B) and LyV median segment diameter in RV and RA (black colored symbols; n=6) in TG and NTG hearts. LV and LA values (red colored symbols; n=6) failed to fit linear regression curve. Blue shaded areas represent the 95% prediction interval for the regression curves.

Update of

References

    1. Shore LR (1929) The lymphatic drainage of the human heart. J. Anat, 63(Pt 3), 291–313. - PMC - PubMed
    1. Johnson RA, and Blake TM (1966) Lymphatics of the heart. Circulation, 33 (1), 137–142. - PubMed
    1. Sacchi G, Weber E, Agliano M, Cavina N, and Comparini L (1999) Lymphatic vessels of the human heart: precollectors and collecting vessels. A morpho-structural study. J Submicrosc. Cytol. Pathol, 31 (4), 515–525. - PubMed
    1. Brakenhielm E, and Alitalo K (2019) Cardiac lymphatics in health and disease. Nature Reviews Cardiology, 16 (1), 56–68. - PubMed
    1. Brakenhielm E, González A, and Díez J (2020) Role of Cardiac Lymphatics in Myocardial Edema and Fibrosis: JACC Review Topic of the Week. Journal of the American College of Cardiology, 76 (6), 735–744. - PubMed

Publication types

LinkOut - more resources