. 2023 Nov;56(11):618-623.
doi: 10.5483/BMBRep.2023-0065.

Protein phosphatase 4 dephosphorylates phosphofructokinase-1 to regulate its enzymatic activity

Affiliations

Protein phosphatase 4 dephosphorylates phosphofructokinase-1 to regulate its enzymatic activity

Jaehong Park et al. BMB Rep. 2023 Nov.

Abstract

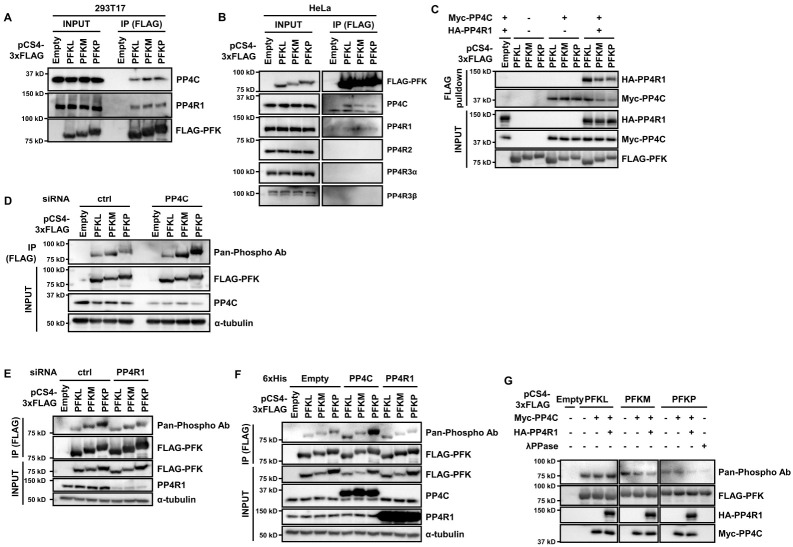
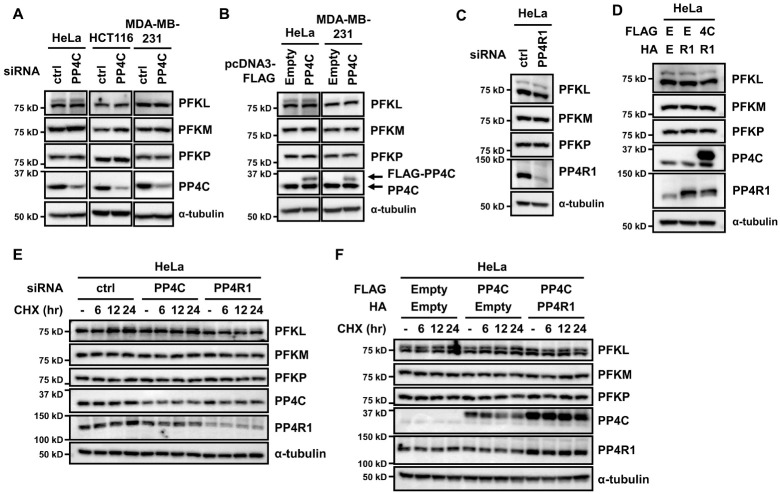
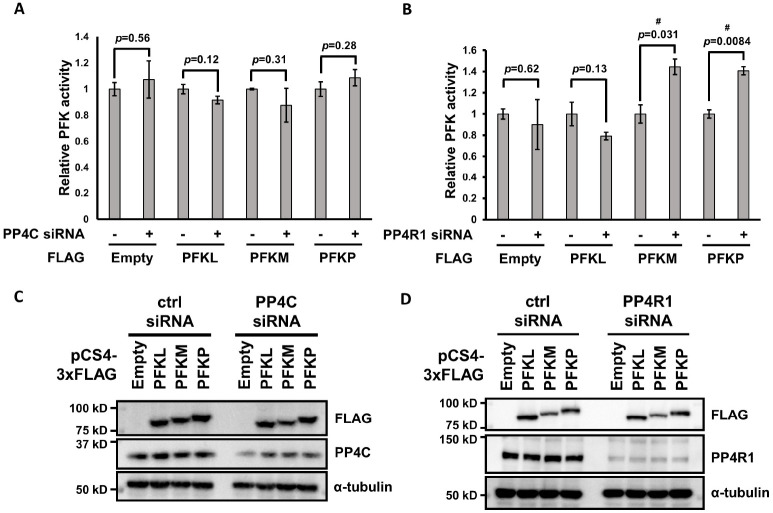
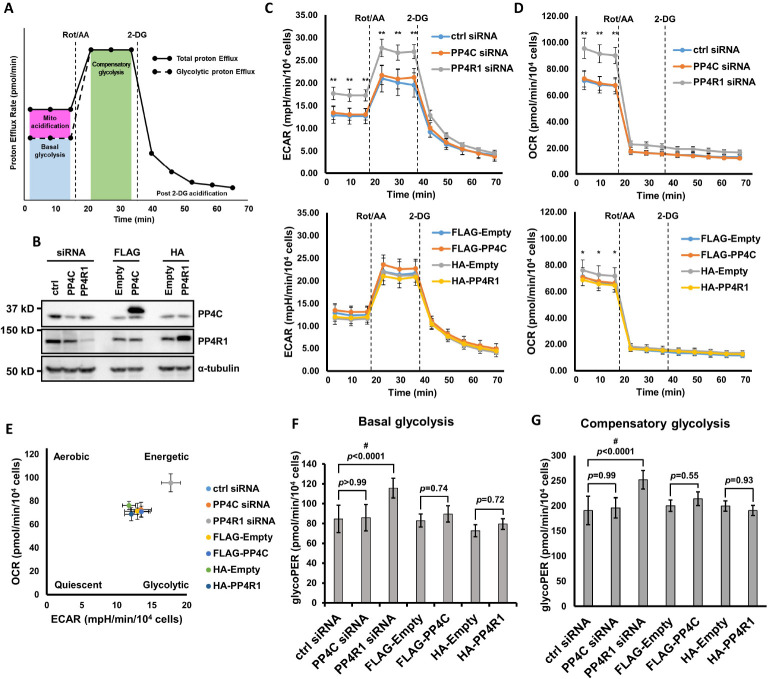
Most cancer cells utilize glucose at a high rate to produce energyand precursors for the biosynthesis of macromolecules such as lipids, proteins, and nucleic acids. This phenomenon is called the Warburg effect or aerobic glycolysis- this distinct characteristic is an attractive target for developing anticancer drugs. Here, we found that Phosphofructokinase-1 (PFK-1) is a substrate of the Protein Phosphatase 4 catalytic subunit (PP4C)/PP4 regulatory subunit 1 (PP4R1) complex by using immunoprecipitation and in vitro assay. While manipulation of PP4C/PP4R1 does not have a critical impact on PFK-1 expression, the absence of the PP4C/PP4R1 complex increases PFK-1 activity. Although PP4C depletion or overexpression does not cause a dramatic change in the overall glycolytic rate, PP4R1 depletion induces a considerable increase in both basal and compensatory glycolytic rates, as well as the oxygen consumption rate, indicating oxidative phosphorylation. Collectively, the PP4C/PP4R1 complex regulates PFK-1 activity by reversing its phosphorylation and is a promising candidate for treating glycolytic disorders and cancers. Targeting PP4R1 could be a more efficient and safer strategy to avoid pleiotropic effects than targeting PP4C directly. [BMB Reports 2023; 56(11): 618-623].


Conflict of interest statement

CONFLICTS OF INTEREST

The authors have no conflicting interests.

Figures

Fig. 1
Fig. 1
PFK-1 is a substrate of PP4. (A, B) FLAG-PFK-1 isoforms interact with endogenous PP4C and PP4R1. Plasmids encoding FLAG-PFK-1 were transfected into 293T17 (A) or HeLa (B) cells. The cells were immunoprecipitated with ANTI-FLAG M2-magnetic beads, followed by immunoblotting with antibodies against FLAG, PP4C, PP4R1, PP4R2, PP4R3α, and PP4R3β. (C) In vitro binding assay between PFK-1 and PP4C/PP4R1. FLAG-PFK-1, Myc-PP4C, and HA-PP4R1 were immunoprecipitated, mixed, and incubated for 1 h at 30°C. After wash, the mixtures were subjected to immunoblotting with antibodies against FLAG, HA, and Myc. (D, E) Phosphorylation of PFKM and PFKP increases upon PP4C/PP4R1 depletion. 293T17 cells were transfected with PP4C (D) or PP4R1 (E) siRNA and plasmids for FLAG-PFK-1, lysed, immunoprecipitated, and immunoblotted with antibodies against FLAG, PP4C, α-tubulin, and pan-phosphorylation. (F) PP4C overexpression increases PFKL and PFKP phosphorylation. 293T17 cells were cotransfected with plasmids encoding FLAG-PFK-1 and His-PP4C or PP4R1, immunoprecipitated, and immunoblotted with antibodies against FLAG, PP4C, PP4R1, α-tubulin, and pan-phosphorylation. (G) In vitro dephosphorylation assay. Immunoprecipitated FLAG-PFK-1, Myc-PP4C, and HA-PP4R1 were mixed and incubated for 1 h at 30°C, followed by immunoblotting. Lambda phosphatase (λPPase) was used as a positive control. Representative data are from experiments performed in triplicate.
Fig. 2
Fig. 2
PP4C/PP4R1 does not regulate PFK-1 expression. (A) HeLa, HCT116, and MDA-MB-231 cells were transfected with PP4C siRNA, and the cell lysates were probed with antibodies against PFKL, PFKM, PFKP, PP4C, and α-tubulin. (B) In parallel, HeLa and MDA-MB-231 cells transiently transfected with FLAG-PP4C plasmid were lysed for immunoblotting. (C) HeLa cells were transfected with PP4R1 siRNA and subjected to immunoblotting. (D) HeLa cells were cotransfected with FLAG-PP4C and HA-PP4R1 and analyzed by western blot. E, Empty; 4C, PP4C; R1, PP4R1. (E, F) HeLa cells transfected with PP4C or PP4R1 siRNA (E) or a plasmid encoding PP4C or PP4R1 (F) were treated with 100 μg/ml cycloheximide (CHX) for 6, 12, or 24 h and subjected to immunoblotting. Representative data are from experiments performed in triplicate.
Fig. 3
Fig. 3
The PP4C/PP4R1 complex inhibits PFK-1 activity. (A, B) HeLa cells were transfected with PP4C (A) or PP4R1 (B) siRNA in combination with plasmids encoding FLAG-PFK-1 isoforms and cells were collected to analyze PFK activity. Experiments were performed in triplicate and data are expressed as mean ± standard deviation (SD). Statistical analysis was performed using an unpaired, two-tailed Student’s t-test. P-values are described on the graph. # indicates statistical significance (P < 0.05). (C, D) Confirmation of expression level for the PFK activity assay. The cell lysates used for PFK activity assay were subjected to immunoblotting with antibodies against PP4C, PP4R1, FLAG, and α-tubulin. Representative blots are shown.
Fig. 4
Fig. 4
PP4R1 depletion boosts glycolytic rate and OCR. (A) Agilent Seahorse XF Glycolytic rate assay profile. This figure was adapted from the manufacturer’s manual. Measured PER contains both glycolysis and mitochondria-derived acidification. Basal glycoPER can be calculated by subtracting mitochondrial acidification from total PER. Rotenone/antimycin A (Rot/AA; inhibitors of mitochondrial electron transport chain) inhibit OXPHOS and induce compensatory changes to meet the energy demands. 2-DG confirms that PER measured is attributed primarily to glycolysis. (B) Confirmation of expression level for Seahorse analysis. HeLa cells were transfected with either siRNA or plasmids to manipulate PP4C or PP4R1 expression. Altered expression was analyzed by western blot. Representative blots are shown. (C, D) Measurement of ECAR (C) and OCR (D) levels in PP4C/PP4R1-depleted (upper panel) or overexpressing (lower panel) HeLa cells. OCR and ECAR levels were measured under basal conditions and after injecting Rot/AA and 2-DG, in that order. Statistical analysis was performed using two-way ANOVA with Tukey’s multiple comparison test. * means P < 0.05 for HA-Empty vs. HA-PP4R1, ** means P < 0.001 for ctrl siRNA vs. PP4R1 siRNA. (E) Energy map representing OCR vs ECAR. Values measured first under basal conditions were used to create the graph. (F, G) Basal (F) and compensatory (G) glycolytic rate in HeLa cells with altered expression of PP4C and PP4R1. Statistical analysis was performed using one-way ANOVA with Tukey’s test. # indicates statistical significance (P < 0.05). Experiments were performed in triplicate and representative results are shown. Data are expressed as mean ± standard deviation (SD). P-values are described on the graph.

Similar articles

Cited by

References

    1. Ashton TM, McKenna WG, Kunz-Schughart LA, Higgins GS. Oxidative phosphorylation as an emerging target in cancer therapy. Clin Cancer Res. 2018;24:2482–2490. doi: 10.1158/1078-0432.CCR-17-3070. - DOI - PubMed
    1. Moreno-Sánchez R, Rodríguez-Enríquez S, Marín-Hernández A, Saavedra E. Energy metabolism in tumor cells. FEBS J. 2007;274:1393–1418. doi: 10.1111/j.1742-4658.2007.05686.x. - DOI - PubMed
    1. Ganapathy-Kanniappan S, Geschwind JFH. Tumor glycolysis as a target for cancer therapy: progress and prospects. Mol Cancer. 2013;12:152. doi: 10.1186/1476-4598-12-152. - DOI - PMC - PubMed
    1. Bonnet S, Archer SL, Allalunis-Turner J, et al. A mitochondria-K+ channel axis is suppressed in cancer and its normalization promotes apoptosis and inhibits cancer growth. Cancer Cell. 2007;11:37–51. doi: 10.1016/j.ccr.2006.10.020. - DOI - PubMed
    1. Pelicano H, Martin DS, Xu RH, Huang P. Glycolysis inhibition for anticancer treatment. Oncogene. 2006;25:4633–4646. doi: 10.1038/sj.onc.1209597. - DOI - PubMed

MeSH terms

Substances