. 2023 Aug 22;8(16):e163403.
doi: 10.1172/jci.insight.163403.

Alveolar type II epithelial cell FASN maintains lipid homeostasis in experimental COPD

Affiliations

Alveolar type II epithelial cell FASN maintains lipid homeostasis in experimental COPD

Li-Chao Fan et al. JCI Insight. .

Abstract

Alveolar epithelial type II (AEC2) cells strictly regulate lipid metabolism to maintain surfactant synthesis. Loss of AEC2 cell function and surfactant production are implicated in the pathogenesis of the smoking-related lung disease chronic obstructive pulmonary disease (COPD). Whether smoking alters lipid synthesis in AEC2 cells and whether altering lipid metabolism in AEC2 cells contributes to COPD development are unclear. In this study, high-throughput lipidomic analysis revealed increased lipid biosynthesis in AEC2 cells isolated from mice chronically exposed to cigarette smoke (CS). Mice with a targeted deletion of the de novo lipogenesis enzyme, fatty acid synthase (FASN), in AEC2 cells (FasniΔAEC2) exposed to CS exhibited higher bronchoalveolar lavage fluid (BALF) neutrophils, higher BALF protein, and more severe airspace enlargement. FasniΔAEC2 mice exposed to CS had lower levels of key surfactant phospholipids but higher levels of BALF ether phospholipids, sphingomyelins, and polyunsaturated fatty acid-containing phospholipids, as well as increased BALF surface tension. FasniΔAEC2 mice exposed to CS also had higher levels of protective ferroptosis markers in the lung. These data suggest that AEC2 cell FASN modulates the response of the lung to smoke by regulating the composition of the surfactant phospholipidome.

Keywords: COPD; Intermediary metabolism; Metabolism; Pulmonary surfactants; Pulmonology.


Conflict of interest statement

Conflict of interest: AMKC is a cofounder and equity stockholder for Proterris, which develops therapeutic uses for CO. AMKC has a use patent on CO. Additionally, AMKC and SMC have patents in chronic obstructive pulmonary disease (US Patent 10905682).

Figures

Figure 1
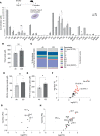
Figure 1. Comprehensive lipidomic analysis of primary AEC2 cells from mice exposed to CS for 6 months.
(AC) Schematic for the timeline of smoke exposure for the isolation of AEC2 cells for lipidomic analysis with individual lipid compositions (A), total lipid levels (B), and percentage abundance of surfactant-related lipids (calculated by expressing the concentration of each lipid family as a percentage of total lipids) (C) in isolated AEC2 cells from mice exposed to CS or air for 6 months (n = 4 mice per group). FC, free cholesterol; CE, cholesterol ester; AC, acyl carnitine; MG, monoacylglycerol; DG, diacylglycerol; TG, triacylglycerol; Cer, ceramide; dhCer, dihydroceramide; MhCer, monohexosylceramide; Sulf, sulfatide; LacCer, lactosylceramide; GM3, monosialodihexosylganglioside; GB3, globotriaosylceramide; BMP, bis(monoacylglycero)phosphate; AcylPG, acyl phosphatidylglycerol; SM, sphingomyelin; PA, phosphatidic acid; PC, phosphatidylcholine; PCe, phosphatidylcholine ether; PE, phosphatidylethanolamine; PEp, plasmalogen phosphatidylethanolamine; PS, phosphatidylserine; PI, phosphatidylinositol; PG, phosphatidylglycerol; LPC, lysophosphatidylcholine; LPE, lysophosphatidylethanolamine; LPEp, plasmogen lysophosphatidylethanolamine; LPI, lysophosphatidylinositol; LPS, lysophosphatidylserine; NAPE, N-acyl phosphatidylethanolamine; NAPS, N-acyl phosphatidylserine. (D and E) Concentration of MUFA- (D) and PUFA- (E) containing lipids in isolated AEC2 cells from mice exposed to CS or air for 6 months. (FH) Volcano plots of altered TG species (F), ether lysophosphatidylcholines (LPCes) (G), and plasmalogen phosphatidylethanolamines (PEps) (H) in isolated AEC2 cells from mice exposed to CS or air for 6 months (n = 4 mice per group). Red dots denote P < 0.05 fold-change of +2. Data representative of 1 independent experiment with n = 4 mice per group and presented as mean ± SEM (*P < 0.05, **P < 0.01, by Student’s unpaired t test).
Figure 2
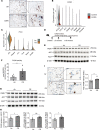
Figure 2. FASN is localized to AEC2 cells and is regulated by CS.
(A) Representative immunohistochemical (IHC) stain of FASN in lung sections from healthy control (Ctrl) and chronic obstructive pulmonary disease (COPD) patients (n = 3 per group). Scale bars, 200 μm. Insets, original magnification, ×8. (B and C) Violin plots of normalized expression values for FASN in human (B) and murine (C) lung cells. “AT1” refers to alveolar epithelial type I cells; “AT2B” refers to alveolar epithelial type II cells associated with canonical “bulk” AT2 markers such as SFTPA1, SFTPA2, and ETV5; and “AT2S” refers to AEC2 cells that are more stem-like with increased expression of ERBB4, TNIK, TCF12, FOXP1, STAT3, YAP, and TEAD1. (D) Schematic for the timeline of CS exposure. (E) Representative immunoblot of FASN, acetyl-CoA carboxylase (ACC), ATP citrate lyase (ACLY), and β-actin (n = 6 per group) expression in murine lung tissues from C57BL/6 mice exposed to CS or air for 6 weeks. Immunoblotting for FASN and β-actin was carried out on the same gel/membrane; immunoblotting for ACC and ACLY was carried out on the same gel/membrane. The same samples were used to load both gels. See complete unedited blots in the supplemental material. (F) FASN enzymatic activity (n = 6 in air group, n = 5 in CS group) in murine lung tissues from C57BL/6 mice exposed to CS or air for 6 weeks. (G) Immunoblotting of FASN, ACC, and ACLY expression in primary AEC2 cells isolated from C57BL/6 mice exposed to CS or air for 6 months (n = 4 per group) with quantification (H). Immunoblotting for ACC and ACLY were carried out on the same gel/membrane. FASN and β-actin were run on separate gels. The same samples were used to load all gels. (I) Representative IHC staining of FASN in lung sections from C57BL/6 mice exposed to CS or air for 6 months (n = 3 per group) with corresponding quantification. Scale bars, 200 μm. Insets, original magnification, ×8. AOD, average optical density. Data are presented as mean ± SEM; *P < 0.05 by Student’s unpaired t test.
Figure 3
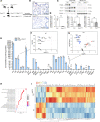
Figure 3. Generation of FasniΔAEC2 mice with altered lung lipid levels.
(A) Fasnfl/fl and Sftpc-Cre+/+ mice were crossed to generate FasniΔAEC2 and control SftpcCreERT2+/– mice, and both were induced by tamoxifen to drive CreERT2. (B) Representative IHC staining of FASN in lung tissue from FasniΔAEC2 and control SftpcCreERT2+/– mice (n = 4 per group). Scale bars, 100 μm, (n = 3 experiments). (C and D) Representative immunoblot (n = 3 experiments) (C) with quantification (D) of FASN, ACLY, and ACC protein expression in primary isolated AEC2 cells and whole lung homogenates from FasniΔAEC2 and control SftpcCreERT2+/– mice (n = 3 per group). **P < 0.01 by Student’s unpaired t test. Immunoblotting for FASN, ACLY, and β-actin was carried out on the same membrane; immunoblotting for ACC was carried out on a separate membrane. The same samples were used to load both gels. (EG) Lipidomic profiling (E) of whole lung lipid extracts from FasniΔAEC2 and control SftpcCreERT2+/– mice with subgroup analysis of (F) acyl carnitine (AC) and (G) phosphatidylglycerol (PG) species. Red dots denote P < 0.05 fold-change of +2; blue dots denote P < 0.05 fold-change of –2. Data are expressed as mean ± SEM. (*P < 0.05, **P < 0.01, by Student’s unpaired t test, n = 3 mice per group of 1 independent experiment.) (H) Gene ontology pathway analysis of lipid metabolic processes of significantly altered genes represented as a (I) heatmap from whole lung transcriptomic profiling of FasniΔAEC2 and control SftpcCreERT2+/– mice (n = 3 mice per group, 1 independent experiment).
Figure 4
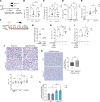
Figure 4. Targeted deletion of FASN in AEC2 cells results in age-associated airspace enlargement.
(AD) (A) Schematic of timeline for inspiratory capacity (B), compliance (C), and elastance (D) of 13- to 14-week-old FasniΔAEC2 and SftpcCreERT2+/– control mice (n = 5–6 per group). (E) Schematic and (F) representative IHC modified gills-stained lung sections (left) with mean chord length (MCL) values (right) of 24-month SftpcCreERT2+/– control and FasniΔAEC2 mice (Ctrl n = 9; FasniΔAEC2 n = 13). (G) Schematic of FasniΔAEC2 and control SftpcCreERT2+/– mice fed with high-fat (60%) or low-fat (10%) diet at age 12 months until sacrifice at 18 months. (H) Representative IHC modified gills-stained lung sections and (I) MCL values with (J) representative TUNEL stain and corresponding quantification (right) from FasniΔAEC2 and control SftpcCreERT2+/– mice at 18 months upon supplementation with a high-fat (60%) or low-fat (10%) diet in lung tissue and MCL scoring of mouse lungs for each group. (Ctrl low fat, n = 12; FasniΔAEC2 low fat, n = 11, Ctrl high fat, n = 12, FasniΔAEC2 high fat, n = 7.) Data represented as mean ± SEM of 1 independent experiment. *P < 0.05 by 1-way ANOVA, #P < 0.05 by Student’s unpaired t test.
Figure 5
Figure 5. Targeted deletion of FASN in AEC2 cells results in increased lung injury, inflammation, and airspace enlargement upon acute or chronic smoke exposure.
(A) Schematic of timeline of FasniΔAEC2 and control SftpcCreERT2+/– mice exposed to acute (6 weeks) or chronic (8 months) CS exposure. (B) Total BALF leukocyte counts, (C) total macrophage counts, (D) total neutrophil counts (n = 9–10 mice per group), and (E) total protein concentrations in BALF (n = 6–9 mice per group, n = 2 technical replicates) of FasniΔAEC2 and control SftpcCreERT2+/– mice after acute (6 weeks) CS exposure. (F) Schematic of treatment regimen with the FASN inhibitor C75 and smoke. (G) Plasma free fatty acid levels (n = 5 mice per group), (H) total BALF leukocytes, and (I) total BALF macrophages of mice administered C75 (1 mg/kg 1–7 days, 2.5 mg/kg days 7–13, 5 mg/kg days 14–22, then 10 mg/kg days 23–42, DMSO as control) for a total of 42 days of exposure to CS. (n = 4–5 mice per group.) (J) Representative IHC images of modified gills-stained lung sections (top) and MCL scoring (bottom) of mouse lungs for each group (n = 8–15 mice per group) calculated from FasniΔAEC2 and SftpcCreERT2+/– control mice, as well as C57BL/6 controls exposed to 8 months of CS exposure. (K) Representative IHC image of TUNEL stain of lung tissue from FasniΔAEC2 and SftpcCreERT2+/– control mice exposed to 8 months of CS with corresponding quantification norm (right). (L) Densitometric analysis of fold-change in p53 expression by immunoblotting in the whole lung tissue of FasniΔAEC2 and SftpcCreERT2+/– control mice exposed to 6 months of CS (n = 3 mice per group) normalized to β-actin. Scale bars, 50 μm. Data represented as mean ± SEM of 1 independent experiment. *P < 0.05 by 1-way ANOVA followed by Tukey’s correction. #P < 0.05 by Student’s unpaired t test.
Figure 6
Figure 6. Targeted deletion of FASN in AEC2 cells alters the BALF lipidome and surface tension of the lung in response to smoke.
(A) Schematic of BALF lipidomic profiling of FasniΔAEC2 and control SftpcCreERT2+/– mice exposed to 6 weeks of smoke or room air. (B) Total lipid levels, (C) abundance (expressed as each surfactant lipid as a percentage of total lipids), (D) DPPC levels, (E) families of lipids and (F and G) individual LPCe species (F) or individual (G) dhSM and LacCer species (H) PCe in FasniΔAEC2 and control SftpcCreERT2+/– mice exposed to 6 weeks of smoke (n = 4 per group). Red dots denote P < 0.05 fold-change of +2; blue dots denote P < 0.05 fold-change of –2. (I) Interfacial activity of the murine BALF in FasniΔAEC2 and control SftpcCreERT2+/– mice exposed to 6 weeks of smoke (n = 5 per group) determined utilizing a sessile drop tensiometer. Data represented as mean ± SEM of 1 independent experiment. *P < 0.05, **P < 0.01, ***P < 0.001, by 1-way ANOVA followed by Tukey’s correction.
Figure 7
Figure 7. Targeted deletion of FASN in AEC2 cells increases abundance of PUFA-bound lipids and increases markers of ferroptosis in response to smoke.
(A) Volcano plot of significantly altered PUFA-containing phospholipids in the FasniΔAEC2 mice compared with SftpcCreERT2+/– control mice in response to 6 weeks of smoke (n = 4 per group). (B) Percentage abundance of saturated fatty acid–containing (SFA-containing), MUFA-containing, and PUFA-containing phosphatidylcholine species (calculated by expressing the concentration of each SFA, MUFA, and PUFA as a percentage of total phosphatidylcholine species). (C) Representative immunoblots (left) and relative quantification (right) for the ferroptosis markers, SLC7A11 and GPX4, with corresponding β-actin loading controls in FasniΔAEC2 mice compared with SftpcCreERT2+/– control mice in response to 6 months of smoke. Immunoblot representative of n = 2 mice per group; densitometry representative of n = 3–5 mice per group. Data represented as mean ± SEM of 1 independent experiment. *P < 0.05 by 1-way ANOVA followed by Tukey’s correction.

References

    1. Vestbo J, et al. Global strategy for the diagnosis, management, and prevention of chronic obstructive pulmonary disease: GOLD executive summary. Am J Respir Crit Care Med. 2013;187(4):347–365. doi: 10.1164/rccm.201204-0596PP. - DOI - PubMed
    1. GBD Chronic Respiratory Disease Collaborators. Prevalence and attributable health burden of chronic respiratory diseases, 1990-2017: a systematic analysis for the Global Burden of Disease Study 2017. Lancet Respir Med. 2020;8(6):585–596. doi: 10.1016/S2213-2600(20)30105-3. - DOI - PMC - PubMed
    1. Barnes PJ, et al. Cellular and molecular mechanisms of chronic obstructive pulmonary disease. Clin Chest Med. 2003;22(4):672–686. doi: 10.1016/j.ccm.2013.10.004. - DOI - PubMed
    1. Yokohori N, et al. Increased levels of cell death and proliferation in alveolar wall cells in patients with pulmonary emphysema. Chest. 2004;125(2):626–632. doi: 10.1378/chest.125.2.626. - DOI - PubMed
    1. Zhang Y, et al. A Gata6-Wnt pathway required for epithelial stem cell development and airway regeneration. Nat Genet. 2008;40(7):862–870. doi: 10.1038/ng.157. - DOI - PMC - PubMed

Publication types