. 2023 Aug 22;8(16):e169584.
doi: 10.1172/jci.insight.169584.

Ancestry-based differences in the immune phenotype are associated with lupus activity

Affiliations

Ancestry-based differences in the immune phenotype are associated with lupus activity

Samantha Slight-Webb et al. JCI Insight. .

Abstract

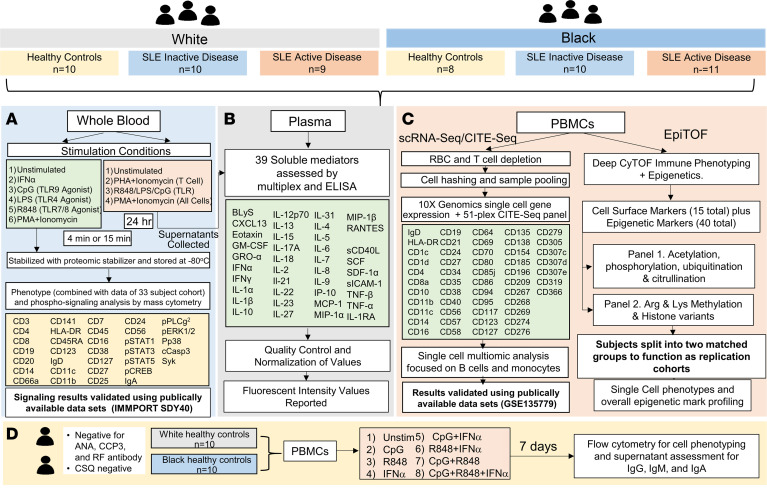
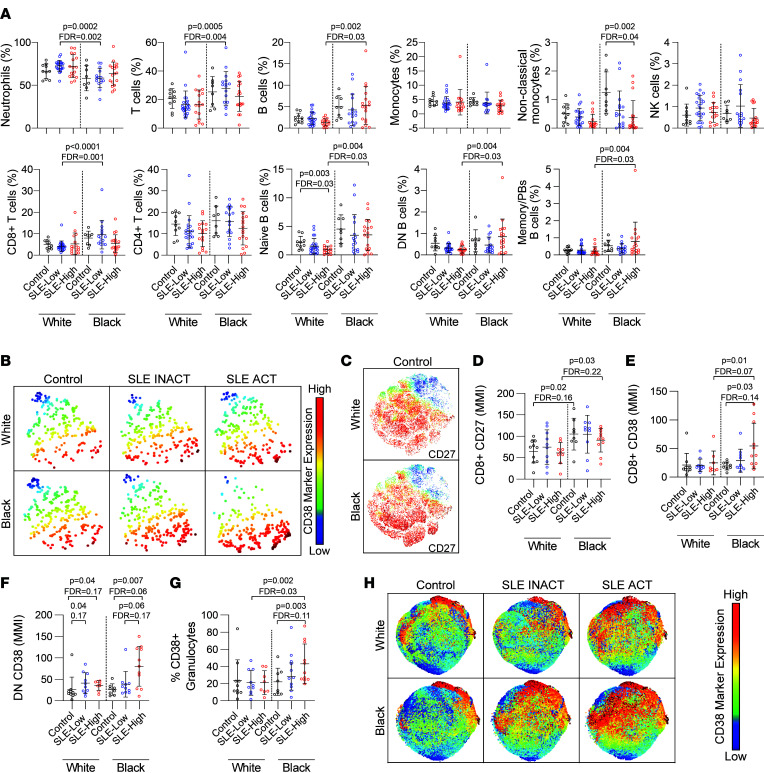
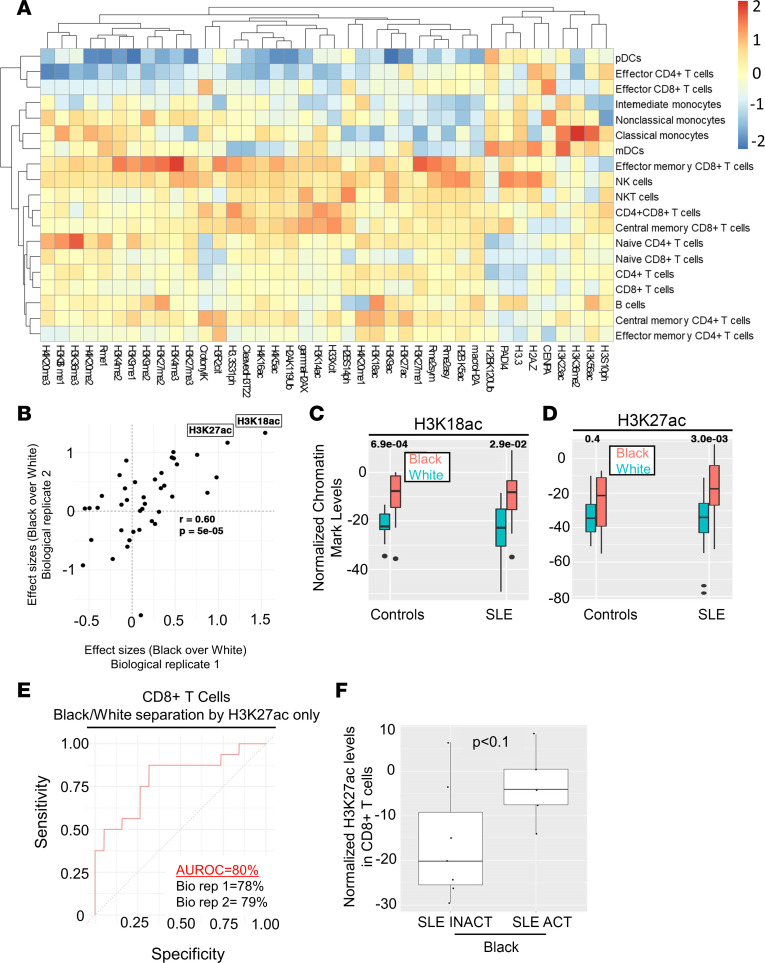
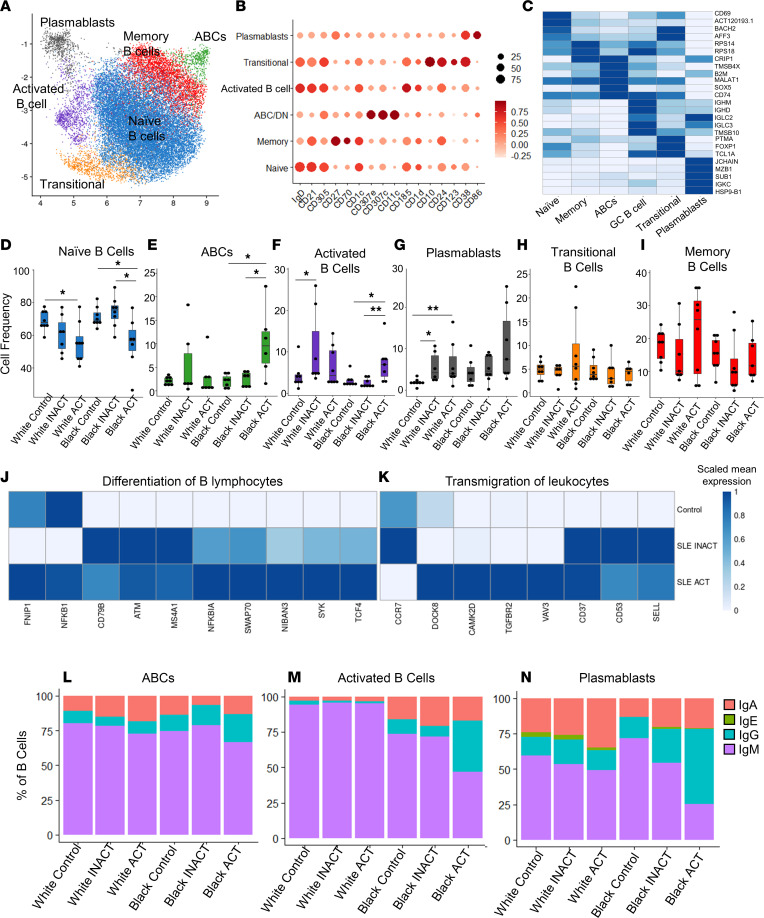
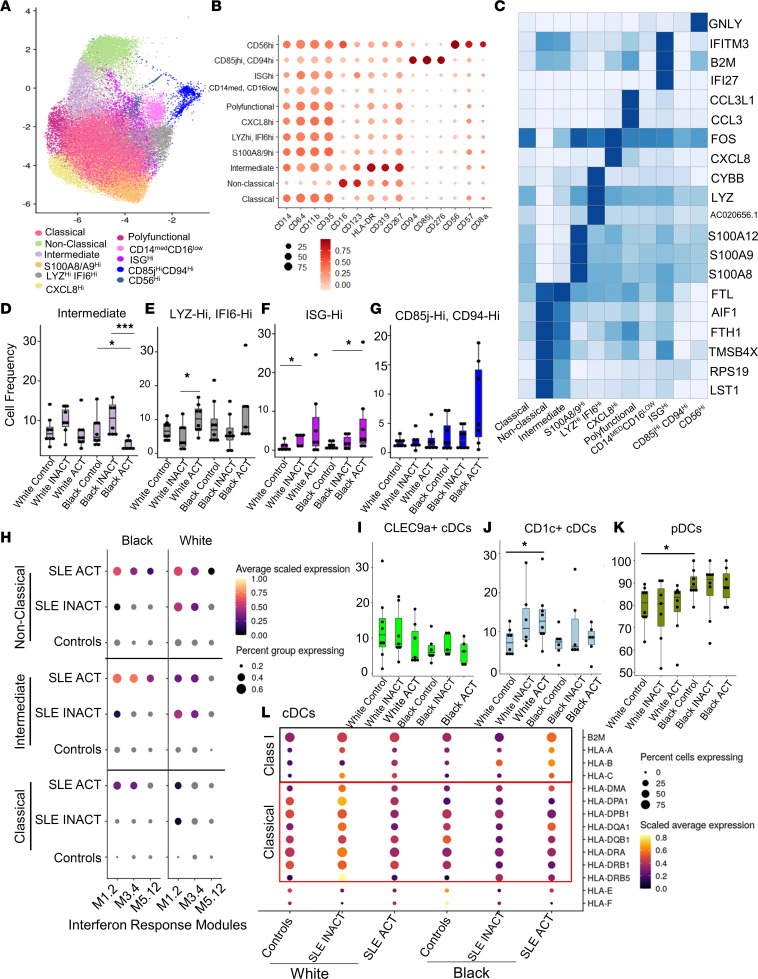
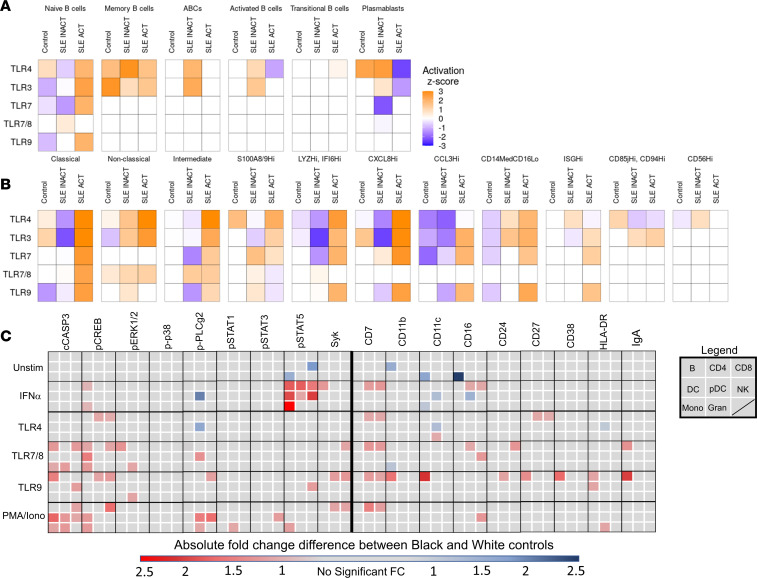
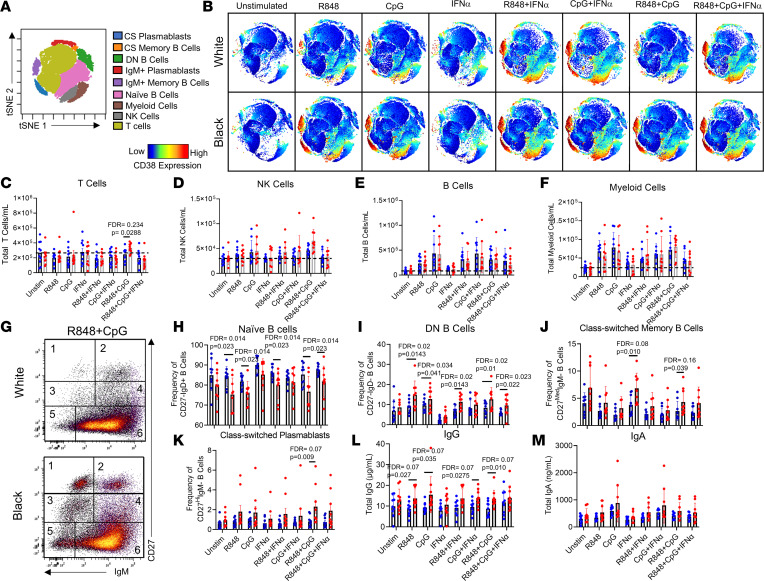
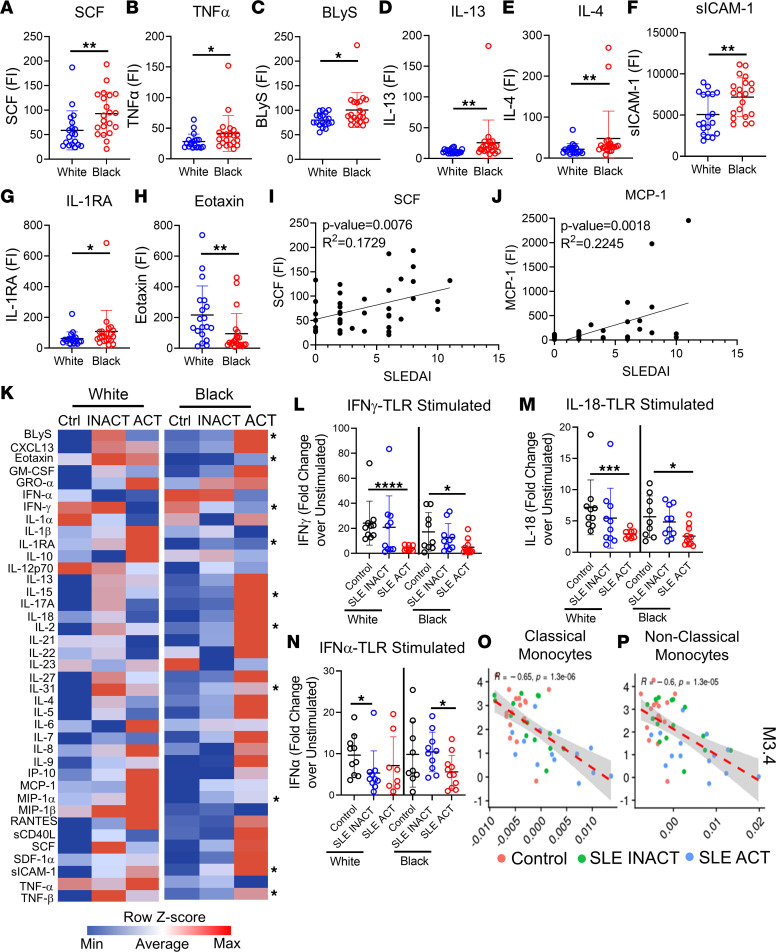
Systemic lupus erythematosus (SLE) affects 1 in 537 Black women, which is >2-fold more than White women. Black patients develop the disease at a younger age, have more severe symptoms, and have a greater chance of early mortality. We used a multiomics approach to uncover ancestry-associated immune alterations in patients with SLE and healthy controls that may contribute biologically to disease disparities. Cell composition, signaling, epigenetics, and proteomics were evaluated by mass cytometry; droplet-based single-cell transcriptomics and proteomics; and bead-based multiplex soluble mediator levels in plasma. We observed altered whole blood frequencies and enhanced activity in CD8+ T cells, B cells, monocytes, and DCs in Black patients with more active disease. Epigenetic modifications in CD8+ T cells (H3K27ac) could distinguish disease activity level in Black patients and differentiate Black from White patient samples. TLR3/4/7/8/9-related gene expression was elevated in immune cells from Black patients with SLE, and TLR7/8/9 and IFN-α phospho-signaling and cytokine responses were heightened even in immune cells from healthy Black control patients compared with White individuals. TLR stimulation of healthy immune cells recapitulated the ancestry-associated SLE immunophenotypes. This multiomic resource defines ancestry-associated immune phenotypes that differ between Black and White patients with SLE, which may influence the course and severity of SLE and other diseases.

Keywords: Autoimmunity; Cytokines; Immunology; Lupus; Signal transduction.


Figures

Figure 1
Figure 1. Overview of analysis workflow to catalog ancestry-associated differences in immune phenotypes.
A discovery cohort was used for a multiomic systems immunology analysis. Significant results were independently validated either by reusing publicly available data sets or by splitting individuals into 2 matched groups for replication (bold). First, 58 samples, including healthy controls, SLE INACT, and SLE ACT, who self-reported as White or Black, were matched by age, ancestry, and sex. (A) Whole blood was collected, left unstimulated or stimulated, and used for immunophenotyping by mass cytometry and signaling analysis by phospho-CyTOF. Similar data from an independently collected and analyzed set of samples, a larger combined analysis of 33 participants, were used to increase the power. (B) Plasma and supernatants collected after overnight stimulation of whole blood were used to assess 39 different soluble mediators using multiplex bead-based assays and ELISAs. (C) PBMCs were used for droplet-based scRNA-Seq and EpiTOF. For single-cell transcriptomics, PBMCs were washed, depleted of red blood cells and T cells using CD2 depletion to enrich for non–T cell populations, and stained with a 51-plex CITE-Seq panel for dual transcript and protein expression using the 10x Genomics 3′ single-cell droplet methods. These variables were utilized to delineate specific cell lineages, activation, and regulatory markers. (D) PBMCs from healthy controls with no autoimmune disease manifestations who self-reported as White or Black were stimulated for 7 days with IFN-α, TLR7/8, or TLR9 agonists, alone or in combination, to assess immune composition and antibody production by flow cytometry and ELISA, respectively. ANA, antinuclear antibody; CCP, cyclic citrullinated peptide; CSQ, connective tissue screening questionnaire; EpiTOF, CyTOF immune phenotyping with epigenetics; scRNA-Seq, sincle-cell RNA sequencing; MCP-1, monocyte chemoattractant protein-1; PHA, phytohemagglutinin; p-STAT, phosphorylated STAT; RF, rheumatoid factor; SCF, stem cell factor.
Figure 2
Figure 2. Cell type composition of whole blood from White and Black healthy controls and SLE patients with active and inactive disease.
(A) The frequencies of major cell lineages in healthy controls, SLE inactive (INACT) patients, and SLE active (ACT) patients, as determined by mass cytometry (n = 91). (B and C) tSNE marker expression plots of CD38 expression on pDCs (B) and CD27 expression on T cells (C). The mean metal intensity (MMI) of (D) CD27 on CD8+ T cells and CD38 on (E) CD8+ T cells and (F) DN T cells was assessed from mass cytometry data via Cytobank. The frequency of (G) CD38+ granulocytes determined by biaxial gating and (H) expression of CD38 are shown on granulocytes by disease. Marker values are displayed on a color scale ranging from blue (lowest levels) through yellow (medium levels) to red (highest marker expression). All tSNE plots were derived from cumulative data from 8–11 individuals per group. For all plots, statistical significance was determined using the Kruskal-Wallis test with Benjamini-Hochberg correction for multiple comparison correction, and mean ± SD is shown. pDCs, plasmacytoid DCs.
Figure 3
Figure 3. Changes in the CD8+ T cell epigenetic landscape distinguish Black from White patients and correlate with higher disease activity.
PBMCs (n = 53) were used to assess global differences in 40 chromatin modifications in 19 immune cell subsets. (A) Average chromatin marker changes for 1 biological replicate comparing overall changes in cell subsets of patients with SLE versus controls. Heatmap depicts increased levels in red, no change in yellow, and decreased levels in blue. (B) Scatterplot depicting the effect size comparisons of chromatin marks in CD8+ T cells between Black and White patients between 2 biological replicates. Each dot represents the average levels of a chromatin marker. Correlation coefficient and the associated P value are shown. (C and D) Normalized chromatin marker levels of White and Black healthy controls and patients with SLE for (C) H3K18ac and (D) H3K27ac in CD8+ T cells. (E) Receiver operating characteristic (ROC) curves depicting the segregation of CD8+ T cells from Black patients and from White patients using the variance in Mark 4. Curves summarizing the results from both biological replicates are shown, with area under ROC percentages from independent replicates separately listed. Classification specificity (x axis) and sensitivity (y axis) are shown for the ROC curve. (F) Normalized H3K27ac levels in CD8+ T cells from patients with SLE INACT and SLE ACT. Mean ± SD is shown. Wilcoxon’s rank-sum test was used to determine statistical significance, and P values corrected for multiple hypotheses using FDR.
Figure 4
Figure 4. Alterations in the genomic landscape of patients with SLE ACT reveal greater IgG levels in Black patients.
PBMCs from 46 controls and patients with SLE were CD2-depleted, followed by droplet-based scRNA-Seq using 10x Genomics. (A) UMAP plot representing the 6 B cell clusters across all samples. The putative identity of each cluster was assigned using gene expression and protein expression from CITE-Seq. (B) Dot plot representing expression values of selected proteins assessed by CITE-Seq and (C) heatmap representing gene expression values of selected genes across each cluster used for cluster annotation. Dot size represents the percentage of cells expressing the marker of interest. Color intensity indicates the mean expression within expressing cells. (DI) Box plots comparing the proportion (mean ± SD) of each cell type cluster across the disease groups and ancestries for (D) naive B cells, (E) age-associated B cells (ABCs), (F) activated B cells, (G) plasmablasts, (H) transitional B cells, and (I) memory B cells as defined by scRNA-Seq. Box plots show the interquartile range (box), median (line), and minimum and maximum (whiskers). Ingenuity Pathway Analysis (IPA; QIAGEN) of differentially expressed genes identified differences in (J) differentiation of B cells and (K) transmigration genes of naive B cells between patients with SLE and controls. Heatmaps shows scaled mean expression of genes in each pathway. (LN) The percentages of B cells with high gene expression of class-switched IgA, IgE, IgG, or IgM are shown by B cell subset in (L) ABCs, (M) activated B cells, and (N) plasma cells. P values were calculated using pairwise Wilcoxon’s rank-sum tests between disease groups with Benjamini-Hochberg correction for multiple comparisons. *P < 0.05, and **P < 0.01.
Figure 5
Figure 5. Monocyte ISGhi transcriptional subsets are increased in patients with SLE ACT.
PBMCs from 46 controls and patients with SLE were CD2-depleted, and droplet-based scRNA-Seq was performed using a 10x Genomics platform. (A) UMAP plot representing the 11 clusters of monocytes. The putative identity of each cluster was assigned using gene expression and protein expression from CITE-Seq. (B) Dot plot representing expression values of selected proteins assessed by CITE-Seq and (C) heatmap representing gene expression values of selected genes across each cluster used for cluster annotation. Dot size represents the percentage of cells expressing the marker of interest. Color intensity indicates the mean expression within expressing cells. (DG) Box plots comparing the proportion of each cluster (mean ± SD) across the disease groups for (D) intermediate, (E) LYZhiIFI6hi, (F) ISGhi, and (G) CD85jhiCD94hi monocytes. Box plots show the interquartile range (box), median (line), and minimum and maximum (whiskers). (H) Gene expression for specific IFN response modules is shown using a dot plot for nonclassical, intermediate, and classical monocytes by disease group. Dot plots compare the proportion of the 3 different DC populations (mean ± SD) identified by UMAP, (I) CLEC9a+ cDC1s, (J) CD1c+ cDC2s, and (K) pDCs. (L) cDC gene expression of HLA antigen presentation components is shown via dot plot by disease group. HLA class I markers are boxed in black, and HLA class II markers are boxed in red. P values were calculated using pairwise Wilcoxon’s rank-sum tests between disease groups with Benjamini-Hochberg correction for multiple comparisons. *P < 0.05, **P < 0.01, and ***P < 0.001. ISG, IFN-stimulated gene.
Figure 6
Figure 6. TLR activation pathways are elevated with disease activity in Black patients.
Differentially expressed genes between Black and White samples identified by scRNA-Seq (n = 46) of (A) B cells and (B) monocyte cell clusters were assessed by IPA to determine ancestral differences in the activity of TLR pathways by activation z scores. Orange indicates increased TLR pathway activity in Black patients, white indicates no difference, and blue indicates increased TLR activity in White patients. (C) Peripheral whole blood (n = 56) from controls and patients with SLE was stimulated for 4 or 15 minutes with IFN-α and PMA/ionomycin or TLR4, TLR7/8, or TLR9 agonists. The median 95th percentile was used to calculate the fold-change of phospho-signaling and activation markers in Black versus White controls in 8 cell populations (see legend: B cells, CD4+ T cells, CD8+ T cells, DCs, pDCs, NK cells, monocytes [Mono], and granulocytes [Gran]). Statistical significance was determined using a Mann-Whitney U test and FDR P < 0.05, and significant changes are noted by a blue box (decrease) or a red box (increase).
Figure 7
Figure 7. TLR stimulation of healthy Black and White immune cells recapitulates ancestry-associated SLE immunophenotypes.
One million PBMCs from 10 White and 10 Black healthy controls, devoid of any autoimmune characteristics (ANA, RF, CCP3 antibody negative, and negative CSQ), were stimulated with R848 (TLR7/8 agonist), CpG (TLR9 agonist), or IFN-α alone or in combination for 7 days and analyzed by flow cytometry. (A) tSNE plots identified 9 different immune cell populations across samples. (B) Representative tSNE plots of healthy White and Black cells following the 9 different stimulation conditions. CD38 expression is shown from red (high expression) to blue (low expression). Cells were counted in culture following 7-day stimulation, and total cell subset numbers were back-calculated using cell frequencies. The total (mean ± SD) (C) T cells, (D) NK cells, (E) B cells, and (F) myeloid cells/mL are shown for the 8 different stimulations by ancestry. (G) B cells were further subdivided by biaxial gating on IgM and CD27 to assess 6 different B cell subsets: 1) class-switched plasmablasts, 2) IgM+ plasmablasts, 3) class-switched memory B cells, 4) IgM+ memory B cells, 5) DN B cells, and 6) naive B cells. The frequency (mean ± SD) of (H) naive B cells, (I) DN B cells, (J) class-switched memory B cells, and (K) class-switched plasmablasts is shown for each condition. Supernatants were collected and assessed via ELISA for (L) total IgG concentrations and (M) IgA concentrations. Statistical significance was determined using a Mann-Whitney U test (P < 0.05), and all FDR q values were used for multiple comparisons.
Figure 8
Figure 8. Pro-inflammatory cytokines vary in patients with SLE by ancestry and shape the TLR immune response.
Pro-inflammatory soluble mediators were measured by multiplex or ELISA. Significant cytokine differences between Black (n = 21) and White (n = 19) SLE patients included increased (A) SCF, (B) TNF-α, (C) BLyS, (D) IL-13, (E) IL-4, (F) sICAM-1, and (G) IL-1RA in Black patients and increased (H) eotaxin in White patients. Linear regression analyses show (I) SCF and (J) MCP-1 to increase with SLE disease activity (SLEDAI) (n = 40). (K) A heatmap summary of the MFI supernatant levels following 24-hour whole blood stimulation with TLR4/7/8/9 agonists for each disease group is shown. Soluble mediator levels are displayed on a color scale ranging from blue (protein levels below the mean) to red (protein levels greater than the mean) using a column z score. Significant differences between Black and White disease groups are noted. The most significant fold-change differences over unstimulated culture samples were in the IFN pathways, including (L) IFN-γ, (M) IL-18, and (N) IFN-α. TLR-stimulated culture supernatant levels of IFN-γ negatively associated with mean ISG gene expression modules in (O) classical and (P) nonclassical monocytes by linear regression analysis. Statistical significance was determined using a Mann-Whitney U test (P < 0.05), and all FDR q values were used for multiple comparisons. Mean ± SD is shown. *P < 0.05, **P < 0.01, ***P < 0.001, ****P < 0.0001. FI, fluorescence intensity.

References

    1. Gergianaki I, et al. Update on the epidemiology, risk factors, and disease outcomes of systemic lupus erythematosus. Best Pract Res Clin Rheumatol. 2018;32(2):188–205. doi: 10.1016/j.berh.2018.09.004. - DOI - PubMed
    1. Lewis MJ, Jawad AS. The effect of ethnicity and genetic ancestry on the epidemiology, clinical features and outcome of systemic lupus erythematosus. Rheumatology (Oxford) 2017;56(suppl 1):67–i77. - PubMed
    1. Stojan G, Petri M. Epidemiology of systemic lupus erythematosus: an update. Curr Opin Rheumatol. 2018;30(2):144–150. doi: 10.1097/BOR.0000000000000480. - DOI - PMC - PubMed
    1. Yen EY, Singh RR. Brief report: lupus-an unrecognized leading cause of death in young females: a population-based study using nationwide death certificates, 2000-2015. Arthritis Rheumatol. 2018;70(8):1251–1255. doi: 10.1002/art.40512. - DOI - PMC - PubMed
    1. Alarcon GS, et al. Systemic lupus erythematosus in three ethnic groups: II. Features predictive of disease activity early in its course. LUMINA Study Group. Lupus in minority populations, nature versus nurture. Arthritis Rheum. 1998;41(7):1173–1180. doi: 10.1002/1529-0131(199807)41:7<1173::AID-ART5>3.0.CO;2-A. - DOI - PubMed

Publication types