. 2023 Nov 22;193(4):2480-2497.
doi: 10.1093/plphys/kiad465.

Changes in cell wall composition due to a pectin biosynthesis enzyme GAUT10 impact root growth

Affiliations

Changes in cell wall composition due to a pectin biosynthesis enzyme GAUT10 impact root growth

Linkan Dash et al. Plant Physiol. .

Abstract

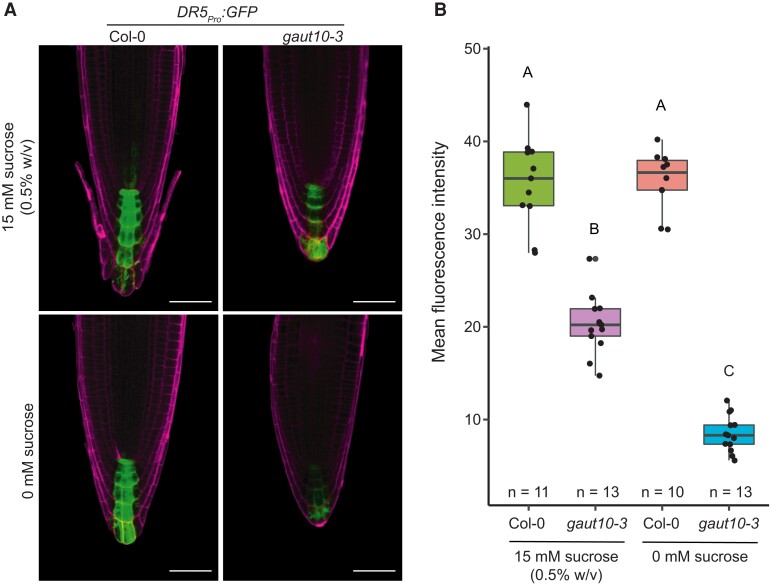
Arabidopsis (Arabidopsis thaliana) root development is regulated by multiple dynamic growth cues that require central metabolism pathways such as β-oxidation and auxin. Loss of the pectin biosynthesizing enzyme GALACTURONOSYLTRANSFERASE 10 (GAUT10) leads to a short-root phenotype under sucrose-limited conditions. The present study focused on determining the specific contributions of GAUT10 to pectin composition in primary roots and the underlying defects associated with gaut10 roots. Using live-cell microscopy, we determined reduced root growth in gaut10 is due to a reduction in both root apical meristem size and epidermal cell elongation. In addition, GAUT10 was required for normal pectin and hemicellulose composition in primary Arabidopsis roots. Specifically, loss of GAUT10 led to a reduction in galacturonic acid and xylose in root cell walls and altered the presence of rhamnogalacturonan-I (RG-I) and homogalacturonan (HG) polymers in the root. Transcriptomic analysis of gaut10 roots compared to wild type uncovered hundreds of genes differentially expressed in the mutant, including genes related to auxin metabolism and peroxisome function. Consistent with these results, both auxin signaling and metabolism were modified in gaut10 roots. The sucrose-dependent short-root phenotype in gaut10 was linked to β-oxidation based on hypersensitivity to indole-3-butyric acid (IBA) and an epistatic interaction with TRANSPORTER OF IBA1 (TOB1). Altogether, these data support a growing body of evidence suggesting that pectin composition may influence auxin pathways and peroxisome activity.


Conflict of interest statement

Conflict of interest statement. None declared.

Figures

Figure 1.
Figure 1.
Primary root length is shorter in gaut10-3 compared to Col-0 grown in 0 and 15 mm sucrose; supplementing the growth medium with 30 mm sucrose rescues the root length phenotype. A) Five-day-old gaut10-3 and Col-0 whole seedlings grown on 0.5× MS supplemented with 3 different sucrose concentrations: 0, 15, and 30 mm. Images were digitally extracted for comparison with all scale bars = 0.5 cm. B) Violin plots of quantified root phenotypes in Col-0 and gaut10-3. Boxplots within the violin shapes represent the 5 number summaries, where the center line is the median, box limits are the upper and lower quartiles, whiskers are 1.5× interquartile range, and points are outliers. Statistical analysis was performed using a 1-way ANOVA followed by Tukey's post hoc analysis with a P < 0.05 to assign letters (A, B, and C) to each genotype/treatment that indicates statistical significance. “n” represents the number of biological replicates quantified. Sucrose concentrations are displayed as both a percentage (weight/volume) and molarity (mm).
Figure 2.
Figure 2.
The short phenotype of gaut10-3 roots is due to a smaller RAM and reduced cell elongation. Images were digitally extracted for comparison. The confocal images (20× magnification) in A, B) and C, D) show the root DZ and the root MZ of 5-d-old gaut10-3 and Col-0 seedlings, respectively, with all scale bars showing 20 μm length; the dotted double head arrows in A, B) represent the difference in the length of earliest trichoblast cells at the root DZ, and the dotted lines in C, D) demark the length of the root apical and basal meristems in gaut10-3 and Col-0 representative figures. Images are digitally extracted for comparison with all scale bars = 20 μm. Phenotypic differences observed in gaut10-3 as compared to Col-0 are quantified as box and whisker plots overlayed with scatter plots showing differences in the lengths G, H) and the number of cortical cells E, F) spanning the apical and the RBM. The meristem lengths are measured on a micrometer (μm) scale. For all phenotypic quantifications pertaining to root meristem E to I), 6 individual seedlings (biological replicates) from each genotype (Col-0 and gaut10-3) were used. In I), the average cell lengths of 6 to 10 early differentiating trichoblast cells (technical replicates) from 6 independent roots were quantified. Boxplots E to I) represent the 5 number summaries, where the center line is the median, box limits are the upper and lower quartiles, whiskers are 1.5× interquartile range, and points are outliers. The calculated P-values E to I) are from a nonparametric Wilcoxon rank-sum test used to test the statistical significance of phenotypic differences observed between the 2 genotypes. J) A cartoon schematic summarizing the short-root phenotype in gaut10 roots compared to Col-0, which is due to a smaller RAM (double-ended arrow) and shorter epidermal cells (arrows in the epidermal cells). RAM, root apical meristem; RBM, root basal meristem; MZ, meristematic zone; DZ, differentiation zone.
Figure 3.
Figure 3.
Root cell marker lines are altered in gaut10-3. Confocal images of Col-0 and gaut10-3 5-d-old primary roots grown in the presence of 15 mm sucrose (+suc) and absence of sucrose (−suc). A)SCR:GFP, which marks the endodermis. B)WOX5:GFP, which marks the quiescent center. C)PET111:GFP, which marks the columella. D)702LRC:GFP, which marks the lateral root cap. E)WER:GFP, which marks the lateral root cap. Scale bars = 20 µm. Images were digitally extracted for comparison.
Figure 4.
Figure 4.
Cell wall polysaccharide composition is altered in gaut10-3 roots. A, B) Concentrations of root cell wall monosaccharides are shown as mole fraction × 100 = mole percentage (Mol%) in the pectin- A) and the hemicellulose- B) enriched fractions from 3 biological replicates per genotype. The error bars show the Se of the mean (SEM). Statistical analysis was performed using a 2-sample nonparametric Wilcoxon rank-sum test; an asterisk indicates P ≤ 0.1. C) A 4D dot plot that shows differential binding of cell wall polysaccharide-specific antibodies in root cell wall extracts collected across 3 biological replicates from gaut10-3 and Col-0 measured by ELISA. The shape annotations show clades of the cell wall–binding antibodies (as defined in Pattathil et al. 2010) whereas the x axis indicates the corresponding cell wall fraction origin (i.e. pectin or hemicellulose). The size of the dots represents the log2 fold change (gaut10-3/Col-0) value calculated using the ELISA absorbance values. Significantly enriched/reduced polysaccharides (23 in total) with their binding epitopes are indicated according to Pattathil et al. (2010) annotations. Statistical significance is determined by a 2-sample nonparametric Wilcoxon rank-sum test with P ≤ 0.1. Antibody names and their binding cell wall epitope structures are annotated for each row. HG, homogalacturonan; RG-I, rhamnogalacturonan-I.
Figure 5.
Figure 5.
Transcriptomic analysis of 5-d-old gaut10-3 and Col-0 roots across 3 biological replicates. A) Volcano plot showing DEGs with an adjusted Padj. value (false discovery rate) threshold of 0.05, with log2 fold change on the x axis and −log10(adjusted Padj. value) on the y axis. The upregulated genes (109) and downregulated genes (176) are above the dashed line; transcripts that are not significantly changed are below the dashed line. B) Expression values for notable key marker genes are shown in the bar plot with log2 fold change on the y axis and gene abbreviations on the x axis: YDK1, EXT18, CMI1, AUXIN-INDUCED IN ROOT CULTURES 1 (AIR1), NIT1, AXR3, and MYB34. C) The top GO terms for biological processes enriched by the DE transcripts in gaut10-3 compared to Col-0 are shown in a 4D graph, where the size and color of the puncta show the number of DEGs/proteins enriched within each GO term and their statistical significance, respectively.
Figure 6.
Figure 6.
Auxin signaling defects in gaut10-3 roots compared to wild type. A) Representative 20× confocal images of DR5:GFP expression in 5-d-old Col-0 and gaut10-3 roots grown on 0 and 15 mm sucrose. Scale bars = 20 µm. Images were digitally extracted for comparison. B) Mean fluorescence intensity (MFI) quantified for each genotype/treatment in y axis. Boxplots represent the 5 number summaries, where the center line is the median, box limits are upper and lower quartiles, whiskers are 1.5× interquartile range, and points are outliers. Statistical analysis was a 1-way ANOVA followed by Tukey's post hoc analysis with a P < 0.05 to assign letters (A, B, and C) to each genotype/treatment to indicate statistical significance. “n” represents the number of biological replicates used for averaging.
Figure 7.
Figure 7.
Auxin metabolism is altered in gaut10-3 roots compared to wild type. Metabolite quantification by LC–MS/MS visualized by box and whisker plots for with the corresponding P-value (P) indicated for each metabolite across 5 biological replicates per genotype. For all metabolites quantified, a 2-sample nonparametric Wilcoxon rank-sum test followed by Benjamini–Hochberg correction for multiple testing was performed to identify significantly altered metabolites with P ≤ 0.1. A) ANT. B) TRP. C) IAN. D) IAA–Asp. E) IAA–Glu. F) IAA–Glc. G) oxIAA–Glc. Boxplots A to G) represent the 5 number summaries, where the center line is the median, box limits are the upper and lower quartiles, whiskers are 1.5× interquartile range, and the points are outliers. H) Summary model figure showing annotated auxin biosynthesis pathways. Reduced metabolites are indicated in gaut10-3 roots in red text; likewise, pathway enzymes shown in red are downregulated, whereas the genes in blue text show increased transcript levels. The solid arrows indicate pathways that have known enzymes, genes, and intermediates, while dashed arrows indicate pathways that are not well defined.
Figure 8.
Figure 8.
Genetic interaction between gaut10 and tob1. A, E, I) Wild-type Col-0 roots grown under 0.5% sucrose (mock), 0.5% sucrose + 10 mm IBA, or 0.5% sucrose + 10 mm IAA. B, F, J)gaut10-3 roots grown under 0.5% sucrose (mock), 0.5% sucrose + 10 mm IBA, or 0.5% sucrose + 10 mm IAA. C, G, K)tob1-3 roots grown under 0.5% sucrose (mock), 0.5% sucrose + 10 mm IBA, or 0.5% sucrose + 10 mm IAA. D, H, L)gaut10-3 tob1-3 roots grown under 0.5% sucrose (mock), 0.5% sucrose + 10 mm IBA, or 0.5% sucrose + 10 mm IAA. Images in A to L) were digitally extracted for comparison with all scale bars = 0.5 cm. M) Quantification of primary root length of Col-0, gaut10-3, tob1-3, and gaut10-3 tob1-3. Boxplots represent the 5 number summaries, where the center line is the median, box limits are the upper and lower quartiles, whiskers are 1.5× interquartile range, and points are outliers. N) IBA and IAA responses in Col-0, gaut10-3, tob1-3, and gaut10-3 tob1-3. All statistical analysis was a 1-way ANOVA followed by Tukey's post hoc analysis with a P < 0.1 to assign letters (A, B, and C) to each genotype/treatment to indicate statistical significance. “n” represents the number of biological replicates used for averaging in all cases. The error bars represent the Se.
Figure 9.
Figure 9.
Working model for roles of GAUT10 in root morphogenesis. A) In wild-type Col-0 roots, normal cell wall composition leads to correct RAM size and DR5:GFP maxima in the QC and columella. B) In the absence of GAUT10, pectin composition is altered leading to reduced cell expansion and DR5:GFP expression. C) A molecular framework for GAUT10 function based on biochemical and genetic analyses of gaut10-3 roots. IAA represses GAUT10 protein accumulation, which is a positive regulator of pectin and hemicellulose formation in roots. GAUT10-dependent cell wall composition is required for primary root morphogenesis and for auxin metabolism.

References

    1. Baluska F, Volkmann D, Barlow PW. Specialized zones of development in roots: view from the cellular level. Plant Physiol. 1996:112(1):3–4. 10.1104/pp.112.1.3 - DOI - PMC - PubMed
    1. Bargmann BOR, Vanneste S, Krouk G, Nawy T, Efroni I, Shani E, Choe G, Friml J, Bergmann DC, Estelle M, et al. A map of cell type-specific auxin responses. Mol Syst Biol. 2013:9(1):688. 10.1038/msb.2013.40 - DOI - PMC - PubMed
    1. Bartel B, Fink GR. Differential regulation of an auxin-producing nitrilase gene family in Arabidopsis thaliana. Proc Natl Acad Sci USA. 1994:91(14):6649–6653. 10.1073/pnas.91.14.6649 - DOI - PMC - PubMed
    1. Bartling D, Seedorf M, Mithofer A, Weiler EW. Cloning and expression of an Arabidopsis nitrilase which can convert indole-3-acetonitrile to the plant hormone, indole-3-acetic acid. Eur J Biochem. 1992:205(1):417–424. 10.1111/j.1432-1033.1992.tb16795.x - DOI - PubMed
    1. Bartling D, Seedorf M, Schmidt RC, Weiler EW. Molecular characterization of two cloned nitrilases from Arabidopsis thaliana: key enzymes in biosynthesis of the plant hormone indole-3-acetic acid. Proc Natl Acad Sci USA. 1994:91(13):6021–6025. 10.1073/pnas.91.13.6021 - DOI - PMC - PubMed

MeSH terms