. 2023 Aug;12(8):e12359.
doi: 10.1002/jev2.12359.

Clathrin light chain A-enriched small extracellular vesicles remodel microvascular niche to induce hepatocellular carcinoma metastasis

Affiliations

Clathrin light chain A-enriched small extracellular vesicles remodel microvascular niche to induce hepatocellular carcinoma metastasis

Yi Xu et al. J Extracell Vesicles. 2023 Aug.

Abstract

Small extracellular vesicles (sEVs) play a key role in exchanging cargoes between cells in tumour microenvironment. This study aimed to elucidate the functions and mechanisms of hepatocellular carcinoma (HCC) derived sEV-clathrin light chain A (CLTA) in remodelling microvascular niche. CLTA level in the circulating sEVs of HCC patients was analysed by enzyme-linked immunosorbent assay (ELISA). The functions of sEV-CLTA in affecting HCC cancerous properties were examined by multiple functional assays. Mass spectrometry was used to identify downstream effectors of sEV-CLTA in human umbilical vein endothelial cells (HUVECs). Tube formation, sprouting, trans-endothelial invasion and vascular leakiness assays were performed to determine the functions of sEV-CLTA and its effector, basigin (BSG) in HUVECs. BSG inhibitor, SP-8356, was tested in a mouse model of patient-derived xenografts (PDXs). Circulating sEVs of HCC patients had markedly enhanced CLTA levels than control individuals and were reduced in patients after surgery. HCC derived sEV-CLTA enhanced HCC cancerous properties, disrupted endothelial integrity and induced angiogenesis. Mechanistically, CLTA remodels microvascular niche by stabilizing and upregulating BSG. Last, SP-8356 alone or in combination with sorafenib attenuated PDXs growth. The study reveals the role of HCC derived sEV-CLTA in microvascular niche formation. Inhibition of CLTA and its mediated pathway may illuminate a new therapeutic strategy for HCC patients.

Keywords: clathrin light chain A; hepatocellular carcinoma; intercellular communication; premetastatic niche; small extracellular vesicles; vascular permeability.


Conflict of interest statement

The authors have declared that no conflict of interest exists.

Figures

FIGURE 1
FIGURE 1
CLTA is overexpressed in sEVs of HCC. (a) Venn diagram showing the increased expression of mRNAs related to vascular invasion, worse overall survival, and CD63 expression in HCC. (b) The distant metastasis prediction potential of 12 candidates and their existence in cancerous sEVs. (c) Analysis of CLTA, positive sEVs markers (Alix, CD63, and CD9) and negative sEVs markers (GM130 and p62) expression in 20 μg of total cell lysates (TCL) and 10 μg of sEVs by western blot analysis. (d) Level of CLTA in circulating sEVs from control individuals (Normal, n = 23) and patients with HBV (HBV, n = 20), HBV‐related cirrhosis (Cirrhosis, n = 8), early‐stage HCC (I‐II, n = 40) or late‐stage HCC (III‐IV, n = 23) was determined by ELISA. (e) The CLTA level in circulating sEVs from HCC patients before and after surgery was measured (n = 19). Data are presented as the mean ± SEM. *p < 0.05; **p < 0.01; ***p < 0.001. NS, not significant.
FIGURE 2
FIGURE 2
HCC derived sEV‐CLTA promotes tumour progression in vitro and in vivo. (a) Immunoblotting of CLTA in sEVs derived from vector control (XPack), CLTA overexpressing (XP‐CLTA), non‐target control (CTL‐KD) and CLTA knockdown (CLTA‐KD1 and CLTA‐KD2) clones established in MHCCLM3 (upper) and MHCC97L (bottom) cells. (b) HLE cells treated with the indicated sEVs were evaluated by colony formation, migration and invasion assays. Scale bar, 200 μm. (c) Image of mice subjected to subcutaneous injection of MHCCLM3 CTL‐KD and CLTA‐KD1 cells with PBS or the indicated sEVs (right). The tumour size was measured regularly (left). (d) Images of tumours harvested from mice (left). The weight of the tumours was measured (right). (e) Schematic diagram of the sEV education model. (f) Bioluminescence imaging of animals at the end of the experiment (left). The intensity of the signals in whole mice imaging (middle). Image of the dissected livers (right). Liver tumours are indicated by dotted lines. (g) Ex vivo bioluminescence imaging of lung tissues (left). The intensity of the lung signal (middle). H&E staining of lung tissues (right). Tumour nodules are indicated by arrowheads. Scale bar, 200 μm. (h) Schematic diagram of the experimental lung metastasis assay. (i) Bioluminescence imaging of animals at the end of the experiment (left‐upper). H&E staining of lung tissues (left‐bottom). Tumour nodules are indicated by arrowheads. Scale bar, 200 μm. The intensity of the lung signal. (right). Data are presented as the mean ± SEM. *p < 0.05; **p < 0.01; ***p < 0.001. NS, not significant.
FIGURE 3
FIGURE 3
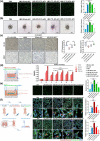
CLTA‐enriched sEVs induce angiogenesis, disrupt vascular endothelial barrier integrity and enhance pulmonary vessel leakage. HUVECs treated with the indicated sEVs were subjected to tube formation (a) and spheroid‐based sprouting (b) assays. The number of tubes and lengths of the sprouts were analysed. Scale bar, 50 μm (a); 200 μm (b). (c) Immunohistochemistry of CLTA and CD31 in subcutaneous tumours derived from MHCCLM3 CTL‐KD and CLTA‐KD1 cells injected with the indicated sEVs. Scale bar, 200 μm. (d) Schematic diagram of the TMR‐dextran leakiness assay (left). The amount of TMR‐dextran in the lower chamber was determined (right). (e) Schematic diagram of the trans‐endothelial invasion experiment (left). The number of MitoTracker‐stained HLE cells that passed through the HUVEC monolayer was determined (right). Scale bar, 50 μm. (f) Schematic diagram of the pulmonary vessel leakiness assay (left). The areas with Texas‐Red dextran were analysed (right). Arrowheads indicate diffused dextran. Scale bar, 50 μm. Data are presented as the mean ± SEM. *p < 0.05; **p < 0.01; ***p < 0.001.
FIGURE 4
FIGURE 4
sEV‐CLTA upregulates and stabilizes BSG in endothelial cells. (a) HUVECs treated with CTL‐KD‐sEVs and CLTA‐KD1‐sEVs were subjected to mass spectrometry (left). Volcano plots show the differentially expressed proteins. Proteins that were modulated by at least 2‐fold and with significance are coloured. A similar analysis was performed on HUVECs treated with XPack‐sEVs and XP‐CLTA‐sEVs (right). (b) GO enrichment analysis was performed by DAVID in terms of biological process and cellular components. (c) Immunoblotting of BSG in HUVECs treated with the indicated sEVs. (d) Immunoblotting of BSG in CHX‐ and sEV‐treated HUVECs (left). The band intensity of BSG normalized to that of β‐actin was plotted (right). (e) Coimmunoprecipitation was performed on HUVECs using anti‐IgG or anti‐CLTA antibodies, followed by immunoblotting. (f) Immunofluorescence of CLTA (green) and BSG (red) in HUVECs treated with XPack‐sEV and XP‐CLTA‐sEV (left). Signals of CLTA (middle) and BSG (right) were determined. Scale bar, 20 μm. Data are presented as the mean ± SEM. *p < 0.05; **p < 0.01; ***p < 0.001.
FIGURE 5
FIGURE 5
HCC‐derived sEV‐CLTA remodels the tumour microvascular niche through BSG. (a) HUVECs treated with XPack‐sEV and XP‐CLTA‐sEV in the presence of vehicle or SP‐8356 were subjected to tube formation (left‐upper) and spheroid‐based sprouting (left‐bottom) assays. The number of tubes and length of sprouts were analysed (right). Scale bar, 200 μm. (b) A TMR‐dextran leakiness assay was performed on HUVECs treated with XPack‐sEV and XP‐CLTA‐sEV in the presence of vehicle or SP‐8356. The amount of TMR‐dextran in the lower chamber was determined. (c) Trans‐endothelial invasion determined the number of MitoTracker‐stained HLE cells that passed through HUVECs treated with the indicated sEVs with or without SP‐8356. Scale bar, 50 μm. A pulmonary vessel leakiness assay was performed in mice injected with Texas‐Red dextran, Alexa Fluor 488 concanavalin A, MHCCLM3‐derived sEVs (d) or MHCC97L‐derived sEVs (e) and SP‐8356. Arrowheads indicate diffused dextran (left). Scale bar, 50 μm. Areas with Texas‐Red dextran were analysed (right). Data are presented as the mean ± SEM. *p < 0.05; **p < 0.01; ***p < 0.001. NS, not significant.
FIGURE 6
FIGURE 6
SP‐8356 reverses the tumour progression promoting effect caused by sEV‐CLTA. (a) Schematic diagram of the treatment regimen applied to mice subcutaneously coinjected with MHCC97L and the indicated sEVs. (b) Image of mice at the end of the experiment. Subcutaneous tumours are indicated by arrows. (c) Tumour size was measured regularly and plotted. (d) Tumours harvested from mice (left). The volume (middle) and weight (right) of tumours were analysed. (e) Immunohistochemistry of CLTA and CD31 in dissected tumours (left). Scale bar, 200 μm. The intensities of CLTA (middle) and microvessels (right) were quantified. (f) Bioluminescence imaging of animals at the end of the lung metastasis assay (left). The intensity of the lung signal. (right). (g) H&E staining of lung tissues. Tumour nodules are indicated by arrowheads. Scale bar, 200 μm. Data are presented as the mean ± SEM. *p < 0.05; **p < 0.01; ***p < 0.001. NS, not significant.
FIGURE 7
FIGURE 7
Blockade of BSG using inhibitor suppresses the development of HCC patient‐derived xenografts. (a) The diagram illustrates the treatment regimen of sorafenib and SP‐8356 administered to mice subcutaneously implanted with PDXs. (b) Image of mice at the end of the experiment (left). Tumour size was measured regularly and plotted (right). (c) The tumours were harvested at the end of the experiment (left). The volume (middle) and weight (right) of the tumours were determined. (d) IHC of Ki67 and CD31 in dissected tumours (left). Scale bar, 200 μm. The intensities of Ki67 (middle) and microvessels (right) were quantified. Data are presented as the mean ± SEM. *p < 0.05; **p < 0.01; ***p < 0.001. NS, not significant.

Similar articles

Cited by

References

    1. Biancospino, M. , Buel, G. R. , Nino, C. A. , Maspero, E. , Scotto di Perrotolo, R. , Raimondi, A. , Redlingshöfer, L. , Weber, J. , Brodsky, F. M. , Walters, K. J. , & Polo, S. (2019). Clathrin light chain A drives selective myosin VI recruitment to clathrin‐coated pits under membrane tension. Nature Communications, 10(1), 4974. - PMC - PubMed
    1. Chen, W. (2015). Cancer statistics: Updated cancer burden in China. Chinese Journal of Cancer Research, 27, 1. - PMC - PubMed
    1. Chen, Y. , Zhang, H. , Gou, X. , Horikawa, Y. , Xing, J. , & Chen, Z. (2009). Upregulation of HAb18G/CD147 in activated human umbilical vein endothelial cells enhances the angiogenesis. Cancer Letters, 278(1), 113–121. - PubMed
    1. Escola, J. M. , Kleijmeer, M. J. , Stoorvogel, W. , Griffith, J. M. , Yoshie, O. , & Geuze, H. J (1998). Selective enrichment of tetraspan proteins on the internal vesicles of multivesicular endosomes and on exosomes secreted by human B‐lymphocytes. Journal of Biological Chemistry, 273(32), 20121–20127. - PubMed
    1. Fong, M. Y. , Zhou, W. , Liu, L. , Alontaga, A. Y. , Chandra, M. , Ashby, J. , Chow, A. , O'Connor, S. T. F. , Li, S. , Chin, A. R. , Somlo, G. , Palomares, M. , Li, Z. , Tremblay, J. R. , Tsuyada, A. , Sun, G. , Reid, M. A. , Wu, X. , Swiderski, P. , … Wang, S. E. (2015). Breast‐cancer‐secreted miR‐122 reprograms glucose metabolism in premetastatic niche to promote metastasis. Nature Cell Biology, 17(2), 183–194. - PMC - PubMed

Publication types