. 2023 Nov 6;220(11):e20230180.
doi: 10.1084/jem.20230180. Epub 2023 Aug 22.

Network analysis identifies strain-dependent response to tau and tau seeding-associated genes

Affiliations

Network analysis identifies strain-dependent response to tau and tau seeding-associated genes

Dominic J Acri et al. J Exp Med. .

Abstract

Previous research demonstrated that genetic heterogeneity is a critical factor in modeling amyloid accumulation and other Alzheimer's disease phenotypes. However, it is unknown what mechanisms underlie these effects of genetic background on modeling tau aggregate-driven pathogenicity. In this study, we induced tau aggregation in wild-derived mice by expressing MAPT. To investigate the effect of genetic background on the action of tau aggregates, we performed RNA sequencing with brains of C57BL/6J, CAST/EiJ, PWK/PhJ, and WSB/EiJ mice (n = 64) and determined core transcriptional signature conserved in all genetic backgrounds and signature unique to wild-derived backgrounds. By measuring tau seeding activity using the cortex, we identified 19 key genes associated with tau seeding and amyloid response. Interestingly, microglial pathways were strongly associated with tau seeding activity in CAST/EiJ and PWK/PhJ backgrounds. Collectively, our study demonstrates that mouse genetic context affects tau-mediated alteration of transcriptome and tau seeding. The gene modules associated with tau seeding provide an important resource to better model tauopathy.


Conflict of interest statement

Disclosures: The authors declare no competing interests exist.

Figures

None
Graphical abstract
Figure 1.
Figure 1.
Variants in wild-derived genetic backgrounds within AMP-AD nominated target genes. Classical inbred mouse model C57BL/6J and three wild-derived mouse genetic backgrounds (CAST, PWK, and WSB). (A) Variants in wild-derived mice were called using gigaMUGA relative to the reference genome (C57BL/6J) and recorded (0: reference call, 1: heterozygous variant, 2: homozygous variant) using the GenCall Algorithm implemented in the Illumina BeadStudio software per manufacturer’s recommendations. Wild-derived mice contain 5,810 variants in the 537 nominated target genes from the AMP-AD consortium (accessed March 1, 2021). (B) Five genotyped variants at the Inpp5d locus (Chr1:87,620,312–87,720,507) demonstrate genetic heterogeneity within a single known AD risk gene.
Figure S1.
Figure S1.
Pilot study to calculate the sample size for the tau seeding assay. (A) Design of a pilot study to determine the sample size. One litter of B6 and WSB mice was injected with AAV-hTauP301L and aged 6 wk. TBS-soluble protein lysate from the cortex of each pup was transfected into tau biosensor cells. 24 h after transfection, cells were trypsanized and FRET+ signal was measured via FACS as a proxy for tau seeding activity. (B) Percent cells with FRET signal were significantly increased in WSB versus B6 in our pilot study (*P < 0.05; nB6 = 6, nWSB = 5; Welch’s t test P = 0.0172). (C) The sample size was calculated based on the standard deviation observed in our pilot study with the criteria of power = 0.8, alpha = 0.05, group = 4, effect size = 20% of average signal, variation = standard deviation. *Sample size determined in the R Stats Package using power.anova.stats(). This analysis indicates that at least eight mice per group are needed to properly power the main study.
Figure 2.
Figure 2.
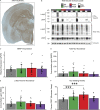
Tau seeding activity is modulated by genetic background independent of tau expression level. (A) Representative image shows a widespread expression of human tau (HT7+ stain) in AAV-hTauP301L–injected mice (scale bar 1 mm). (B) Representative Western blot shows high molecular weight (HMW) and low molecular weight (LMW) bands of total tau (TOMA+) and pTau Thr231 in the cortex of AAV-hTauP301L–injected mice compared to AAV-eGFP–injected controls (n = 2/condition). Quantification of Tau levels across genetic backgrounds was performed using two independent experiments: viral expression of human tau using qPCR and abundance of total tau via Meso Scale Diagnostics Total Tau Kit. (C) Human tau expression was measured using qPCR. Relative hMAPT expression was calculated relative to GAPDH and showed no effect of genetic background via one-way ANOVA (n = 16–20 per group, technical replicates = 2, F3,66 = 0.234, P = 0.87). (D and E) Total tau and pTau Thr231 levels were measured via Meso Scale Diagnostics (MSD; K15121D). There was no effect of genetic background on either total tau via one-way ANOVA (n = 19–21 per group, F3,75 = 1.439, P = 0.238) or pTau231 (n= 19–21 per group, F3,75 = 1.665, P = 0.189). (F) To measure tau seeding activity, an in vitro biosensor assay was performed. HEK-293T cells containing CFP- or YFP-conjugated tau are transfected with brain lysate from hTauP301L-injected mice for 24 h. Biosensor cells are then collected and FRET+ signal is measured via FACS as a proxy for tau seeding activity. Tau seeding activity was significantly affected by genetic backgrounds via one-way ANOVA (n = 19–24 per group, technical replicates =2, F3,78 = 9.237, P = 2.67 × 10⁻⁵). Tukey honest significant difference post-hoc test revealed elevated tau seeding activity in CAST and PWK relative to B6 (***P < 0.001; B6-CAST p_adj = 0.046, B6-PWK p_adj = 1.12 × 10⁻⁴). Source data are available for this figure: SourceData F2.
Figure S2.
Figure S2.
Human tau specific expression in AAV-hTauP301L–injected mice relative to AAV-eGFP–injected controls. (A and B) Representative images show expression of human tau (HT7+ stain) in AAV-hTauP301L–injected mice (A; scale bar 1 mm) compared with AAV-eGFP–injected control (B; scale bar 1 mm).
Figure 3.
Figure 3.
Signature A: Core tau-responsive signature across genetic backgrounds. (A) Experimental design to express tau in B6 and three wild-derived mouse strains. AAV-eGFP or AAV-hTauP301L was injected into mice of each genetic background. At 6 mo, brain tissue was collected and analyzed via mRNA-seq. Reads were aligned to each strain’s respective genomes. Differential gene expression revealed upregulated (fold change [FC] > 1.5, Benjamini Hochberg P_adj < 0.05) and down-regulated (FC < −1.5, Benjamini Hochberg P_adj < 0.05) in hTauP301L-injected mice compared to GFP-injected controls (n = 32/AAV injection group). Volcano plots for illustration purpose only, please see supplemental information Fig. S3, A–D, and Table S2, A–D. (B) PCA shows the genetic background drives variation in the transcriptome (n = 8/background/AAV injection group). (C) Upset plot to summarize multiple differential expression analyses: Differential expression (hTauP301L vs. eGFP) was performed for each strain (see Fig. S1 and Table S2, A–D). Signature A (highlighted in yellow) was identified as the intersection of DEGs shared across genetic backgrounds. Other intersections are provided as a resource (Table S2 E). (D) KEGG enrichment of Signature A is significantly enriched for neurodegeneration-related terms and Pathways of neurodegeneration (map05022; 168 DEGs in Signature A out of 471 genes in map05022). See the supplemental information for a summary of all enrichment analyses (Table S2 J). (E) Heatmap of the top 10 DEGs in Pathways of neurodegeneration—multiple diseases (map05022) shows the conserved response to AAV-hTauP301L injection in Signature A.
Figure S3.
Figure S3.
Transcriptomic analyses for discovery of core tau response (Signature A). Volcano plot demonstrates the log2 fold change (x axis) and statistical significance (Benjamini-Hochberg adjust P value, y axis). (A–D) (A) B6, (B) CAST, (C) PWK, and (D) WSB mice were analyzed separately to compare genes upregulated (red, fold change [FC] > 1.5, P_adj < 0.05) and downregulated (blue, FC < 1.5, P_adj < 0.05) in tau-injected mice compared with GFP-injected controls (n = 32/injection group). (E) KEGG enrichment of Signature A defined in Fig. 2 C. (F) Heatmap of all Signature A genes in KEGG map05022.
Figure 4.
Figure 4.
Signature B: Tau-responsive signatures unique to wild-derived genetic backgrounds. DEGs specific to wild-derived background (∼Injection+GeneticBackground+Injection:GeneticBackground; Benjamini Hochberg adjusted P value <0.05, fold change > 1.5) were calculated for hTauP301L-injected mice relative to eGFP-injected controls. (A) 133 in total DEGs were identified in one or more wild-derived backgrounds. (B) 17/133 DEGs in Signature B were shared by all three wild-derived backgrounds. (C) Cilia- and flagella-associated protein 74 (Cfap74) and 16 other wild-derived DEGs are not differentially expressed in B6 mice. There are 53 CAST-specific DEGs, 22 PWK-specific DEGs, and 25 WSB-specific DEGs. (D and E) The (D) top five downregulated and (E) top five upregulated in each background are shown in a heatmap colored by log2FoldChange between hTauP301L-injected and eGFP-injected mice. See supplemental files for all background-specific DEGs (Table S2, F–H).
Figure S4.
Figure S4.
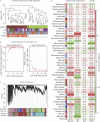
Summary of WGCNA. Gene module detection was performed using WGCNA from hTauP301L-injected and eGFP-injected mice. (A) Sample dendrogram and trait heatmap reveal outliers by calculating unbiased sample similarity. Trait heatmap shows samples are segregated out mainly by injection type and seeding activity score (FRET) instead of sex or genetic background (GB). (B) Scale independence and mean connectivity calculated by the WGCNA package. Although no thresholds reached the recommended 0.9 threshold for scale free topology, a threshold of 6 was selected based on recommendations of the package’s authors for unsigned network detection in an experiment with at least 40 samples. (C) Module discovery was performed by clustering genes based on topological overlap matrix dissimilarity (y axis: height). Similar clusters were merged using a dissimilarity threshold of 0.25 (merged dynamic). 60 remaining clusters were assigned arbitrary names using R’s color palette. (D) To prioritize modules of interest, quantified traits were correlated to each module’s eigengene expression. Benjamini-Hochberg adjusted P values were reported in each cell of the heatmap (colored by Pearson’s R). Injection is defined as a binary trait (1: tau, 0: GFP). Genetic background is defined as a binary trait (1: wild-derived, 0: B6). Sex is defined as a binary trait (1: female, 0: male). FRET is defined as a measurement of % cells with FRET+ signal from Fig. 4 C.
Figure 5.
Figure 5.
Network analysis identified darkorange module as putative mediator of tau seeding. Gene module detection was performed using WGCNA from hTauP301L-injected and eGFP-injected mice. See supplemental information for WGCNA parameters (n = 60 samples after outlier detection). A full list of all 60 modules and their module–trait correlation can be found in Fig. S3. (A) Two-dimensional module-trait detection reveals four modules statistically significant for both the correlation to tau seeding (FRET) and the correlation to the wild-derived genetic background. Pearson correlations were performed in the WGCNA package per default parameters and considered significant with a Benjamini Hochberg adjusted P value <0.05. Points on the scatter plot are sized according to the number of genes in each module and the opacity set by whether the module is statistically significant for both FRET and GB, either trait, or neither trait. (B) Gene significance (GS) is calculated for every gene in WGCNA analysis. Plotting GS by the module of interest reveals that the darkorange module contains the most genes positively correlated to tau seeding. (C) Representation of mediation analysis was performed on a matrix of eigengenes for each module. Two steps of mediation analysis identified that darkorange is a significant mediator of the relationship between genetic background and tau seeding (joint significance calculated via HIMA, P = 0.0349). Furthermore, Bayesian model selection suggests that the relationship between the darkorange module and tau seeding is most probabilistically via complete mediation (dark green arrows).
Figure 6.
Figure 6.
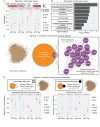
Signature C: Darkorange module implicates microglia in response to tau seeds. (A) Darkorange module was renamed Signature C and the eigengene value of the darkorange module for each mouse was calculated as part of the WGCNA pipeline. Differences observed in eigengene expression follow a similar pattern to tau seeding activity, with the largest increases observed in CAST and PWK mice injected with AAV-hTauP301L. (B) KEGG enrichment of Signature C reveals microglia-related terms calculated in gprofiler2 via Fisher’s one-tailed test (all terms P < 0.05). (C) Signature C gene network is represented as nodes with edge distance representing topological overlap matrix score from WGCNA. Neurodegenerative hub-genes (purple) were detected by comparing Signature C (darkorange) and wild-derived amyloid response (Fisher’s exact test: P = 1.62 × 10⁻¹⁹; Onos et al., 2019). (D) Microglial transcriptional state was inferred using previously published markers for homeostatic (Li et al., 2019) and disease-associated microglia (Keren-Shaul et al., 2017). The homeostatic microglial signature was significantly enriched (Fisher’s exact test: P = 2.44 × 10⁻⁷) and showed the largest decrease in PWK injected with AAV-hTauP301L. The disease-associated microglial signature was significantly enriched (Fisher’s exact test: P = 2.31 × 10⁻⁵) and shows the largest increase in PWK injected with AAV-hTauP301L.
Figure 7.
Figure 7.
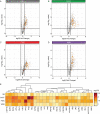
Signature C: Darkorange module genes in shared inflammatory response to tau. Volcano plot demonstrates the log2 fold change (x axis) and statistical significance (unadjusted P value, y axis) as measured via the nCounter mouse neuroinflammation panel. (A–D) (A) B6, (B) CAST, (C) PWK, and (D) WSB mice were analyzed separately to identify DEGs (|fold change| > 1.5, P < 0.05) in tau-injected mice compared to GFP-injected controls (n = 3/injection group, females only). Volcano plots are colored to highlight the 56 darkorange genes that are included on the mouse neuroinflammation panel. (E) Significant DEGs shared by all backgrounds are shown in a heatmap colored by log2FoldChange (FC) between hTauP301L-injected and eGFP-injected mice.
Figure 8.
Figure 8.
Signature C: Darkorange module and inflammatory response are enriched in PWK and CAST. DEGs were identified in CAST, PWK, and WSB mice injected with AAV-hTauP301L relative to B6.AAV-hTauP301L controls. (A) Global significance score for each nCounter mouse neuroinflammation annotation term was calculated using the Nanostring nSolver software. Red boxes indicate pathways (Innate Immune Response and Microglia Function) that were highlighted as they had the most drastic changes that were shared by both CAST and PWK mice. (B) An overlap of genes that make up the Signature C (darkorange module), Innate Immune Response, and Microglia Function. 29 genes were present in the darkorange module and at least one of the highlighted pathways. For the list of genes within these three pathways, please see Table S2 R. (C) Normalized expression of the 29 genes of interest within tau-injected mice was calculated as a z-score of normalized linear counts within tau-injected mice only. Heatmap of these 29 genes of interest shows that, within AAV-hTauP301L–injected mice, PWK mice had elevated expression of them.
Figure 9.
Figure 9.
Resource: Guideline to select a mouse genetic background to study Tau. (A) Signatures A–C of this study represent a core response to expressing AAV-hTauP301L (Signature A), wild-derived specific response to AAV-hTauP301L expression (Signature B), and a tau seeding–associated module (Signature C). (B) Given a gene of interest, the resources in this paper can guide genetic background selection for functional studies in mice. For example, Trem2, a gene with strong evidence for a role in tau pathology, is present in Signature A (core Tau response) and Signature C (Tau seed response). Based on this evidence, while Trem2 is differentially expressed in response to tau across all mouse strains, there is a possibility that it is involved in a CAST- or PWK-specific reaction to tau seeds.
Figure S5.
Figure S5.
Resource: Using transcriptional signatures to compare across studies. (A) Analysis of publicly available data collected from mouse models of tauopathy (GSE114910, GSE125957) reveals a modest overlap between our AAV approach and similar tau models at 6 mo. Analysis was performed with models matched for age and DEG condition (Tau versus appropriate control). However, it was not possible to match for sex, exact region, the promoter used by the model, or the genetic background of the mice in each study. (B) Sample similarity was calculated via PCA of the expression of 11 mouse genes previously reported as mouse orthologs of human AD risk genes. Data suggests that these 11 genes were sufficient to group wild-derived mice separately from the classically inbred (B6) mice. (C) Analysis of the Signature C genes using the mouse neurological disorders RNA-seq portal. Portal includes studies in mouse models of spinocerebellar ataxia (SCA), Rett syndrome (Rett), Parkinson’s disease (PD), neurodevelopmental disorders (other-neurodev), inflammation and immunity (other-inflam), cell type specific expression (other-cell), aging (other-aging), neurofibromatosis (NF), Huntington’s disease (HD), frontotempral degeneration and amyotrophic lateral sclerosis (FTD-ALS), Creutzfeldt-Jakob disease (CJD), and AD. Genes in the Signature C are significantly upregulated in AD (light blue), downregulated in other cell types studies (orange), and largely absent within models of Huntington’s disease (dark green). (D) Heatmap of the Agora nominated target genes (n = 396) that were measured in our study via mRNA-seq.

Update of

Similar articles

Cited by

References

    1. Al-Ouran, R., Wan Y.W., Mangleburg C.G., Lee T.V., Allison K., Shulman J.M., and Liu Z.. 2019. A portal to visualize transcriptome profiles in mouse models of neurological disorders. Genes. 10:759. 10.3390/genes10100759 - DOI - PMC - PubMed
    1. Arriagada, P.V., Growdon J.H., Hedley-Whyte E.T., and Hyman B.T.. 1992. Neurofibrillary tangles but not senile plaques parallel duration and severity of Alzheimer’s disease. Neurology. 42:631–639. 10.1212/WNL.42.3.631 - DOI - PubMed
    1. Bailey, R.M., Howard J., Knight J., Sahara N., Dickson D.W., and Lewis J.. 2014. Effects of the C57BL/6 strain background on tauopathy progression in the rTg4510 mouse model. Mol. Neurodegener. 9:8. 10.1186/1750-1326-9-8 - DOI - PMC - PubMed
    1. Bengoa-Vergniory, N., Velentza-Almpani E., Silva A.M., Scott C., Vargas-Caballero M., Sastre M., Wade-Martins R., and Alegre-Abarrategui J.. 2021. Tau-proximity ligation assay reveals extensive previously undetected pathology prior to neurofibrillary tangles in preclinical Alzheimer’s disease. Acta Neuropathol. Commun. 9:18. 10.1186/s40478-020-01117-y - DOI - PMC - PubMed
    1. Blake, J.A., Baldarelli R., Kadin J.A., Richardson J.E., Smith C.L., Bult C.J., and Mouse Genome Database Group . 2021. Mouse genome database (MGD): Knowledgebase for mouse-human comparative biology. Nucleic Acids Res. 49:D981–D987. 10.1093/nar/gkaa1083 - DOI - PMC - PubMed

Publication types