. 2023 Nov 1;133(21):e170217.
doi: 10.1172/JCI170217.

Somatic rearrangements causing oncogenic ectodomain deletions of FGFR1 in squamous cell lung cancer

Affiliations

Somatic rearrangements causing oncogenic ectodomain deletions of FGFR1 in squamous cell lung cancer

Florian Malchers et al. J Clin Invest. .

Abstract

The discovery of frequent 8p11-p12 amplifications in squamous cell lung cancer (SQLC) has fueled hopes that FGFR1, located inside this amplicon, might be a therapeutic target. In a clinical trial, only 11% of patients with 8p11 amplification (detected by FISH) responded to FGFR kinase inhibitor treatment. To understand the mechanism of FGFR1 dependency, we performed deep genomic characterization of 52 SQLCs with 8p11-p12 amplification, including 10 tumors obtained from patients who had been treated with FGFR inhibitors. We discovered somatically altered variants of FGFR1 with deletion of exons 1-8 that resulted from intragenic tail-to-tail rearrangements. These ectodomain-deficient FGFR1 variants (ΔEC-FGFR1) were expressed in the affected tumors and were tumorigenic in both in vitro and in vivo models of lung cancer. Mechanistically, breakage-fusion-bridges were the source of 8p11-p12 amplification, resulting from frequent head-to-head and tail-to-tail rearrangements. Generally, tail-to-tail rearrangements within or in close proximity upstream of FGFR1 were associated with FGFR1 dependency. Thus, the genomic events shaping the architecture of the 8p11-p12 amplicon provide a mechanistic explanation for the emergence of FGFR1-driven SQLC. Specifically, we believe that FGFR1 ectodomain-deficient and FGFR1-centered amplifications caused by tail-to-tail rearrangements are a novel somatic genomic event that might be predictive of therapeutically relevant FGFR1 dependency.

Keywords: Drug therapy; Genetics; Lung cancer; Oncology.


Conflict of interest statement

Conflict of interest: LN has received honoraria from Pfizer, Celgene, Novartis, Roche, Boehringer Ingelheim, Bristol-Myers Squibb, Takeda, Bayer, and Janssen. JS has received honoraria from Medizinischer Dienst der Krankenversicherung Nordrhein (MDK), Biocartis, and AstraZeneca. SMB has received honoraria from AstraZeneca, Roche, Novartis, GSK, Merck Sharp&Dohme (MSD), Targos, Molecular Health, and Merck as well as personal fees and nonfinancial support from Janssen and Bristol-Myers Squibb. HCR has received consulting and lecture fees from Abbvie, AstraZeneca, Vertex, and Merck. HCR has received research funding from Gilead Pharmaceuticals. HCR is a co-founder of CDL Therapeutics GmbH. RB has received honoraria from AbbVie, Amgen, AstraZeneca, Bayer, Bristol-Myers Squibb, Boehringer-Ingelheim, Illumina, Janssen, Lilly, Merck-Serono, MSD, Novartis, Qiagen, Pfizer, Roche, and Targos MP Inc. RKT is a founder of NEO New Oncology, now part of Siemens Healthcare; a founder of PearlRiver Bio, now part of Centessa Pharmaceuticals; a founder of Epiphanes Inc.; and a founder and CEO of DISCO Pharmaceuticals. RKT is a shareholder of Centessa, Epiphanes, and DISCO Pharmaceuticals and has received consulting fees or a salary from NEO New Oncology, PearlRiver Bio, and DISCO Pharmaceuticals. JDM receives licensing fees from the NIH and UTSW for the distribution of human tumor cell lines. JB has received research funding from Bayer.

Figures

Figure 1
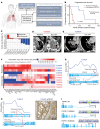
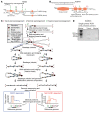
Figure 1. Tail-to-tail rearrangements in patients responding to FGFR inhibition.
(A) Overview of the study cohorts. (B) Kaplan-Meier curve showing progression-free survival of patients with 8p11-amplified SQLC treated with the FGFR inhibitors BGJ398 or GW786034 (TUM006). FGFR1 amplification was determined by FISH. Asterisk indicates that treatment was stopped because of toxicity. (C) Tumor volume change for patients with FGFR1-amplified SQLC treated with BGJ398 (Response Evaluation Criteria in Solid Tumors [RECIST] criteria). Tumor progression (red) and durable response (blue) following FGFR inhibition. TUM003 and TUM007 died during treatment with no sign of response. One patient (TUM006) was treated off-label (asterisk indicates that no RECIST data are available). Tumor shrinkage was estimated on CT scans (Supplemental Figure 1). (D and E) CT scans of patient TUM005 without a response and patient TUM004 with a durable response. (F) Copy number (CN) for 6 patients with progressive disease and 4 patients with a durable response to FGFR inhibition (5, 6). Red arrows indicate samples with tail-to-tail rearrangements within FGFR1 (highlighted by a green frame). (G) Copy number plot magnified at the FGFR1 locus (615x sequencing coverage). Patient TUM004 had a response to FGFR inhibition with BGJ398. Normal exon structure of FGFR1 (middle), resulting in genomic rearrangement (bottom), and the location of the detected breaks are indicated by arrows, as are the resulting rearrangements. (H) Copy number plot magnified at the FGFR1 locus (558x sequencing coverage). Tumor sample TUM006 was obtained from a patient responding to off-label treatment with GW786034. Normal exon structure (middle), the resulting genomic rearrangement (bottom), and the location of the detected breaks and resulting rearrangements are indicated by arrows. Image shows p-FGFR1 by IHC image (scale bar: 100 μm). (I) Transcript of FGFR1 WT (ENST00000397091.9, top) and transcripts of FGFR1 found in treatment-naive patient samples (middle and bottom) with possible ATG start codons (TAC motive from right to left; FGFR1 is located on the negative strand). Light blue indicates UTRs.
Figure 2
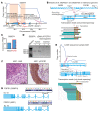
Figure 2. FGFR1 tail-to-tail rearrangements in 8p11-8p12–amplified SQLCs.
(A) Copy number plot (WGS, 30x coverage) of SQLC sample S00674 (NSD3 and FGFR1 are highlighted in orange). The reference genome and the location of genes (wedges) are indicated below (yellow, positive; blue, negative strand; detected breaks are indicated by arrows) (B) Normal exon structure of NSD3 and FGFR1 (top) is indicated. Resulting rearrangement (middle, magenta arrow indicates the tail-to-tail rearrangement; red bars indicate breaks and rearrangement) and breakpoint-spanning reads (from transcriptome sequencing) are shown (bottom). (C) Expression of NSD3-long and FGFR1α in sample S00674, as determined by transcriptome sequencing. (D) Electropherogram of a PCR using cDNA generated from tumor and normal (S00674) lung tissue. Two independent primer pairs covering the breakpoint were used (predicted band size: 1, 2.268 bp and 2, 2.407 bp). (E) Magnified copy number plot showing the genomic FGFR1 locus (A921, 468× depth, unknown response to FGFR inhibition). Copy number (top), normal exon structure (middle), resulting genomic rearrangement (middle), and break-detecting transcriptomic sequencing reads (bottom, magenta arrow indicates the tail-to-tail rearrangement) are indicated. (F) Microscopic H&E-stained (left) and p-FGFR1 (right) images of the A921 sample. Scale bars: 50 μm. (G) Transcripts of FGFR1 found in patient tumors with an unknown FGFR inhibitor response. Possible ATG start codons (TAC motive from right to left; FGFR1 is located on the negative strand of the reference genome) and exons (Ex) (light blue areas are UTRs).
Figure 3
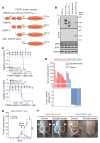
Figure 3. Oncogenic potential of an ectodomain-deficient version of FGFR1.
(A) Overview of FGFR1 protein variants using the next possible in-frame ATG start codon of the transcripts shown in Figure 1I and Figure 2G. AB, acid box; TM, transmembrane domain. (B) Immunoblots of Ba/F3 cells transduced with retroviruses encoding ΔEC-FGFR1 and EML4-ALK (control), as well as parental Baf3 cells or cells transduced with empty vector (Baf3 e.v.), FGFR1α (Baf3 FGFR1alpha), FGFR1β, and (Baf3 FGFR1beta). Baf3 e.v, FGFR1α, and FGFR1β were cultured with IL-3. t, total. (C) Baf3 e.v., FGFR1β, and ectodomain lacking FGFR1 (ΔEC-FGFR1, using an in-frame ATG in exon 9) were incubated with increasing concentrations of the FGFR inhibitor BGJ398 (BGJ, top) or the FGFR inhibitor AZD4547 (bottom) for 96 hours, with measurement of ATP content to determined viability. Baf3 e.v. and Baf3 FGFR1β cells were screened in the presence of IL-3, whereas Baf3 ΔEC-FGFR1 cells were screened without IL-3. (D) Quantification of xenograft tumor models engrafted with Ba/F3 cells expressing ΔEC-FGFR1 (blue) or EML4-ALK (red) following treatment with BGJ398 (20 mg/kg, q.d., red/blue bars) or vehicle (dashed red/blue bars). (E) Tumor volumes of a xenograft tumor model engrafted with Ba/F3 cells expressing ΔEC-FGFR1 that were treated with BGJ398 (20 mg/kg, q.d., blue curve) or vehicle (black curve), respectively, upon formation of palpable tumors. Tumor volumes were assessed as indicated and compared by 2-tailed t test. ***P < 0.0005. (F) Representative photographs of the xenograft models are shown before termination of the experiment.
Figure 4
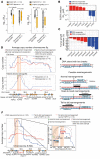
Figure 4. Rearrangements associated with FGFR inhibitor sensitivity.
(A) GI50 of 118 cancer cell lines treated with BGJ398 or JQ.1, sorted according to the presence or absence of somatic FGFR gene family alterations (left) or the presence or absence of FGFR1 amplification (excluding other FGFR alterations, right). *P < 0.05. (B) Average GI50 values of 8 cell lines (>1 μM in red; <1 μM in blue) treated with the FGFR inhibitors BGJ398 or AZD4547. (C) Average tumor growth reduction of 8 PDX tumor models treated with 20 mg/kg BGJ398 or vehicle control (resistant red, tumor reduction <30 %; sensitive blue, tumor reduction >30 %). Asterisks indicate samples provided by Weeden et al. (13). (D) Average copy number of 6 cell lines resistant to (red) and 2 cell lines sensitive to (blue) FGFR inhibition (top panel) and 5 resistant (red) and 3 sensitive (blue) PDX tumor models (bottom panel). NSD3 and FGFR1 are highlighted (orange). Locations of genes (wedges) are indicated below (yellow, positive strand; blue, negative strand). Rearrangements in samples from responders are indicated. (E) Illustration of 3 possible rearrangements and their impact on copy number (see Supplemental Video 1 for a detailed explanation). (F) Average copy number of 25 8p-amplified primary SQLC specimens with unknown responsiveness to FGFR inhibition (whole-genome sequenced). Data are plotted together (gray, n = 25) or with (400 kb range, blue, n = 9) or without observed tail-to-tail rearrangements (>1 mb range, red, n = 16) before FGFR1. Magnification of the amplification peak is shown (right, blue group, n = 9). Only rearrangements observed within the ORF of NSD3 or FGFR1 are indicated (arrows). Corresponding rearrangements within the same sample are also indicated, if located within the same sample (black lines) and if detected within the magnified area (arrows: head-to-head in green, normal in black, and tail-to-tail in red).
Figure 5
Figure 5. FGFR1 dependency and consecutive order of genomic rearrangements.
(A) Domain architecture of NSD3-long (top, 1 to 1,437 aa) and NSD3-short (bottom, 1 to 645 aa) and all detected rearrangements within all study groups (n = 52; arrow color indicates the type of rearrangement). (B) Domain architecture of FGFR1α (1 to 822 aa, n = 52; arrow color indicates the type of rearrangement. (C) Schematic overview of 2 BFB mechanisms forming 8p11-p12 amplifications, differing only in the consecutive order of genomic rearrangements. (D) Electropherogram of a PCR across a head-to-head rearrangement (S00674, tumor and matched normal DNA) using only 1 primer.

Comment in

References

    1. Siegel RL, et al. Cancer Statistics, 2021. CA Cancer J Clin. 2021;71(1):7–33. doi: 10.3322/caac.21654. - DOI - PubMed
    1. Cancer Genome Atlas Research Network. Comprehensive genomic characterization of squamous cell lung cancers. Nature. 2012;489(7417):519–525. doi: 10.1038/nature11404. - DOI - PMC - PubMed
    1. Weiss J, et al. Frequent and focal FGFR1 amplification associates with therapeutically tractable FGFR1 dependency in squamous cell lung cancer. Sci Transl Med. 2010;2(62):62ra93. doi: 10.1126/scitranslmed.3001451. - DOI - PMC - PubMed
    1. Katoh M. Fibroblast growth factor receptors as treatment targets in clinical oncology. Nat Rev Clin Oncol. 2019;16(2):105–122. doi: 10.1038/s41571-018-0115-y. - DOI - PubMed
    1. Nogova L, et al. Evaluation of BGJ398, a fibroblast growth factor receptor 1-3 kinaseinhibitor, in patients with advanced solid tumors harboring genetic alterations in fibroblast growth factor receptors: results of a global phase I, dose-escalation and dose-expansion study. J Clin Oncol. 2017;35(2):157–165. doi: 10.1200/JCO.2016.67.2048. - DOI - PMC - PubMed

Publication types

MeSH terms

Substances