. 2023 Nov 1;133(21):e166333.
doi: 10.1172/JCI166333.

Phenotype screens of murine pancreatic cancer identify a Tgf-α-Ccl2-paxillin axis driving human-like neural invasion

Affiliations

Phenotype screens of murine pancreatic cancer identify a Tgf-α-Ccl2-paxillin axis driving human-like neural invasion

Xiaobo Wang et al. J Clin Invest. .

Abstract

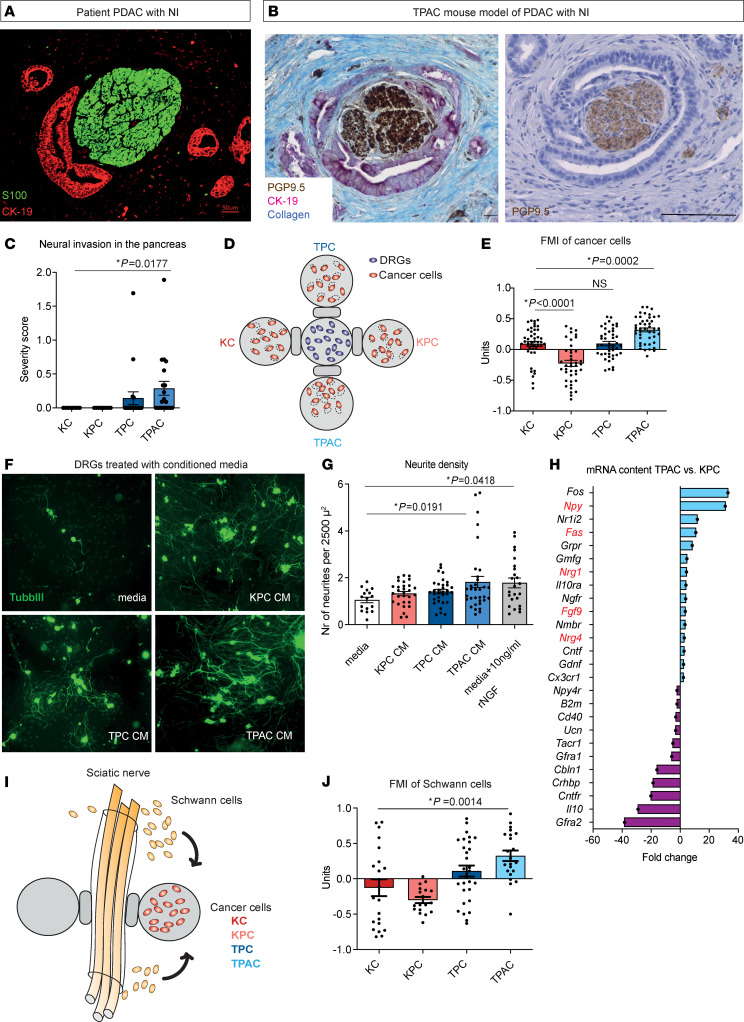
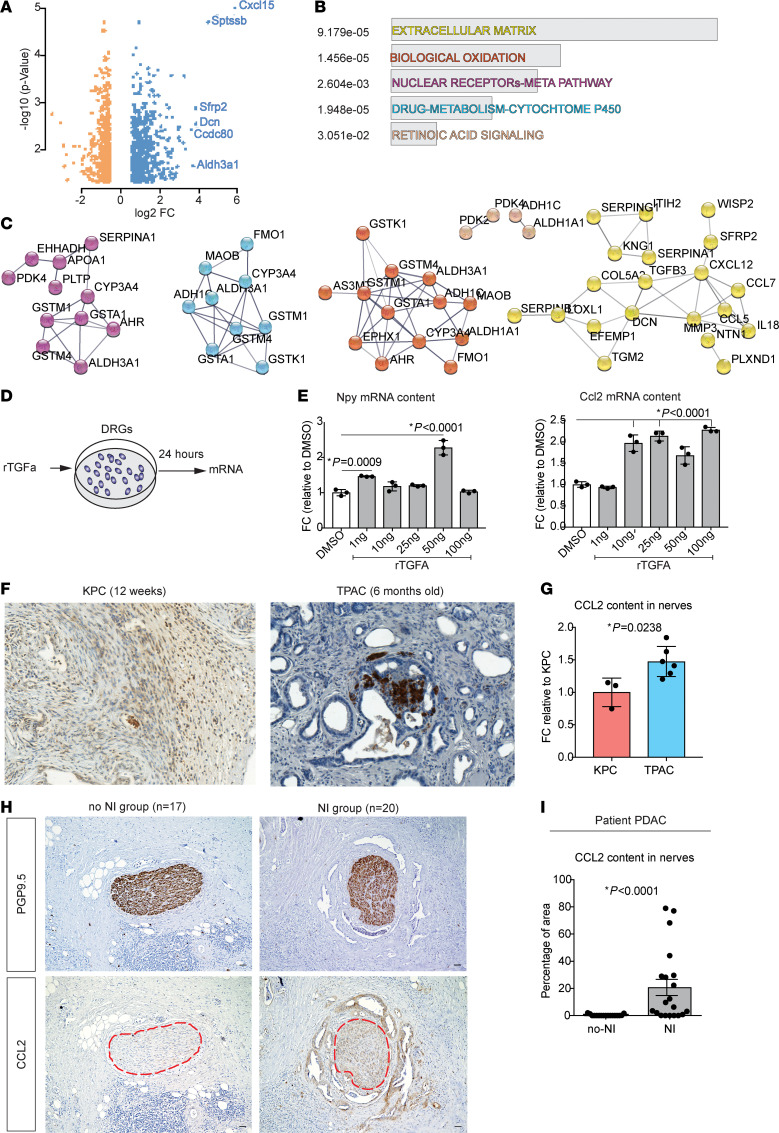
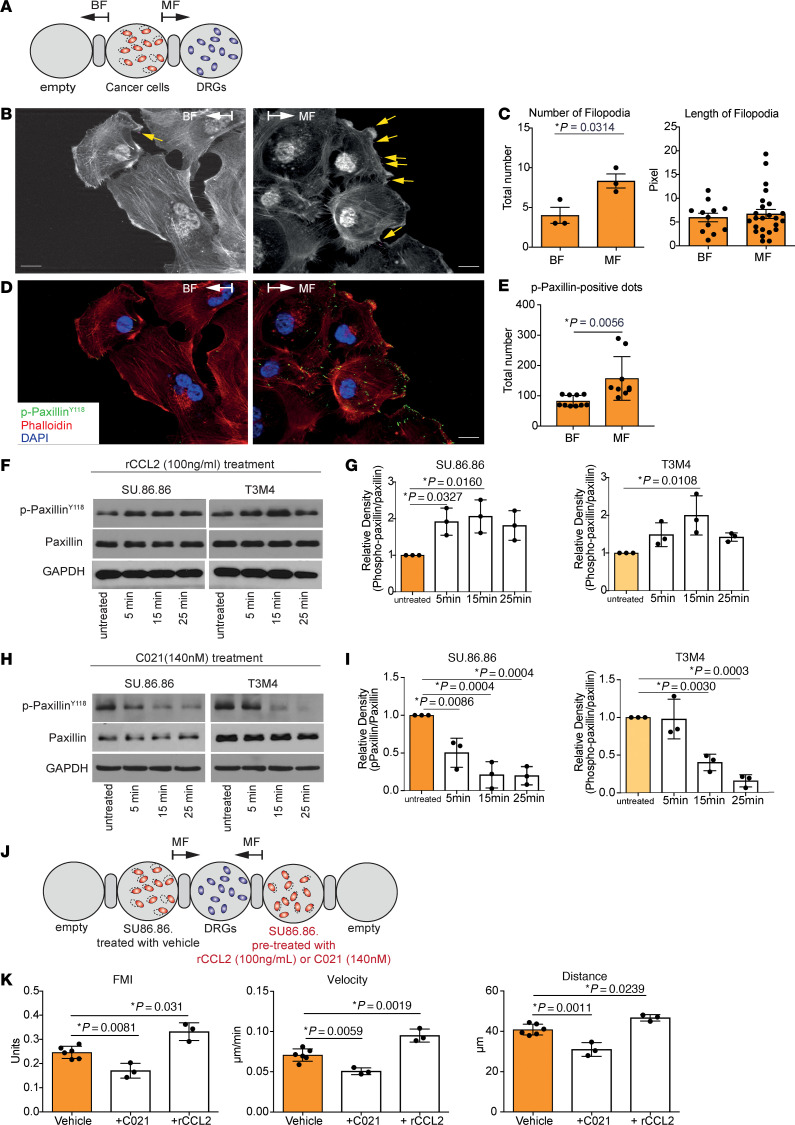
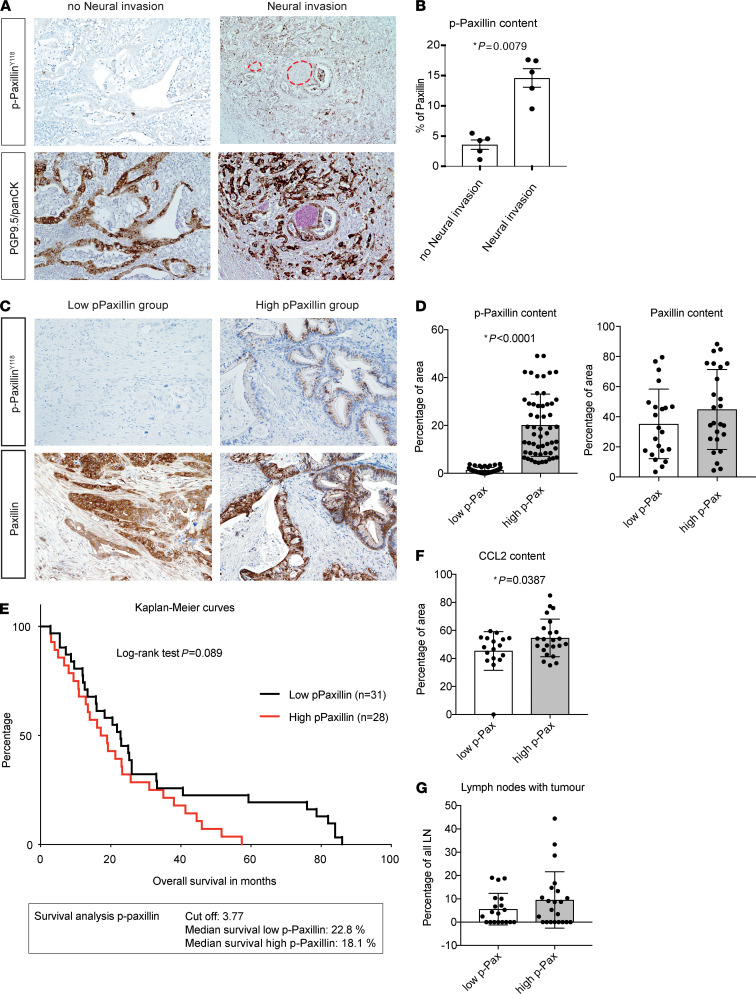
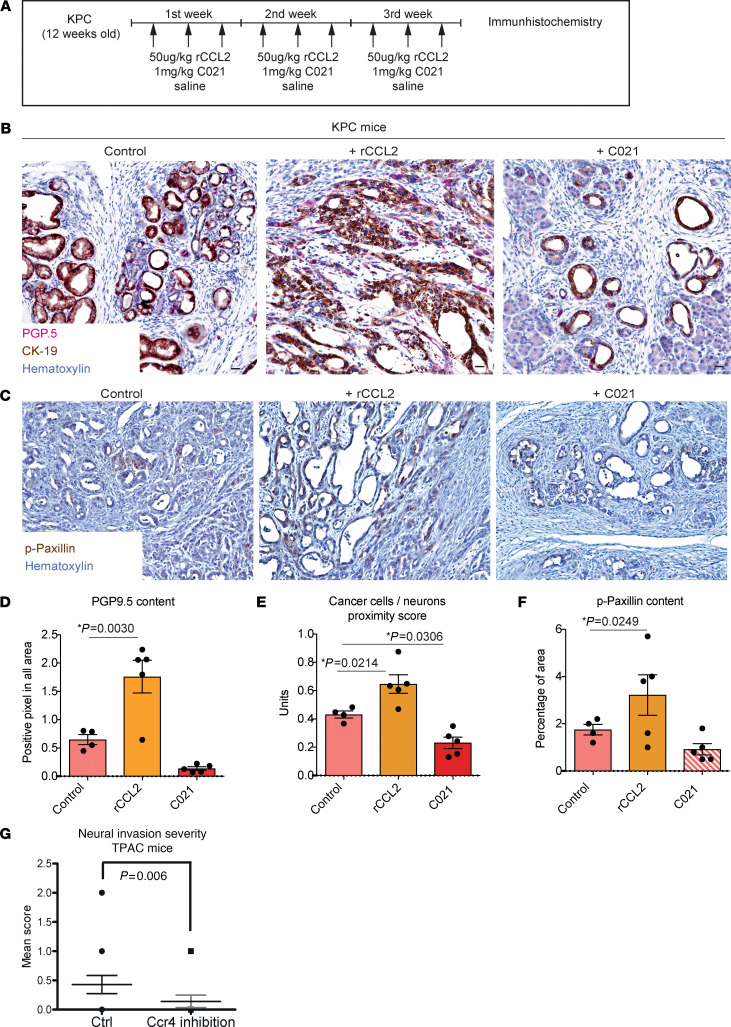
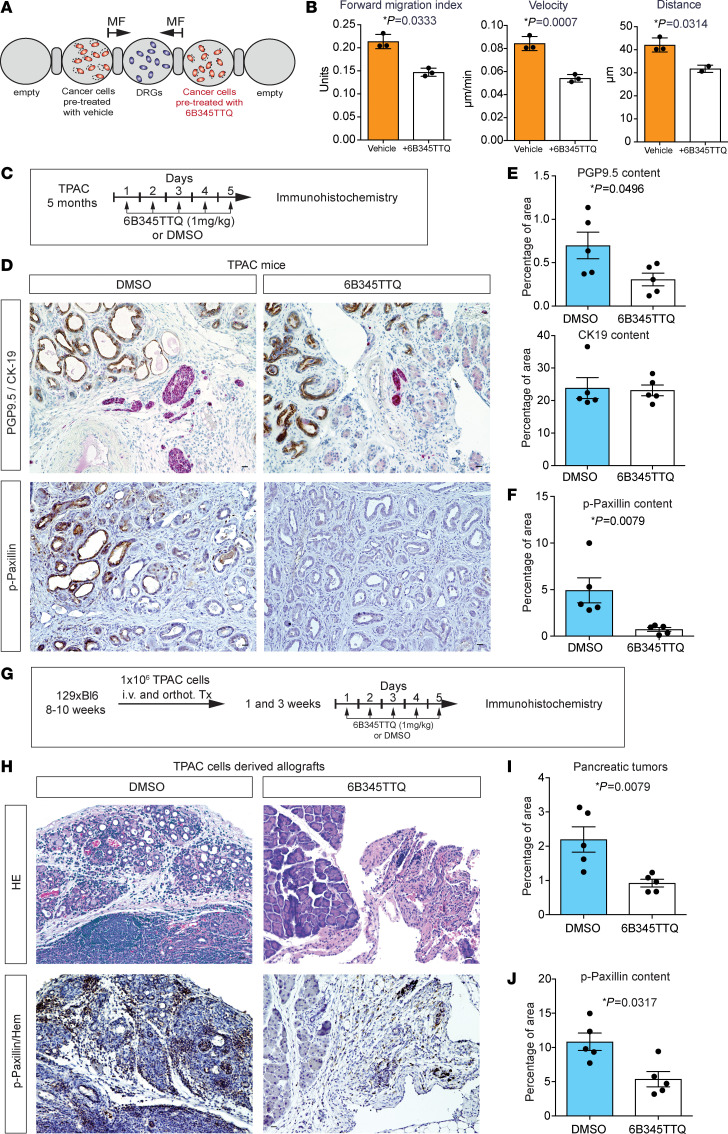
Solid cancers like pancreatic ductal adenocarcinoma (PDAC), a type of pancreatic cancer, frequently exploit nerves for rapid dissemination. This neural invasion (NI) is an independent prognostic factor in PDAC, but insufficiently modeled in genetically engineered mouse models (GEMM) of PDAC. Here, we systematically screened for human-like NI in Europe's largest repository of GEMM of PDAC, comprising 295 different genotypes. This phenotype screen uncovered 2 GEMMs of PDAC with human-like NI, which are both characterized by pancreas-specific overexpression of transforming growth factor α (TGF-α) and conditional depletion of p53. Mechanistically, cancer-cell-derived TGF-α upregulated CCL2 secretion from sensory neurons, which induced hyperphosphorylation of the cytoskeletal protein paxillin via CCR4 on cancer cells. This activated the cancer migration machinery and filopodia formation toward neurons. Disrupting CCR4 or paxillin activity limited NI and dampened tumor size and tumor innervation. In human PDAC, phospho-paxillin and TGF-α-expression constituted strong prognostic factors. Therefore, we believe that the TGF-α-CCL2-CCR4-p-paxillin axis is a clinically actionable target for constraining NI and tumor progression in PDAC.

Keywords: Cancer; Innervation; Oncology.


Figures

Figure 1
Figure 1. Mutant TPAC mice represent a model for human-like PNI.
Representative images of genuine PNI in PDAC resection specimens (A) and in TPAC mouse mutants (B, please also see Supplemental Figure 1E for a broader view of the tumor area with PNI); pan-neural marker: PGP9.5 (brown), cancer cell marker: CK-19 (pink), and Aniline blue (for collagen). (C) Graphs showing the severity of NI in GEMMs of PDAC. (D) Scheme of migration assay of cancer cells and neurons from dorsal root ganglia (DRGs). (E) Graphs show the FMI of primary cancer cells isolated from KC, KPC, TPC, and TPAC mice in the 3D migration assay. (F) Representative images of DRG neurons treated with conditioned medium from KPC, TPC, and TPAC cancer cells, stained with neuronal marker β3 Tubulin (Tubβ3) antibody. (G) Results of the in vitro neuroplasticity assay of DRG neurons treated with supernatants of the primary cancer cells from the analyzed mouse genotypes. (H) Transcriptome analysis of TPAC- versus KPC-derived primary cancer cells. (I) Schematic representation of the 3D SC outgrowth assay. Sciatic nerves isolated from WT mice were placed between bridges connected to ECM gel drops containing primary murine cancer cells (KC, KPC, TPC, and TPAC) and empty ECM gel drops. The test was performed for 72 hours in culture media with CO2 supply. (J) Graphs showing the FMI of SCs. All results in the graphs are shown as mean ± SEM. For statistical analyses, Mann-Whitney U test (C and E), ordinary 1-way ANOVA (G), Kruskal-Wallis test, Dunnett’s test for multiple comparisons (G and H) and Shapiro-Wilk normality test (all panels) for distribution were used.
Figure 2
Figure 2. CCL2 induced by TGF-α is enriched in cocultures of cancer cells and DRG neurons, TPAC neurons, and in patient-derived PDAC samples with neural invasion.
(A) Volcano plot of differentially expressed genes (DEGs) for the comparison of murine cancer cells derived from TPAC versus KPC mice. (B) Bar plot displaying a selected set of over-represented pathways among the DEGs for the comparison groups TPAC versus KPC. (C) Pathway-based interaction networks of DEGs for the comparison groups TPAC versus KPC, where network line thickness indicates the confidence of the interaction. (D) Experimental set-up: DRGs from neonatal mice were cultured for 2 days, and rTGF-α was added at concentrations of 1, 10, 25, 50, and 100 ng/mL for 24 hours. After the treatment, cells were used for RT-qPCR. (E) Graphs representing Ccl2 and Npy mRNA content in DRGs after treatment with rTGF-α. (F) Representative images of pancreatic tumors from TPAC and KPC mice stained with PGP9.5 and CCL2 (both in brown). (G) Plots showing the colorimetric CCL2 content in nerves from TPAC and KPC tumors. (H) Representative images of consecutive sections of PDAC patient samples stained with CCL2 and S100 (both in brown) and counterstained with H&E. (I) Plots showing the colorimetric CCL2 content in the nerves of patient samples measured with the QuPath software. Scale bars: 50 μm. All results in the graphs are shown as mean ± SEM. For statistical analyses, ordinary 1-way ANOVA (E), Kruskal-Wallis test (E), Dunnett’s test for multiple comparisons (E), Mann-Whitney U test (G and I), and Shapiro-Wilk normality test for distribution (all panels) were used.
Figure 3
Figure 3. The migration behavior of cancer cells triggered by neurons is regulated by the CCL2/CCR4 axis.
(A) Schematic representation of the 3D migration assay. Arrows indicate the direction of migrating cells. (B) Representative images of migrating SU.86.86 pancreatic cancer cells in the MF (toward DRGs) and BF (opposite to DRGs) analyzed by confocal microscopy and labeled filopodia (pink lines). (C) Diagrams showing the number and length of filopodia in the cancer cells in BF and MF, quantified with the FiloQuant software. (D) Representative images of SU.86.86 cancer cells from the migration assay, stained with phalloidin (red) and phospho-paxillinY118 (green), and counterstained with DAPI (blue). (E) Diagram showing the number of p-paxillin-positive points per ×10 magnification. (F) Representative Western blots of SU.86.86 and T3M4 cancer cells treated with recombinant CCL2 (100 ng/mL). (G) Graphs with relative content of proteins identified by Western blot measured with the ImageJ software (n=3 biological replicates). (H) Western blots of SU.86.86 and T3M4 cancer cells treated with CCR4 inhibitor C021 (140 nM). (I) Graphs with relative content of proteins identified by Western blot measured with the ImageJ software. (J) Scheme of experiment: cancer cells were pretreated with rCCL2 or C021 for 15 minutes and placed into the 3D migration assay with DRG neurons. As control, cells pretreated with vehicle were used. (K) Graphs indicating FMI, velocity, and migrated distance of cancer cells in the 3D migration assay. All results in graphs are shown as a mean ± SEM. For statistical analyses we used unpaired t test (B and E), 1-way ANOVA (G, H, and K), Dunnett’s multiple comparisons test (G, I, and K), and for the distribution, Shapiro-Wilk normality test (all panels). The P value ˂ 0.05 was considered to have significance. Scale bars: 20 μm.
Figure 4
Figure 4. Paxillin phosphorylation in cancer cells is associated with poorer survival in patients with PDAC.
(A) Representative images of consecutive sections from human PDAC resection specimens stained for p-paxillin (brown), the neural marker PGP9.5 (pink), cancer cell marker pan-CK (brown) and counterstained with haematoxylin. (B) Graphs showing the percentage of p-paxillin content in cancer cells located distal and proximal to nerves. (C) Representative images of consecutive sections from patient-derived PDAC samples stained with paxillin and p-paxillin (brown) and counterstained with hematoxylin. (D) Graphs indicating relative content of p-paxillin to paxillin in low-p-paxillin and high p-paxillin groups of patients with PDAC. (E) Kaplan-Meier curves showing percentage survival of patients with low p-paxillin content (black line) and high p-paxillin content (red line). The cut-off value for p-paxillin content was set at 4% stained cells in all analyzed areas. (F) Graphs showing the percentage of CCL2 content in low-p-paxillin and high p-paxillin groups of patients with PDAC. (G) Graphs showing the percentage of lymph nodes infiltrated with tumor cells to all lymph nodes analyzed in low-p-paxillin and high p-paxillin groups of patients with PDAC. Scale bars: 20 μm. All results in graphs are shown as a mean value ± SEM. For the statistical analyses we used Mann-Whitney test (B, D, and F), and the Mantel-Cox test (E). The P value ˂ 0.05 was considered to have significance.
Figure 5
Figure 5. CCL2/CCR4 axis regulates paxillin phosphorylation and innervation in KPC mice.
(A) Experimental design of rCCL2 and C021 inhibitor treatment: 12-week-old KPC mice (n = 5) were injected i.p. with rCCL2 or C021 every other day for 3 weeks with normal saline as control. (B and C) Representative images of consecutive sections from PDAC samples of KPC mice treated with rCCL2, C021, and control groups stained with the neural marker PGP9.5 (pink), cancer cell marker CK-19 (brown), p-paxillin (brown), and counterstained with haematoxylin. Plots show (D) PGP9.5 content, (E) score of cancer cell proximity to neurons, and (F) p-paxillin content in PDAC sections from treated KPC mice. (G) The NI score in the pancreatic tumors of TPAC mice treated with the CCR4 inhibitor versus control (solvent) substance. All results in graphs are shown as a mean value ± SEM. For the statistical analyses, we used ordinary 1-way ANOVA (DF), Dunnett’s multiple comparisons test (DF) and for the distribution, a t test (G) and Shapiro-Wilk normality test (all panels). The P value ˂ 0.05 was considered to have significance. Scale bars: 20 μm.
Figure 6
Figure 6. Inhibition of Paxillin-Src-Erk signalosome in vitro and in vivo.
(A) Experimental design: SU86.86 cancer cells pretreated with the paxillin phosphorylation inhibitor 6-B345TTQ for 1 hour were used for a migration assay with murine DRG neurons. Cells pretreated with vehicle were used as control. (B) Graphs showing the FMI, speed, and distance of cells migrating to DRGs. (C) Scheme of in vivo treatment with 6-B345TTQ. 5-month-old TPAC mice were treated with 1 mg/kg of the inhibitor daily for 5 days for a total of 4 weeks. The control group was treated with DMSO. (D) Representative images of pancreatic tumors from TPAC mice treated with 6-B345TTQ and the control group, stained with the neural marker PGP9.5 (pink), cancer cell marker CK-19 (brown), p-paxillin (brown), and counterstained with haematoxilin (blue). The tumor injection bed is marked by the yellow border lines. Graphs show PGP9.5 and CK-19 content (E) and p-paxillin (F) as percentage of positively stained cells stained in the total area. (G) Scheme of treatment in mice allografted with TPAC cancer cells: 1 × 10⁶ cultured primary TPAC cancer cells were orthotopically transplanted into the pancreas of 129xC57Bl6 mice. 3 weeks after transplantation, the mice were treated according to the regimen. (H) Representative images of pancreatic tumors of transplanted TPAC mice treated according to the regimen, stained with H&E (blue/pink), p-paxillin (brown) and counterstained with haematoxilin (blue). (I) Diagrams showing the percentage of tumor area out of the total analyzed area of transplanted mice after treatment. (J) Diagrams showing the p-paxillin content as percentage of positively stained cells in relation to the total area. All results in graphs are shown as a mean value ± SEM. For the statistical analyses we used Mann-Whitney U test (E, F, I, and J), t test (B and E), and for the distribution, Shapiro-Wilk normality test (all panels). The P value ˂ 0.05 was considered to have significance. Scale bars: 20 μm.

Similar articles

Cited by

References

    1. Rahib L, et al. Projecting cancer incidence and deaths to 2030: the unexpected burden of thyroid, liver, and pancreas cancers in the United States. Cancer Res. 2014;74(11):2913–2921. doi: 10.1158/0008-5472.CAN-14-0155. - DOI - PubMed
    1. Tuveson DA, et al. Endogenous oncogenic K-ras(G12D) stimulates proliferation and widespread neoplastic and developmental defects. Cancer Cell. 2004;5(4):375–387. doi: 10.1016/S1535-6108(04)00085-6. - DOI - PubMed
    1. Weber J, et al. In vivo functional screening for systems-level integrative cancer genomics. Nat Rev Cancer. 2020;20(10):573–593. doi: 10.1038/s41568-020-0275-9. - DOI - PubMed
    1. Demir IE, et al. Neural plasticity in pancreatitis and pancreatic cancer. Nat Rev Gastroenterol Hepatol. 2015;12(11):649–659. doi: 10.1038/nrgastro.2015.166. - DOI - PubMed
    1. Demir IE, et al. Future directions in preclinical and translational cancer neuroscience research. Nat Cancer. 2020;1(11):1027–1031. doi: 10.1038/s43018-020-00146-9. - DOI - PMC - PubMed

Publication types