. 2023 Oct 2;133(19):e168192.
doi: 10.1172/JCI168192.

HDAC11 inhibition triggers bimodal thermogenic pathways to circumvent adipocyte catecholamine resistance

Affiliations

HDAC11 inhibition triggers bimodal thermogenic pathways to circumvent adipocyte catecholamine resistance

Emma L Robinson et al. J Clin Invest. .

Abstract

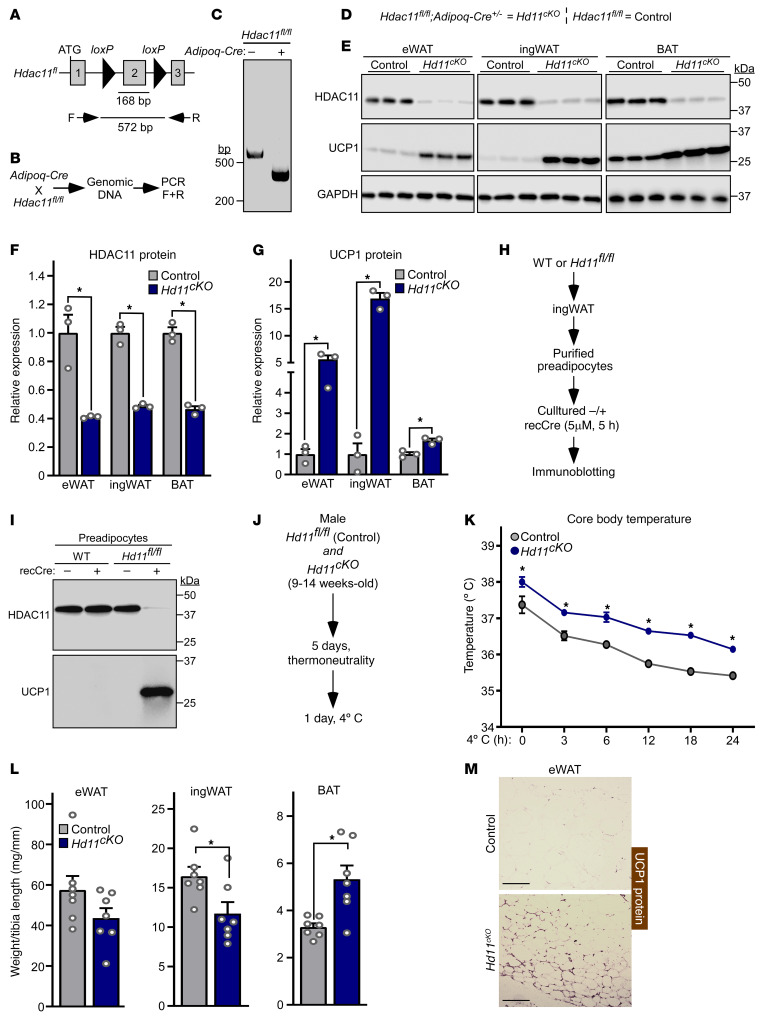
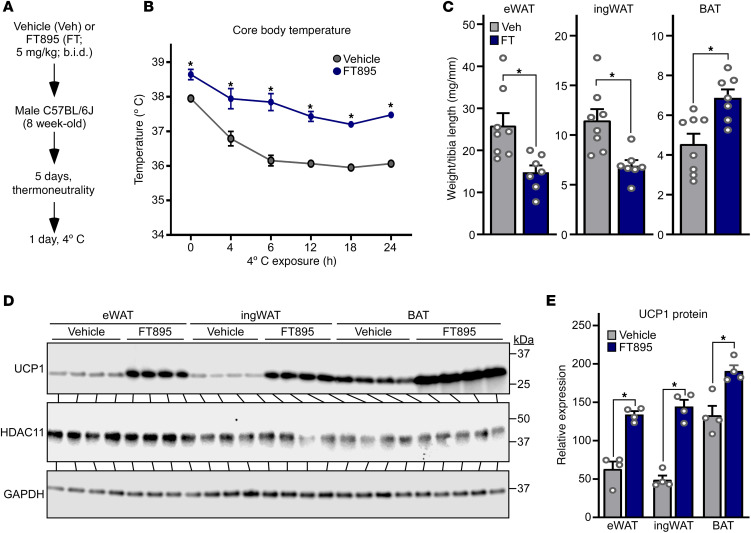
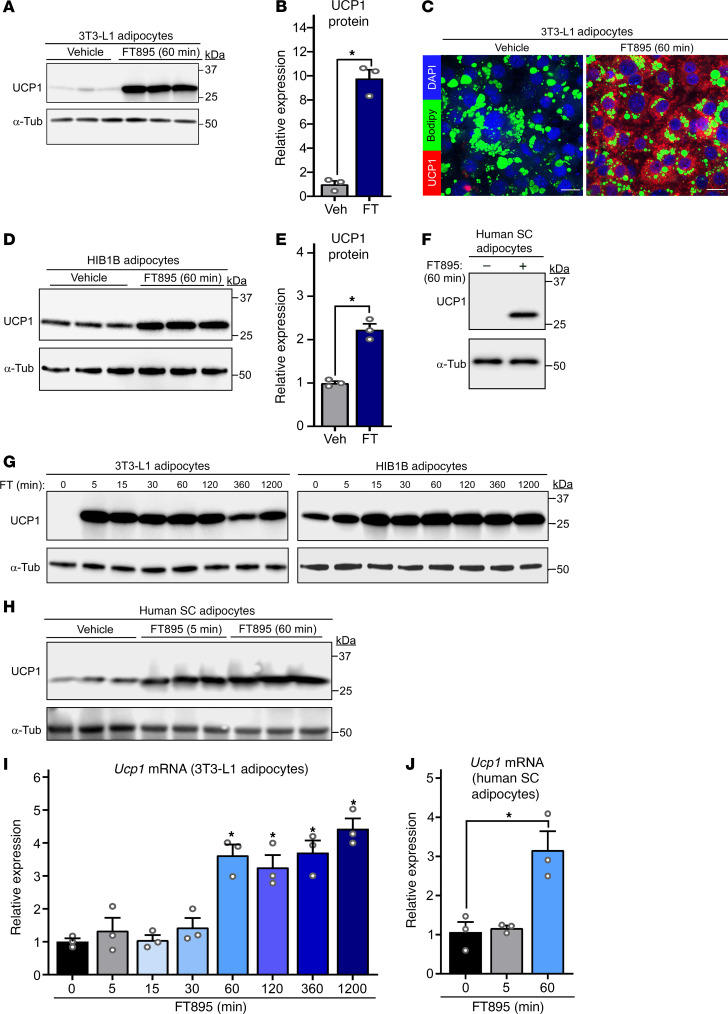
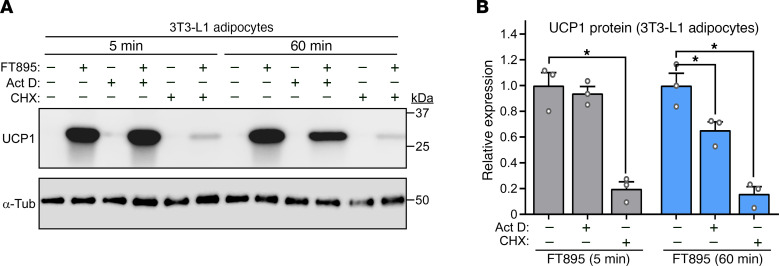
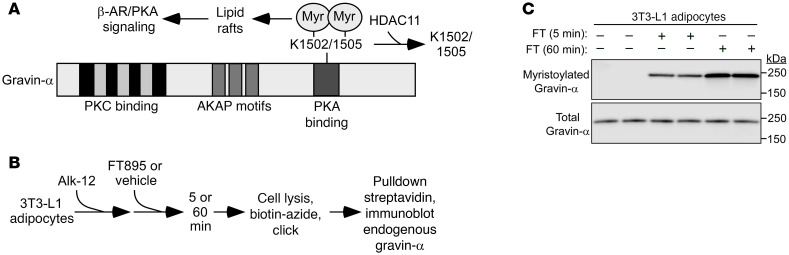
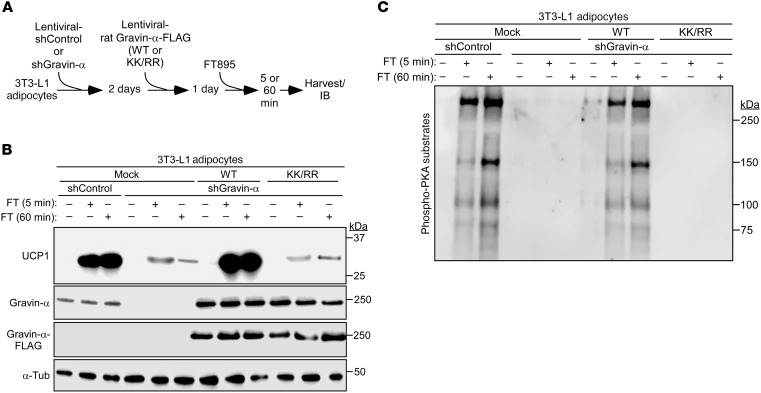
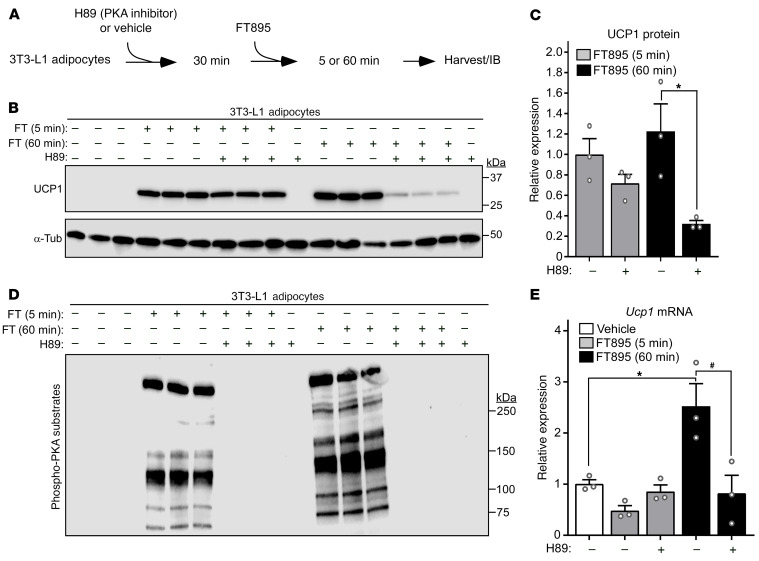
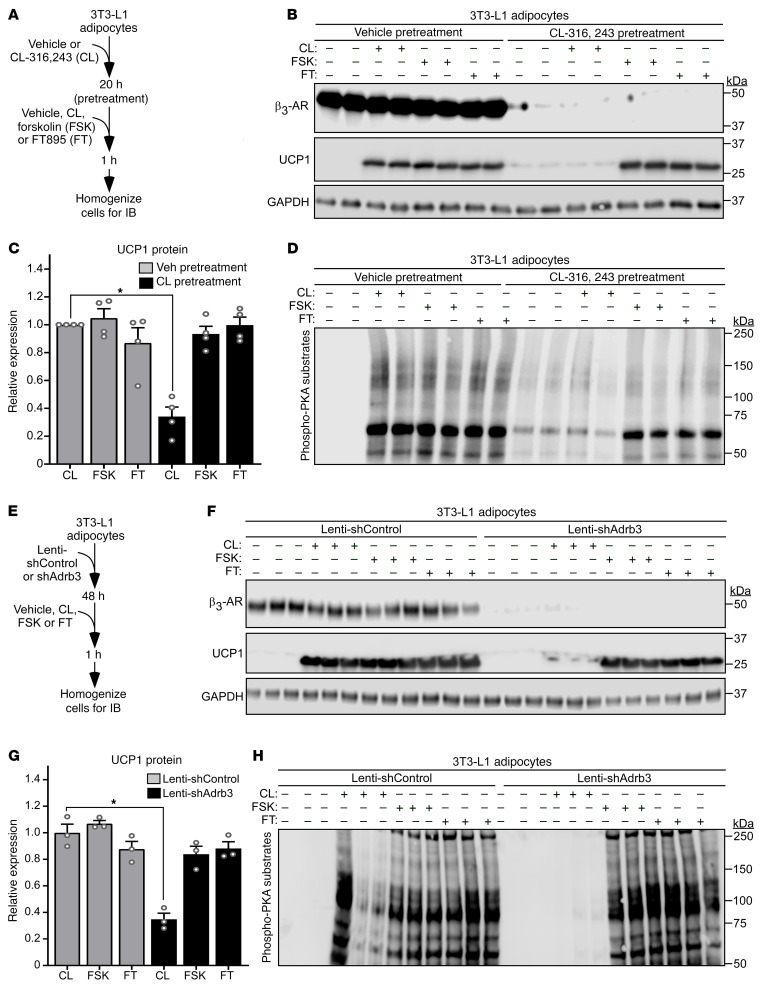
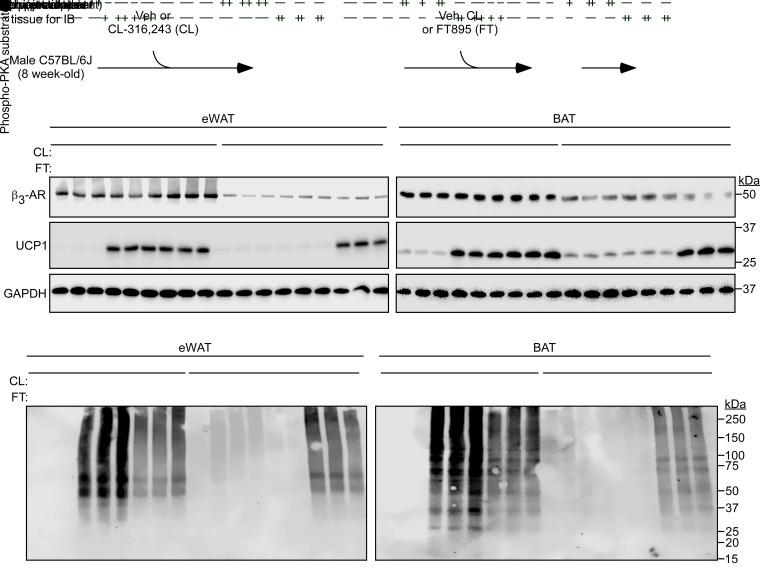
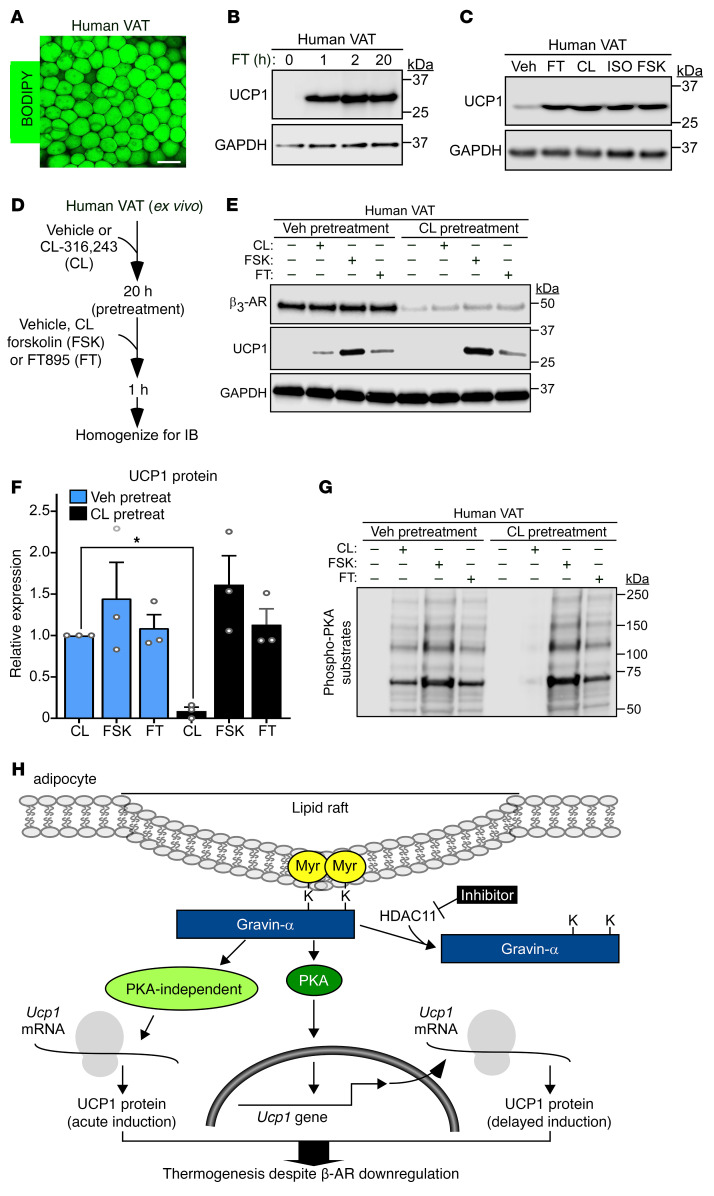
Stimulation of adipocyte β-adrenergic receptors (β-ARs) induces expression of uncoupling protein 1 (UCP1), promoting nonshivering thermogenesis. Association of β-ARs with a lysine-myristoylated form of A kinase-anchoring protein 12 (AKAP12, also known as gravin-α) is required for downstream signaling that culminates in UCP1 induction. Conversely, demyristoylation of gravin-α by histone deacetylase 11 (HDAC11) suppresses this pathway. Whether inhibition of HDAC11 in adipocytes is sufficient to drive UCP1 expression independently of β-ARs is not known. Here, we demonstrate that adipocyte-specific deletion of HDAC11 in mice leads to robust induction of UCP1 in adipose tissue (AT), resulting in increased body temperature. These effects are mimicked by treating mice in vivo or human AT ex vivo with an HDAC11-selective inhibitor, FT895. FT895 triggers biphasic, gravin-α myristoylation-dependent induction of UCP1 protein expression, with a noncanonical acute response that is posttranscriptional and independent of protein kinase A (PKA), and a delayed response requiring PKA activity and new Ucp1 mRNA synthesis. Remarkably, HDAC11 inhibition promotes UCP1 expression even in models of adipocyte catecholamine resistance where β-AR signaling is blocked. These findings define cell-autonomous, multimodal roles for HDAC11 as a suppressor of thermogenesis, and highlight the potential of inhibiting HDAC11 to therapeutically alter AT phenotype independently of β-AR stimulation.

Keywords: Adipose tissue; G protein–coupled receptors; Metabolism.


Conflict of interest statement

Conflict of interest: TAM is a cofounder of Myracle Therapeutics, is on the scientific advisory boards of Artemes Bio and Eikonizo Therapeutics, received funding from Italfarmaco for an unrelated project, and has a subcontract from Eikonizo Therapeutics related to an SBIR grant from the NIH (HL154959).

Figures

Figure 1
Figure 1. Adipocyte-specific knockout of HDAC11 in mice is sufficient to induce UCP1 protein expression and promote thermogenesis.
(A) Schematic representation of the Hdac11-floxed allele (Hdac11fl), with loxP sites flanking the 162 base pair (bp) exon 2; the predicted size of the resulting PCR product generated from genomic DNA and forward (F) and reverse (R) primers is shown. (B) Schematic representation of the cross between adiponectin promoter–driven Cre recombinase (Adipoq-Cre) transgenic mice and Hdac11fl/fl mice and the genomic DNA PCR approach to assessing excision of Hdac11 exon 2. (C) Genomic DNA PCR products from Hdac11fl/fl mice without (–) and with (+) the Adipoq-Cre transgene. (D) Diagram describing the genotype and definition of the adipocyte-specific conditional Hdac11-KO (Hd11cKO) and control Hd11fl/fl mice. (E) Immunoblot analysis of HDAC11 and UCP1 protein in epididymal white adipose tissue (eWAT), inguinal white adipose tissue (ingWAT), and interscapular brown adipose tissue (BAT) from 10- to 12-week-old control and Hdac11cKO mice. GAPDH served as a loading control; n = 3 biological replicates/group. (F and G) Densitometric analysis of HDAC11 and UCP1 protein in E, normalized to GAPDH and plotted relative to controls. Data are depicted as mean + SEM, with *P < 0.05 as determined by 2-tailed, unpaired t test. (H) Schematic representation of the cell culture experiment with recombinant Cre recombinase (recCre). (I) Immunoblot analysis of HDAC11 and UCP1 protein in preadipocytes. (J) Schematic representation of the 24-hour 4°C challenge experiment. (K) Core body temperature over time. Data are depicted as mean ± SEM, with *P < 0.05 vs. control mice at a given time as determined by 2-way ANOVA with Šidák’s multiple-comparison test; n = 7 biological replicates/group. (L) Adipose tissue weight, normalized to tibia length, determined after the 24-hour 4°C challenge. Data are depicted as mean + SEM, with *P < 0.05 as determined by 2-tailed, unpaired t test. (M) Immunohistochemistry of UCP1 protein in eWAT from mice sacrificed following the 24-hour 4°C challenge. Scale bars: 200 μm.
Figure 2
Figure 2. Selective pharmacological inhibition of HDAC11 in mice is sufficient to induce thermogenesis and UCP1 expression.
(A) Schematic representation of the 24-hour 4°C challenge experiment employing the selective HDAC11 inhibitor, FT895. (B) Core body temperature was determined at the indicated times. Data are depicted as mean ± SEM, with *P < 0.05 vs. vehicle-treated mice at a given time as determined by 2-way ANOVA with Šidák’s multiple-comparison test; vehicle (n = 8 biological replicates) and FT895 (n = 7 biological replicates). (C) Epididymal white adipose tissue (eWAT), inguinal white adipose tissue (ingWAT), and interscapular brown adipose tissue (BAT) weights, normalized to tibia length, determined upon necropsy after the 24-hour 4°C challenge. Data are depicted as mean + SEM, with *P < 0.05 as determined by 2-tailed, unpaired t test. (D) HDAC11 and UCP1 protein levels were assessed by immunoblotting with homogenates of AT obtained from mice sacrificed after the 24-hour 4°C challenge; n = 4 biological replicates/group. (E) Densitometric analysis of HDAC11 and UCP1 protein in D, normalized to GAPDH. Data are depicted as mean + SEM, with *P < 0.05 as determined by 2-tailed, unpaired t test.
Figure 3
Figure 3. HDAC11 inhibition triggers induction of UCP1 protein and mRNA expression in cultured adipocytes.
(A) Immunoblot analysis of UCP1 protein in 3T3-L1 white adipocytes treated with vehicle control or FT895 for 60 minutes; α-tubulin (α-Tub) served as a loading control; n = 3 technical replicates/condition. (B) Densitometric analysis of UCP1 expression in A, normalized to α-tubulin and plotted as fold-change relative to untreated controls. Data are presented as mean + SEM, with *P < 0.05 by 2-tailed, unpaired t test. (C) Indirect immunofluorescence analysis of UCP1 protein (red) in 3T3-L1 adipocytes treated with vehicle control or FT895 for 60 minutes. Nuclei and lipid droplets were costained using DAPI (blue) and BODIPY (green), respectively. Scale bars: 10 μm. (D) Immunoblot analysis with homogenates of HIB1B brown adipocytes treated with vehicle control or FT895 for 60 minutes; n = 3 technical replicates/condition. (E) Densitometric analysis of UCP1 expression in D, normalized to α-tubulin and plotted as fold-change relative to untreated controls. Data are presented as mean + SEM, with *P ≤ 0.05 by 2-tailed, unpaired t test. (F) Immunoblot analysis with homogenates of cultured human subcutaneous (SC) adipocytes treated with FT895 for 60 minutes. (G) Immunoblot analysis with homogenates of 3T3-L1 adipocytes (left) and HIB1B adipocytes (right) treated with FT895 for the indicated times. (H) Immunoblot analysis with homogenates of cultured human SC adipocytes treated with FT895 for 5 and 60 minutes; n = 3 technical replicates/condition. Ucp1 mRNA expression in 3T3-L1 adipocytes (I) or human SC adipocytes (J) treated with FT895 for the indicated times was determined by qRT-PCR. Data were normalized to 18S rRNA and are plotted as fold-change relative to the 0-minute point. Data are presented as mean + SEM, *P < 0.05 vs. the 0-minute point as determined by 1-way ANOVA with Tukey’s multiple-comparison test; n = 3 technical replicates/condition.
Figure 4
Figure 4. HDAC11 inhibition promotes adipocyte UCP1 expression through posttranscriptional and transcriptional mechanisms.
(A) 3T3-L1 adipocytes were pretreated with vehicle (–), actinomycin D (Act D), or cycloheximide (CHX) for 30 minutes prior to exposure to FT895 for 5 or 60 minutes. Cells were homogenized and immunoblotting was performed. (B) Densitometric analysis of UCP1 expression in A as well as from 2 additional independent experiments (blots not shown), normalized to α-tubulin and plotted as fold-change relative to FT895 treatment alone. Data are presented as mean + SEM, with *P < 0.05 as determined by 1-way ANOVA with Tukey’s multiple-comparison test.
Figure 5
Figure 5. HDAC11 inhibition promotes gravin-α myristoylation in adipocytes.
(A) Schematic representation of gravin-α protein structure, indicating the 2 lysine residues that are demyristoylated by HDAC11. Myristoylation of these 2 conserved lysines upon HDAC11 inhibition drives gravin-α:β-adrenergic receptor (β-AR) complexes into membrane lipid rafts, resulting in downstream protein kinase A (PKA) signaling. (B) Schematic depiction of the click chemistry experiment employing a myristic acid click tag (Alk-12) to determine whether acute HDAC11 inhibition with FT895 promotes gravin-α myristoylation. (C) Immunoblot analysis to detect endogenous myristoylated gravin-α and total gravin-α.
Figure 6
Figure 6. Biphasic UCP1 induction upon HDAC11 inhibition is dependent on gravin-α lysine myristoylation.
(A) Schematic depiction of the experiment to determine whether gravin-α and its myristoylation are required for induction of UCP1 protein expression following HDAC11 inhibition with FT895. (B) Immunoblot analysis to detect UCP1, total gravin-α, and FLAG-tagged gravin-α protein expression; α-tubulin (α-Tub) served as a loading control. (C) Immunoblot analysis with an antibody that recognizes proteins containing phospho-serine/threonine residues within a consensus PKA target site (RRXS*/T*).
Figure 7
Figure 7. Inhibition of HDAC11 stimulates PKA-independent and PKA-dependent induction of UCP1 expression.
(A) Schematic representation of the experiment to test the dependency of FT895-induced UCP1 expression on PKA signaling. (B) Immunoblot analysis of UCP1 protein expression, with α-tubulin (α-Tub) as a loading control; n = 3 technical replicates/condition. (C) Densitometric analysis of the UCP1 signal in B, normalized to α-Tub and depicted as fold-change relative to cells treated with FT895 alone. Data are presented as mean + SEM, with *P < 0.05 as determined by 2-tailed, unpaired t test. (D) 3T3-L1 homogenates were immunoblotted with an antibody that recognizes proteins containing phospho-serine/threonine residues within a consensus PKA target site (RRXS*/T*). (E) Ucp1 mRNA expression in 3T3-L1 adipocytes treated with FT895 for the indicated times in the absence or presence of H89 pretreatment was determined by qRT-PCR. Data were normalized to 18S rRNA and are plotted as fold-change relative to the vehicle treated cells. Data are presented as mean + SEM, *P < 0.05 vs. vehicle treatment and #P < 0.05 vs. 60-minute FT895 treatment without H89 as determined by 1-way ANOVA with Tukey’s multiple-comparison test; n = 3 technical replicates/condition.
Figure 8
Figure 8. HDAC11 inhibition promotes UCP1 expression and PKA signaling in cell-based models of catecholamine resistance.
(A) Schematic representation of the cell culture experiment to determine whether HDAC11 inhibition promotes adipocyte UCP1 expression and PKA signaling in the context of downregulated β3-adrenergic receptor (β3-AR) expression due to chronic agonist exposure. (B) Immunoblot analysis of 3T3-L1 cells pretreated with vehicle or the β3-AR agonist CL-316,243 (CL) for 20 hours followed by 1-hour treatment with vehicle (–), CL, the adenylyl cyclase activator forskolin (FSK), or FT895; n = 2 technical replicates/condition. (C) Densitometric analysis of UCP1 expression in B, and from 2 additional independent experiments (blots not shown), normalized to GAPDH and plotted as fold-change relative to CL treatment alone. Expression of UCP1 with vehicle pretreatment + CL is set to 1 within each independent experiment. Data are presented as mean + SEM, with *P < 0.05 as determined by 1-way ANOVA with Tukey’s multiple-comparison test. (D) These same samples were independently immunoblotted with an antibody that recognizes proteins containing phospho-serine/threonine residues within a consensus PKA target site (RRXS*/T*). (E) Schematic representation of the cell culture experiment to determine whether HDAC11 inhibition promotes adipocyte UCP1 expression and PKA signaling in the context of catecholamine resistance due to knockdown of β3-AR expression. (F) Immunoblot analysis of the indicated proteins in homogenates of 3T3-L1 cells; n = 3 technical replicates/condition. (G) Densitometric analysis of UCP1 expression in F normalized to GAPDH and plotted as fold-change relative to Lenti-shAdrb3 + CL. Data are presented as mean + SEM, with *P < 0.05 determined by 1-way ANOVA with Tukey’s multiple-comparison test. (H) Immunoblot analysis with the anti–phospho-PKA-substrate antibody.
Figure 9
Figure 9. HDAC11 inhibition bypasses adipose tissue catecholamine resistance in vivo.
(A) Schematic representation of the in vivo experiment to determine whether HDAC11 inhibition promotes UCP1 expression and PKA signaling in the context of downregulated β3-adrenergic receptor (β3-AR) expression in adipose tissue. (B and C) Immunoblot analysis of the indicated proteins in homogenates of epididymal white adipose tissue (eWAT) and interscapular brown adipose tissue (BAT) in mice pretreated with vehicle (Veh) or CL-316,243 (CL) for 12 hours followed by 1-hour treatment with vehicle (–), CL, or FT895 (FT); n = 3 biological replicates/condition. (D and E) These same samples were independently immunoblotted with an antibody that recognizes proteins containing phospho-serine/threonine residues within a consensus PKA target site (RRXS*/T*).
Figure 10
Figure 10. Therapeutic potential of inhibiting HDAC11 to circumvent adipocyte catecholamine resistance in humans.
(A) Whole-mount image of human visceral adipose tissue (VAT) stained with BODIPY. Scale bar: 100 μm. (B) Immunoblot analysis of UCP1 and GAPDH. (C) Immunoblot analysis of UCP1 and GAPDH in human VAT treated ex vivo with FT895 (FT; 1 hour); the β3-AR agonist, CL-316,243 (CL; 3 hours); the nonselective β-AR agonist, isoproterenol (ISO; 2 hours); or the adenylyl cyclase activator, forskolin (FSK; 2 hours). (D) Schematic representation of the ex vivo experiment. (E) Immunoblot analysis of human VAT pretreated ex vivo with vehicle or CL for 20 hours followed by exposure to vehicle (–), CL, FSK, or FT for 1 additional hour. (F) Densitometric analysis of UCP1 expression in E, and from 2 additional independent experiments (blots not shown), normalized to GAPDH and plotted as fold-change relative to CL treatment alone. Expression of UCP1 with vehicle pretreatment + CL is set to 1 within each independent experiment; n = 3 different patient samples/condition. Mean + SEM, with *P < 0.05, as determined by 1-way ANOVA with Tukey’s multiple-comparison test. (G) Immunoblotting with the anti–phospho-PKA substrate antibody. (H) A model for circumventing adipocyte catecholamine resistance through HDAC11 inhibition. HDAC11 normally demyristoylates 2 lysine residues in gravin-α, blocking the downstream signaling needed for UCP1 induction. When gravin-α is myristoylated on these lysines, such as upon HDAC11 inhibition with FT895, there is acute (5-minute) induction of UCP1 protein expression through a posttranscriptional mechanism that does not require PKA signaling, and there is delayed (60-minute) induction of UCP1 protein expression that requires new Ucp1 mRNA synthesis and is dependent of PKA signaling. HDAC11 inhibition drives UCP1 protein expression even in the context of downregulated β-adrenergic receptors, suggesting the possibility of overcoming adipocyte catecholamine resistance in patients with metabolic disease through the use of HDAC11 inhibitors.

Update of

Similar articles

Cited by

References

    1. Hales CM, et al. Prevalence of obesity among adults and youth: United States, 2015-2016. NCHS Data Brief. 2017;(288):1–8. - PubMed
    1. Hales CM, et al. Prevalence of obesity and severe obesity among adults: United States, 2017-2018. NCHS Data Brief. 2020;(360):1–8. - PubMed
    1. Drucker DJ. GLP-1 physiology informs the pharmacotherapy of obesity. Mol Metab. 2022;57:101351. doi: 10.1016/j.molmet.2021.101351. - DOI - PMC - PubMed
    1. Kusminski CM, et al. Targeting adipose tissue in the treatment of obesity-associated diabetes. Nat Rev Drug Discov. 2016;15(9):639–660. doi: 10.1038/nrd.2016.75. - DOI - PubMed
    1. Pfeifer A, Hoffmann LS. Brown, beige, and white: the new color code of fat and its pharmacological implications. Annu Rev Pharmacol Toxicol. 2015;55:207–227. doi: 10.1146/annurev-pharmtox-010814-124346. - DOI - PubMed

Publication types