. 2023;15(1):647-664.
doi: 10.1159/000532063. Epub 2023 Aug 22.

MicroRNA-9-1 Attenuates Influenza A Virus Replication via Targeting Tankyrase 1

Affiliations

MicroRNA-9-1 Attenuates Influenza A Virus Replication via Targeting Tankyrase 1

Gayan Bamunuarachchi et al. J Innate Immun. 2023.

Abstract

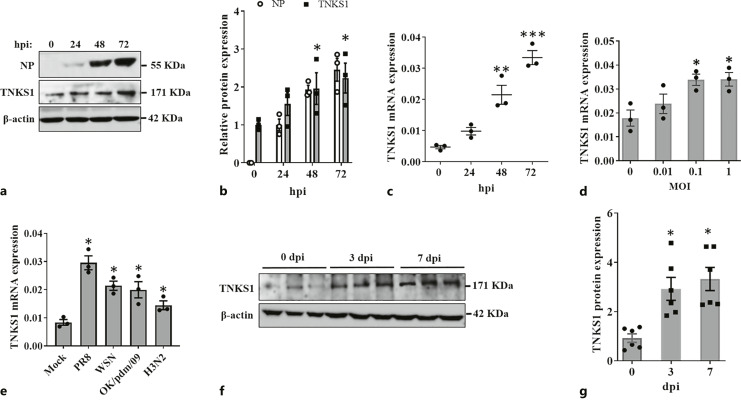
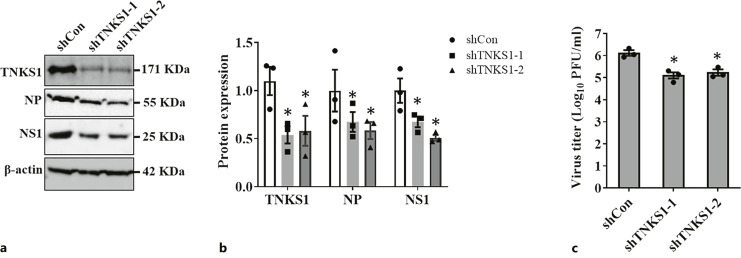
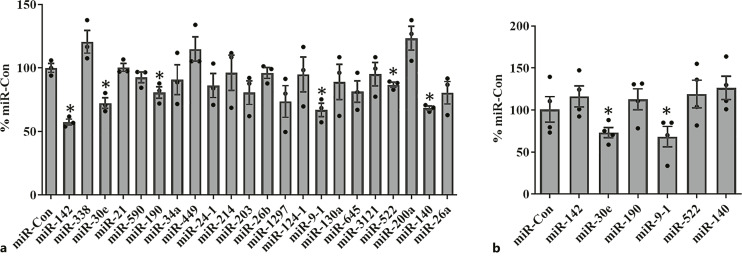
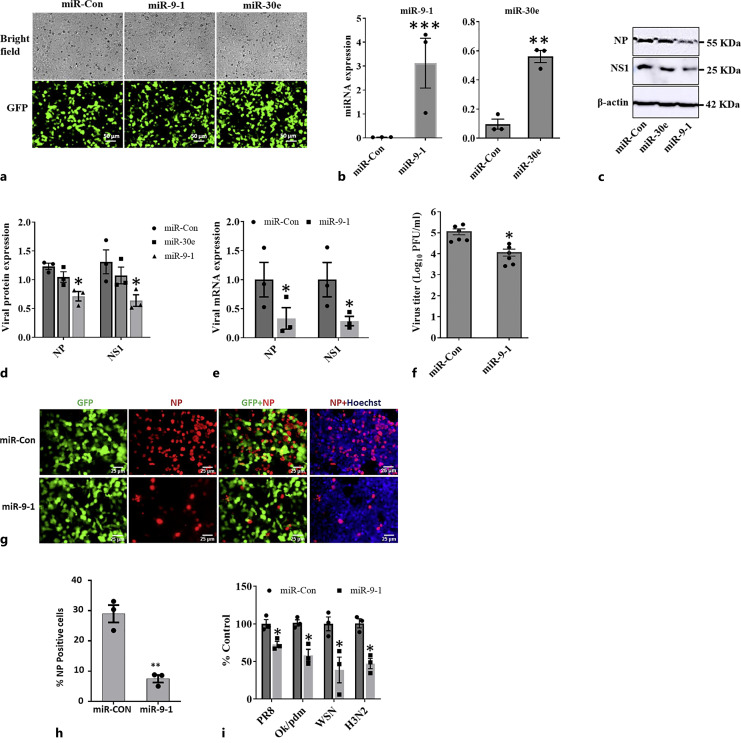
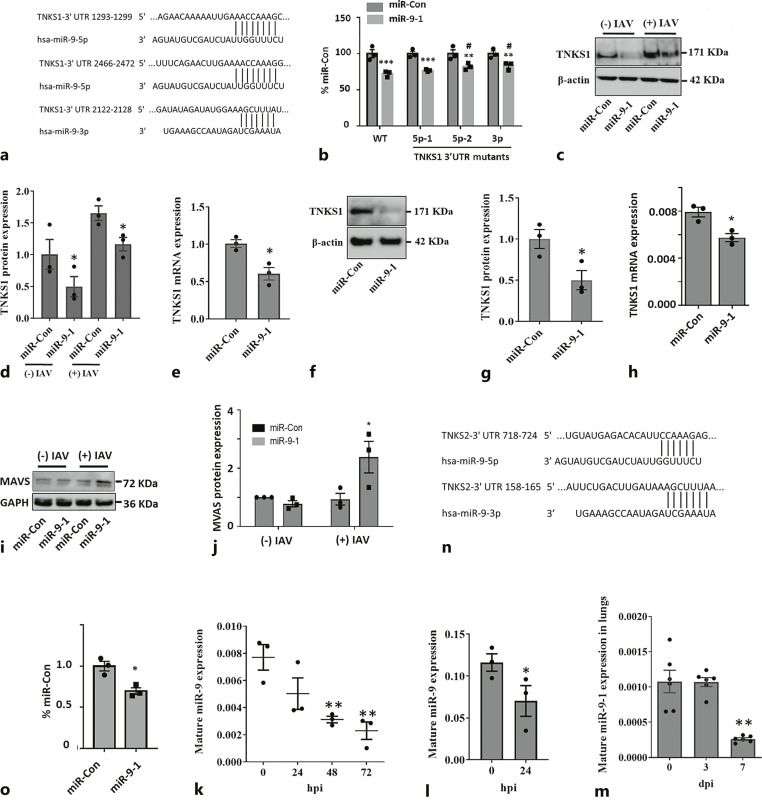
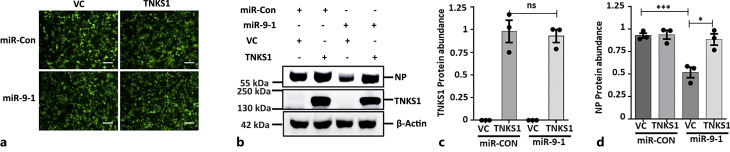
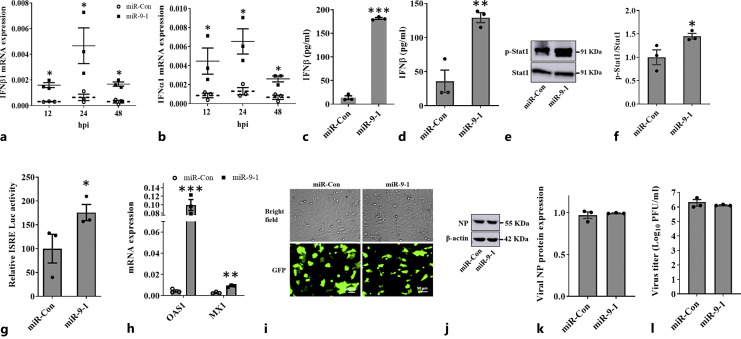
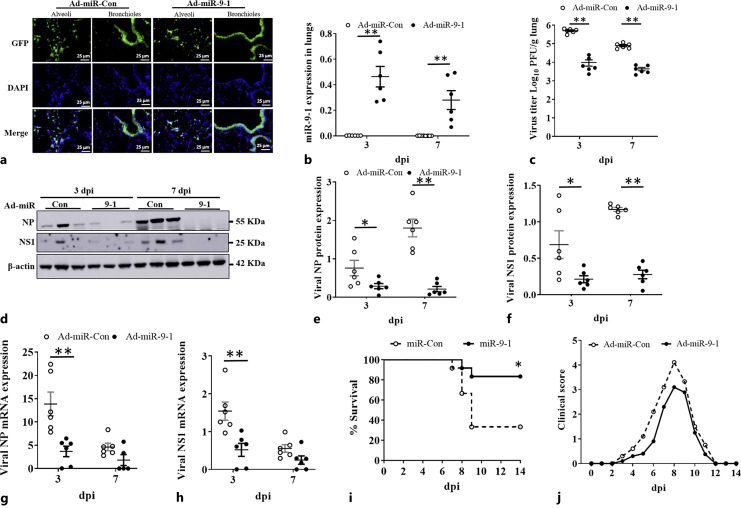
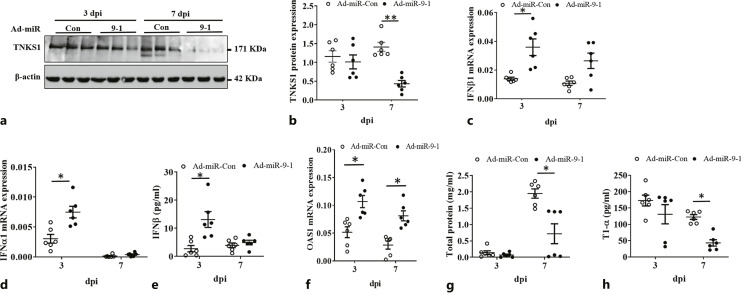
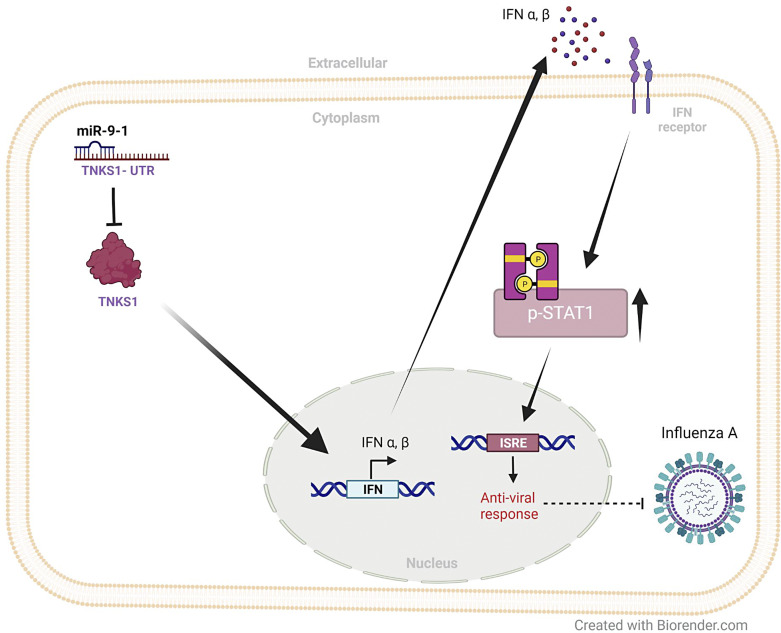
An unstable influenza genome leads to the virus resistance to antiviral drugs that target viral proteins. Thus, identification of host factors essential for virus replication may pave the way to develop novel antiviral therapies. In this study, we investigated the roles of the poly(ADP-ribose) polymerase enzyme, tankyrase 1 (TNKS1), and the endogenous small noncoding RNA, miR-9-1, in influenza A virus (IAV) infection. Increased expression of TNKS1 was observed in IAV-infected human lung epithelial cells and mouse lungs. TNKS1 knockdown by RNA interference repressed influenza viral replication. A screen using TNKS1 3'-untranslation region (3'-UTR) reporter assays and predicted microRNAs identified that miR-9-1 targeted TNKS1. Overexpression of miR-9-1 reduced influenza viral replication in lung epithelial cells as measured by viral mRNA and protein levels as well as virus production. miR-9-1 induced type I interferon production and enhanced the phosphorylation of STAT1 in cell culture. The ectopic expression of miR-9-1 in the lungs of mice by using an adenoviral viral vector enhanced type I interferon response, inhibited viral replication, and reduced susceptibility to IAV infection. Our results indicate that miR-9-1 is an anti-influenza microRNA that targets TNKS1 and enhances cellular antiviral state.

Keywords: Influenza virus; MicroRNA; Poly(ADP-ribose) polymerase; Type I interferon.


Conflict of interest statement

The authors have no conflicts of interest.

Figures

Fig. 1.
Fig. 1.
Influenza virus increases TNKS1 expression. a, b Human lung epithelial A549 cells were infected with A/PR/8/34 at an MOI of 0.01 for various times (0, 24, 48, and 72 h postinfection or hpi). Viral NP and TNKS1 protein expression levels were determined by Western blot and normalized to β-actin. a Representative Western blots. b Quantitation of Western blots. The results for TNKS1 and NP were expressed as a ratio to 0 hpi and 24 hpi, respectively. c, d A549 cells were infected with A/PR/8/34 at an MOI of 0.01 for 0, 24, 48, and 72 h or at different MOI for 24 h. TNKS1 mRNA expression was measured by real-time PCR and normalized to β-actin. e A549 cells were infected with A/PR/8/34 (MOI 0.01), A/WSN/33 (MOI 0.001), pdm/OK/09 (MOI 0.01), and H3N2 A/OK/309/06 (MOI 0.001) for 48 h. Relative TNKS1 mRNA expression was measured by real-time PCR and normalized to β-actin. f, g TNKS1 protein expression levels in the lungs of mice infected with A/PR/8/34 (250 PFU) at 3 and 7 days postinfection (dpi) were measured by Western blot and expressed as a ratio to 0 dpi. The results shown are the mean ± SE. N = 3 (cells) or 6 (animals). *p < 0.05, **p < 0.01 and ***p < 0.001 versus 0 hpi or 0 dpi, MOI 0 or mock. One-way ANOVA, followed by Dunnett’s pairwise comparison.
Fig. 2.
Fig. 2.
Knockdown of TNKS1 inhibits IAV replication. HEK293 cells were transfected with a TNKS1 shRNA-1, -2 (shTNKS1-1 and shTNKS1-2) or a control (shCon) plasmid and then infected with A/PR/8/34 at an MOI of 0.01 for 48 h. a, b The protein levels of TNKS1, viral NP and NS1 were determined by Western blot, normalized to β-actin, and expressed as a ratio to shCon. a Representative Western blots. b Quantitation of Western blots. c Virus titers in the media were measured by the plaque assay. The results shown are the mean ± SE of 3 independent experiments. *p < 0.05 versus shCon. One-way ANOVA, followed by Sidak’s pairwise comparison.
Fig. 3.
Fig. 3.
miRNA screening for targeting TNKS1 and anti-influenza activities. a A549 cells were co-transfected with a pmirGLO-firefly-TNKS1-3′-UTR reporter plasmid and a miRNA expression pENTR plasmid or a miRNA control vector (miR-Con) for 24 h, and dual luciferase activities were measured. b A549 cells were co-transfected with a miRNA or miR-Con expression pENTR plasmid (100 ng) and the IAV firefly luciferase reporter plasmid vNP-luc/pHH21 (20 ng) and pRL-TK Renilla plasmid (5 ng) for 24 h. The cells were then infected with A/PR/8/34 for 48 h, and dual luciferase activities were measured. Relative firefly luciferase activities were normalized to Renilla luciferase activities and expressed as a percentage of miR-Con. The results shown are the mean ± SE of 3 or 4 independent experiments. *p < 0.05 versus miR-Con, one-way ANOVA, followed by Dunnett’s pairwise comparison.
Fig. 4.
Fig. 4.
Inhibition of IAV replication by miR-9-1. HEK293 cells were transfected with a miRNA (miR-9-1 or miR-30e) or miR-Con expression pENTR plasmid for 24 h and then infected with A/PR/8/34 at an MOI of 0.01 for 48 h. a Representative GPF images. Scale bars, 50 μm. b miRNA expression as determined by real-time PCR and normalized to U6. c, d The protein expression levels of viral NP and NS1 were determined by Western blot and normalized to β-actin. c Representative Western blots. d Quantitation of Western blots. e The mRNA expression levels of viral NP and NS1 were determined by real-time PCR, normalized to β-actin, and expressed as a ratio to miR-Con. f Virus titers in the culture media were determined by plaque assay. g GFP images and NP staining. Scale bar: 25 μm. h The quantitation of NP-positive cells. i HEK293 cells were transfected with a miR-9-1 or miR-Con expression pENTR plasmid (100 ng), the IAV firefly luciferase reporter plasmid vNP-luc/pHH21 (20 ng), and pRL-TK Renilla plasmid (5 ng) for 24 h. The cells were then infected with A/PR/8/34 (MOI 0.01), A/WSN/33 (MOI 0.005), pdm/OK/09 (MOI 0.25), and H3N2 A/OK/309/06 (MOI 0.005) for 48 h. Firefly luciferase activities were normalized to Renilla luciferase activity and expressed as a percentage of miR-Con. The results shown are the mean ± SE of 3–6 independent experiments. *p < 0.05, **p < 0.01, and ***p < 0.001 versus miR-Con, Student’s t test for (b), (e), (f), (h), and (i) and two-way ANOVA followed by Sidak’s pairwise comparison for (d).
Fig. 5.
Fig. 5.
TNKS1 is a target of miR-9-1. a The putative binding sites of miR-9-5p and miR-9-3p in the 3′-UTR of the human TNKS1 gene. b A549 cells were co-transfected with a pmirGLO-firefly-TNKS1-3′-UTR wild-type (WT) or miR-9-5p or -3p binding site mutant reporter plasmid and a miRNA expression pENTR plasmid or a miRNA control vector (miR-Con) for 24 h and dual luciferase activities were measured. c–e HEK293 cells were transfected with a miR-9-1 or a miR-Con pENTR expression plasmid for 24 h and then infected with and without A/PR/8/34 at an MOI of 0.01 for 48 h. TNKS1 protein levels (c, representative blots and d, quantitation) were measured by Western blot, normalized to β-actin, and expressed as a ratio to miR-Con without IAV infection. e TNKS1 mRNA levels in the cells without IAV infection were measured by real-time PCR, normalized to β-actin and expressed as a ratio to miR-Con. f–j A549 cells were transduced with a miR-9-1 or a miR-Con lentivirus for 72 h and then infected with and without A/PR/8/34 at an MOI of 0.01 for 48 h. TNKS1 protein (f, representative blots and g, quantitation) and MAVS levels (i, representative blots and j, quantitation) were measured by Western blot, normalized to normalized to β-actin or GAPDH and expressed as a ratio to miR-Con without A/PR/8/34 infection. h TNKS1 mRNA levels were measured by real-time PCR and expressed as a ratio of TNKS1/GAPDH. n A549 cells were infected with A/PR/8/34 at an MOI of 0.01 for 0, 24, 48, and 72 h. o HBTEC cells were infected with A/PR/8/34 at an MOI of 0.1 for 24 h. k C57BL/6 mice were infected with A/PR/8/34 (250 PFU) for 3 and 7 days. The endogenous mature miR-9 levels were determined by real-time PCR and normalized to U6. l The putative binding sites of miR-9-5p and miR-9-3p in the 3′-UTR of the human TNKS2 gene. m A549 cells were co-transfected with a pmirGLO-firefly-TNKS2-3′-UTR reporter plasmid and a miRNA expression pENTR plasmid or a miRNA control vector (miR-Con) for 24 h and dual luciferase activities were measured. The results shown are the mean ± SE. N = 3 for cells and N = 6 for mice. *p < 0.05, **p < 0.01, and ***p < 0.001 versus miR-Con, 0 hpi or 0 dpi. #p < 0.05 versus WT-miR-9-1. Student’s t test for (d), (e), (g), (h), (o), (k), and (m). One-way ANOVA, followed by Fisher’s LSD for (b) or Dunnett’s pairwise comparison for (n) and (k), and two-way ANOVA, followed by Sidak’s multiple comparison test (j).
Fig. 6.
Fig. 6.
TNKS1 overexpression rescues the miR-9-1-mediated repression of IAV infection. HEK293T cells were transfected with 625 ng of miR-9-1 or its control, miR-Con pENTR plasmid, and/or 625 ng of PLSJH-TNKS1 or its control, VC. At 24 h post-transfection, cells were infected with a A/PR/8/34 at an MOI of 0.01 for 48 h. a The transfection efficiency of miR-9-1 expression plasmid or miR-Con was shown by GFP fluorescence at 24 h post-transfection. Scale bar: 50 μm. b TNKS1-Flag and viral protein NP were determined by Western blotting, with β-actin as an internal control. c, d. The relative amounts of TNKS1-Flag and viral protein NP protein levels were quantitated and normalized to β-actin. The results shown are the mean ± SE of 3 independent experiments. *p < 0.05, and ***p < 0.001 (one‐way ANOVA, followed by Tukey’s multiple comparisons test). ns, not significant.
Fig. 7.
Fig. 7.
miR-9-1 activates an antiviral state. a, b HEK293 were transfected with a miR-9-1 or a miR-Con pENTR expression plasmid for 24 h and infected with A/PR/8/34 at an MOI of 0.01 for 12, 24, and 48 h. The mRNA expression levels of IFNβ1 and IFNα1 were determined by real-time PCR and normalized to β-actin. c, d IFNβ production in the media of HEK293 and A549 cells infected with A/PR/8/34 at an MOI of 0.01 for 24 h were measured by ELISA. e, f HEK293 cells were transfected with a miR-9-1 or a miR-Con pENTR expression plasmid for 24 h and then infected with A/PR/8/34 at an MOI of 0.01 for 48 h. The protein expression levels of p-Stat1 and Stat1 were determined by Western blot and expressed as a ratio of p-Stat1 to Stat1 and then a ratio to miR-Con. g HEK293 cells were co-transfected with a miR-9-1 or a miR-con expression pENTR plasmid, and an ISRE-Luc reporter vector for 24 h and then infected with A/PR/8/34 at an MOI of 0.01 for 48 h. Dual luciferase activities were measured and the firefly activities were normalized to Renilla luciferase activities. The results were expressed as a percentage of miR-Con. h HEK293 cells were infected with A/PR/8/34 at an MOI of 0.01 for 48 h. The mRNA expression levels of OAS1 and MX1 were measured by real-time PCR and normalized to β-actin. i–l Vero cells were transfected with a miR-9-1 or a miR-Con expression pENTR plasmid for 24 h and then infected with A/PR/8/34 at an MOI of 0.01 for 48 h. GFP images are shown in (i). Viral NP protein levels (j, representative blots and k, quantitation) and virus titers (l) were measured by Western blot and plaque assay, respectively. The results shown are the mean ± SE of 3 independent experiments. *p < 0.05, **p < 0.01, and ***p < 0.001 versus miR-Con. Two-way ANOVA, followed by Tukey’s pairwise comparison for (a) and (b); Student’s t test for (c), (d), (f), (g), (h), (k), and (l).
Fig. 8.
Fig. 8.
Adenovirus expressing miR-9-1 suppresses IAV infection in vivo and increases survival of mice against IAV infection. An adenovirus expressing miR-9-1 (Ad-miR-9-1) or miR-Con (Ad-miR-Con) was delivered intratracheally into the lungs of male and female mice. Two days after, the mice were infected intranasally with A/PR/8/34 (160 PFU/mouse). The samples were collected at 3 and 7 days postinfection (dpi). a GFP expression in the lungs was determined by immunofluorescent staining in paraformaldehyde-fixed lung tissue sections at 3 dpi. Scale bar, 25 μm. b miR-9-1 levels in the lung tissues were measured by real-time PCR and normalized to U6 snRNA. c The virus titers were determined by plaque assay. df Viral NP and NS1 protein levels in the lung tissues were determined by Western blot and normalized to β-actin. g, h The mRNA levels of viral NP and NS1 were determined by real-time PCR and normalized to β-actin. For (b, c), (e–h), the results of 6 animals (3 males and 3 females) per group are displayed as the mean ± SE. *p < 0.05, **p < 0.01, two-way ANOVA, followed by Sidak’s multiple comparisons.i, j Two days after Ad-miR-9-1 or Ad-miR-con delivery, mice (female, N = 12 per group) were intranasally infected with A/PR/8/34 (×1 MLD50). Survival curve and clinical scores are shown in (i) and (j). *p < 0.05 versus Ad-miR-Con, Mantel-Cox test with Bonferroni-corrected threshold.
Fig. 9.
Fig. 9.
miR-9-1 activates the antiviral state and reduces lung injury in mice. An adenovirus expressing miR-9-1 (Ad-miR-9-1) or miR-Con (Ad-miR-Con) was delivered intratracheally into the lungs of male and female mice. Two days after, the mice were infected intranasally with A/PR/8/34 (160 PFU/mouse). The samples were collected at 3 and 7 days postinfection (dpi). a, b TNKS1 protein levels were measured by Western blot and normalized to β-actin. c, d The mRNA levels of IFNβ1 and IFNα1 were measured by real-time PCR and normalized to β-actin. e IFNβ production in BALF was measured by ELISA. f OAS1 mRNA levels were measured by real-time PCR and normalized to β-actin. g Total proteins in BALF were measured by DC protein assay. h T1-α protein amounts in BALF were measured by ELISA. The results shown are the mean ± SE. N = 6 (3 males and 3 females). *p < 0.05 and **p < 0.01, two-way ANOVA, followed by Sidak’s multiple comparisons.
Fig. 10.
Fig. 10.
A schematic overview of the current study.

Similar articles

Cited by

References

    1. Center of Disease Control . Disease burden of influenza; 2020. Available from: https://www.cdc.gov/flu/about/burden/index.html.
    1. Taubenberger JK, Morens DM. 1918 Influenza: the mother of all pandemics. Emerg Infect Dis. 2006;12(1):15–22. 10.3201/eid1201.050979. - DOI - PMC - PubMed
    1. Krammer F, Smith GJD, Fouchier RAM, Peiris M, Kedzierska K, Doherty PC, et al. . Influenza. Nat Rev Dis Primers. 2018;4(1):3. 10.1038/s41572-018-0002-y. - DOI - PMC - PubMed
    1. Bouvier NM, Palese P. The biology of influenza viruses. Vaccine. 2008;26(Suppl 4):D49–53. 10.1016/j.vaccine.2008.07.039. - DOI - PMC - PubMed
    1. Principi N, Camilloni B, Alunno A, Polinori I, Argentiero A, Esposito S. Drugs for influenza treatment: is there significant news? Front Med. 2019;6:109. 10.3389/fmed.2019.00109. - DOI - PMC - PubMed

Publication types