. 2023 Sep 14;186(19):4134-4151.e31.
doi: 10.1016/j.cell.2023.07.035. Epub 2023 Aug 21.

Brain-wide representations of behavior spanning multiple timescales and states in C. elegans

Affiliations

Brain-wide representations of behavior spanning multiple timescales and states in C. elegans

Adam A Atanas et al. Cell. .

Abstract

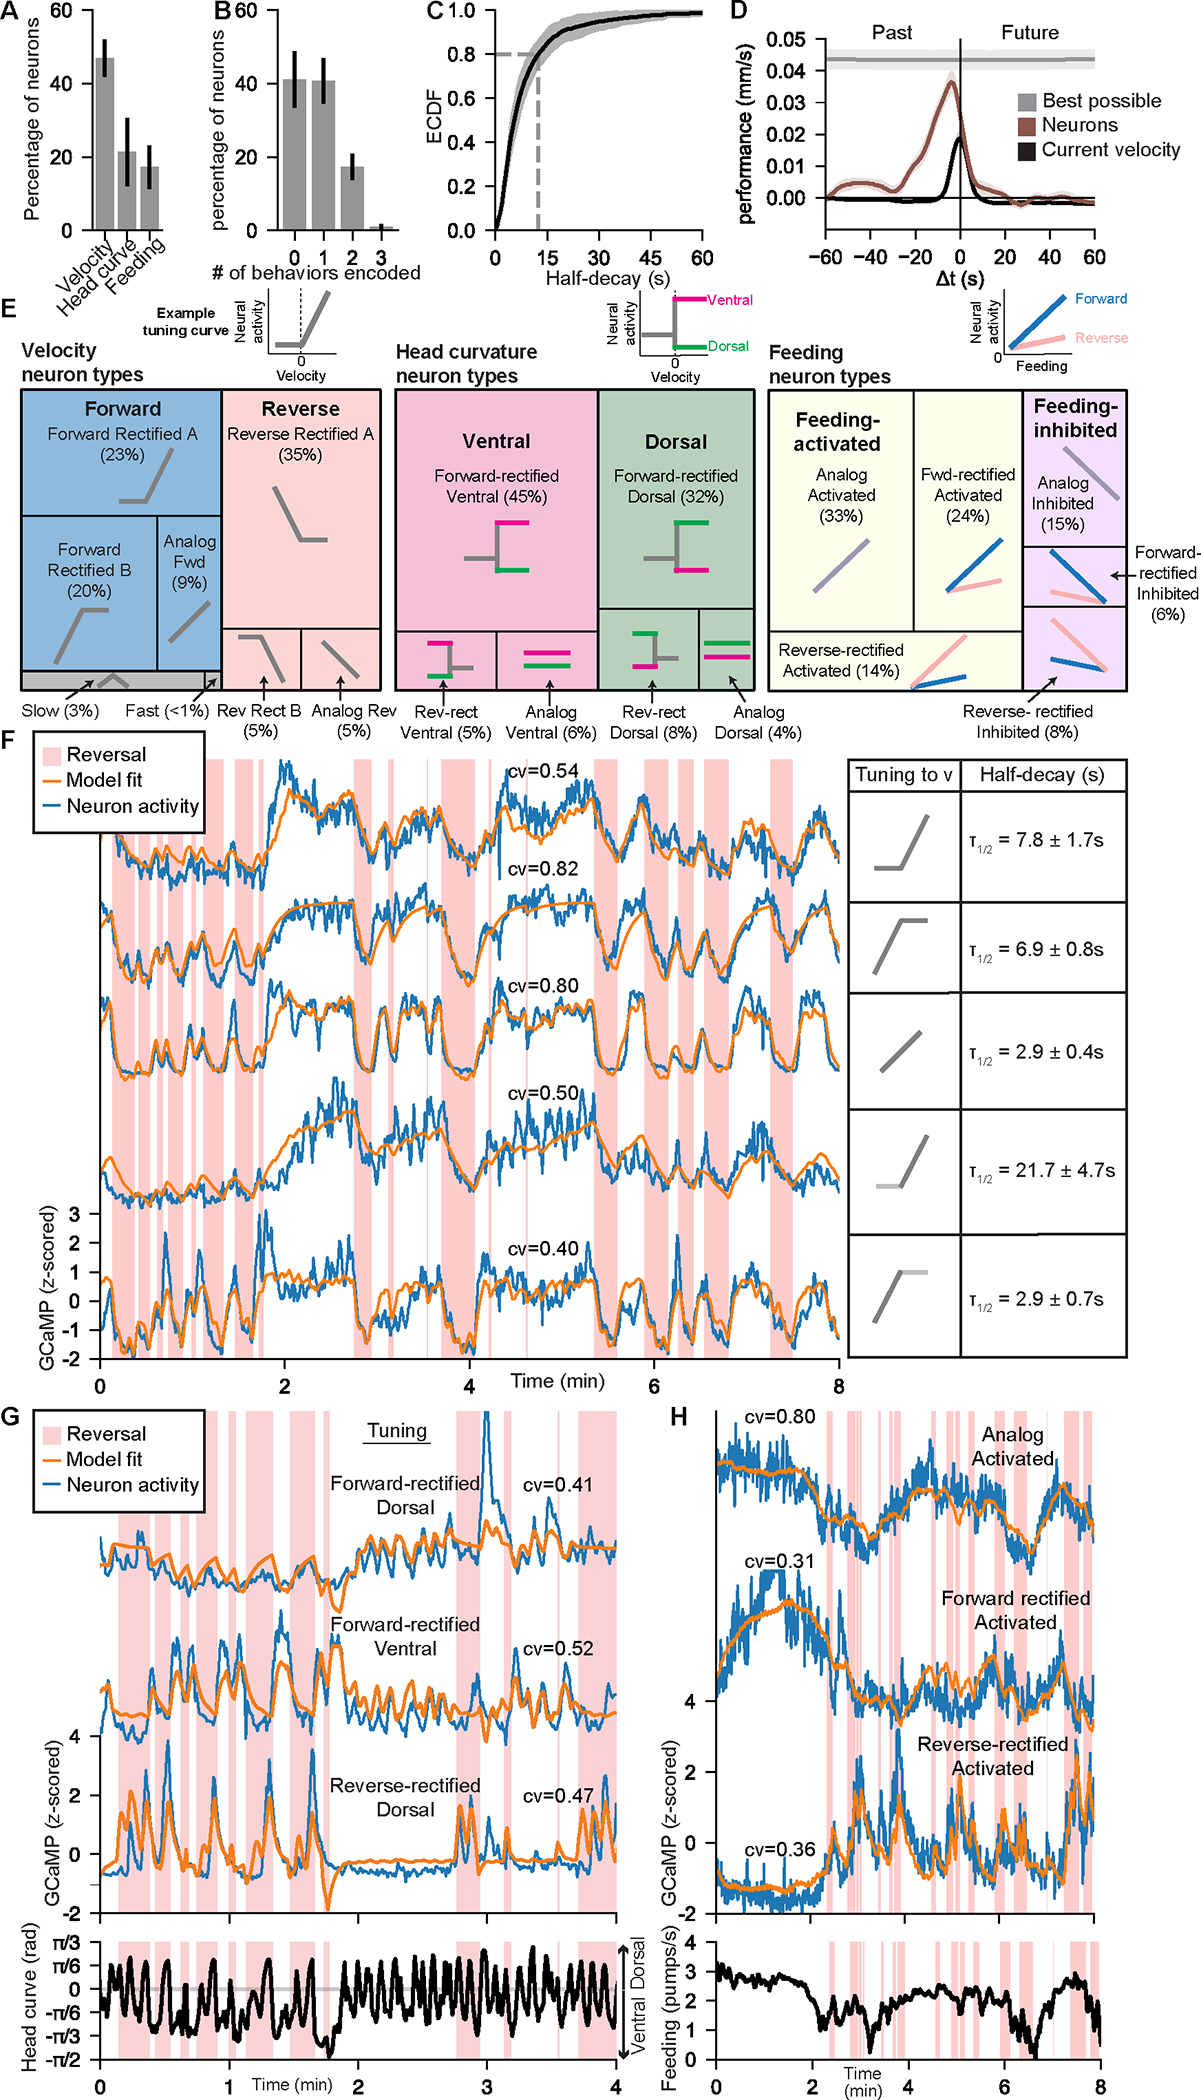
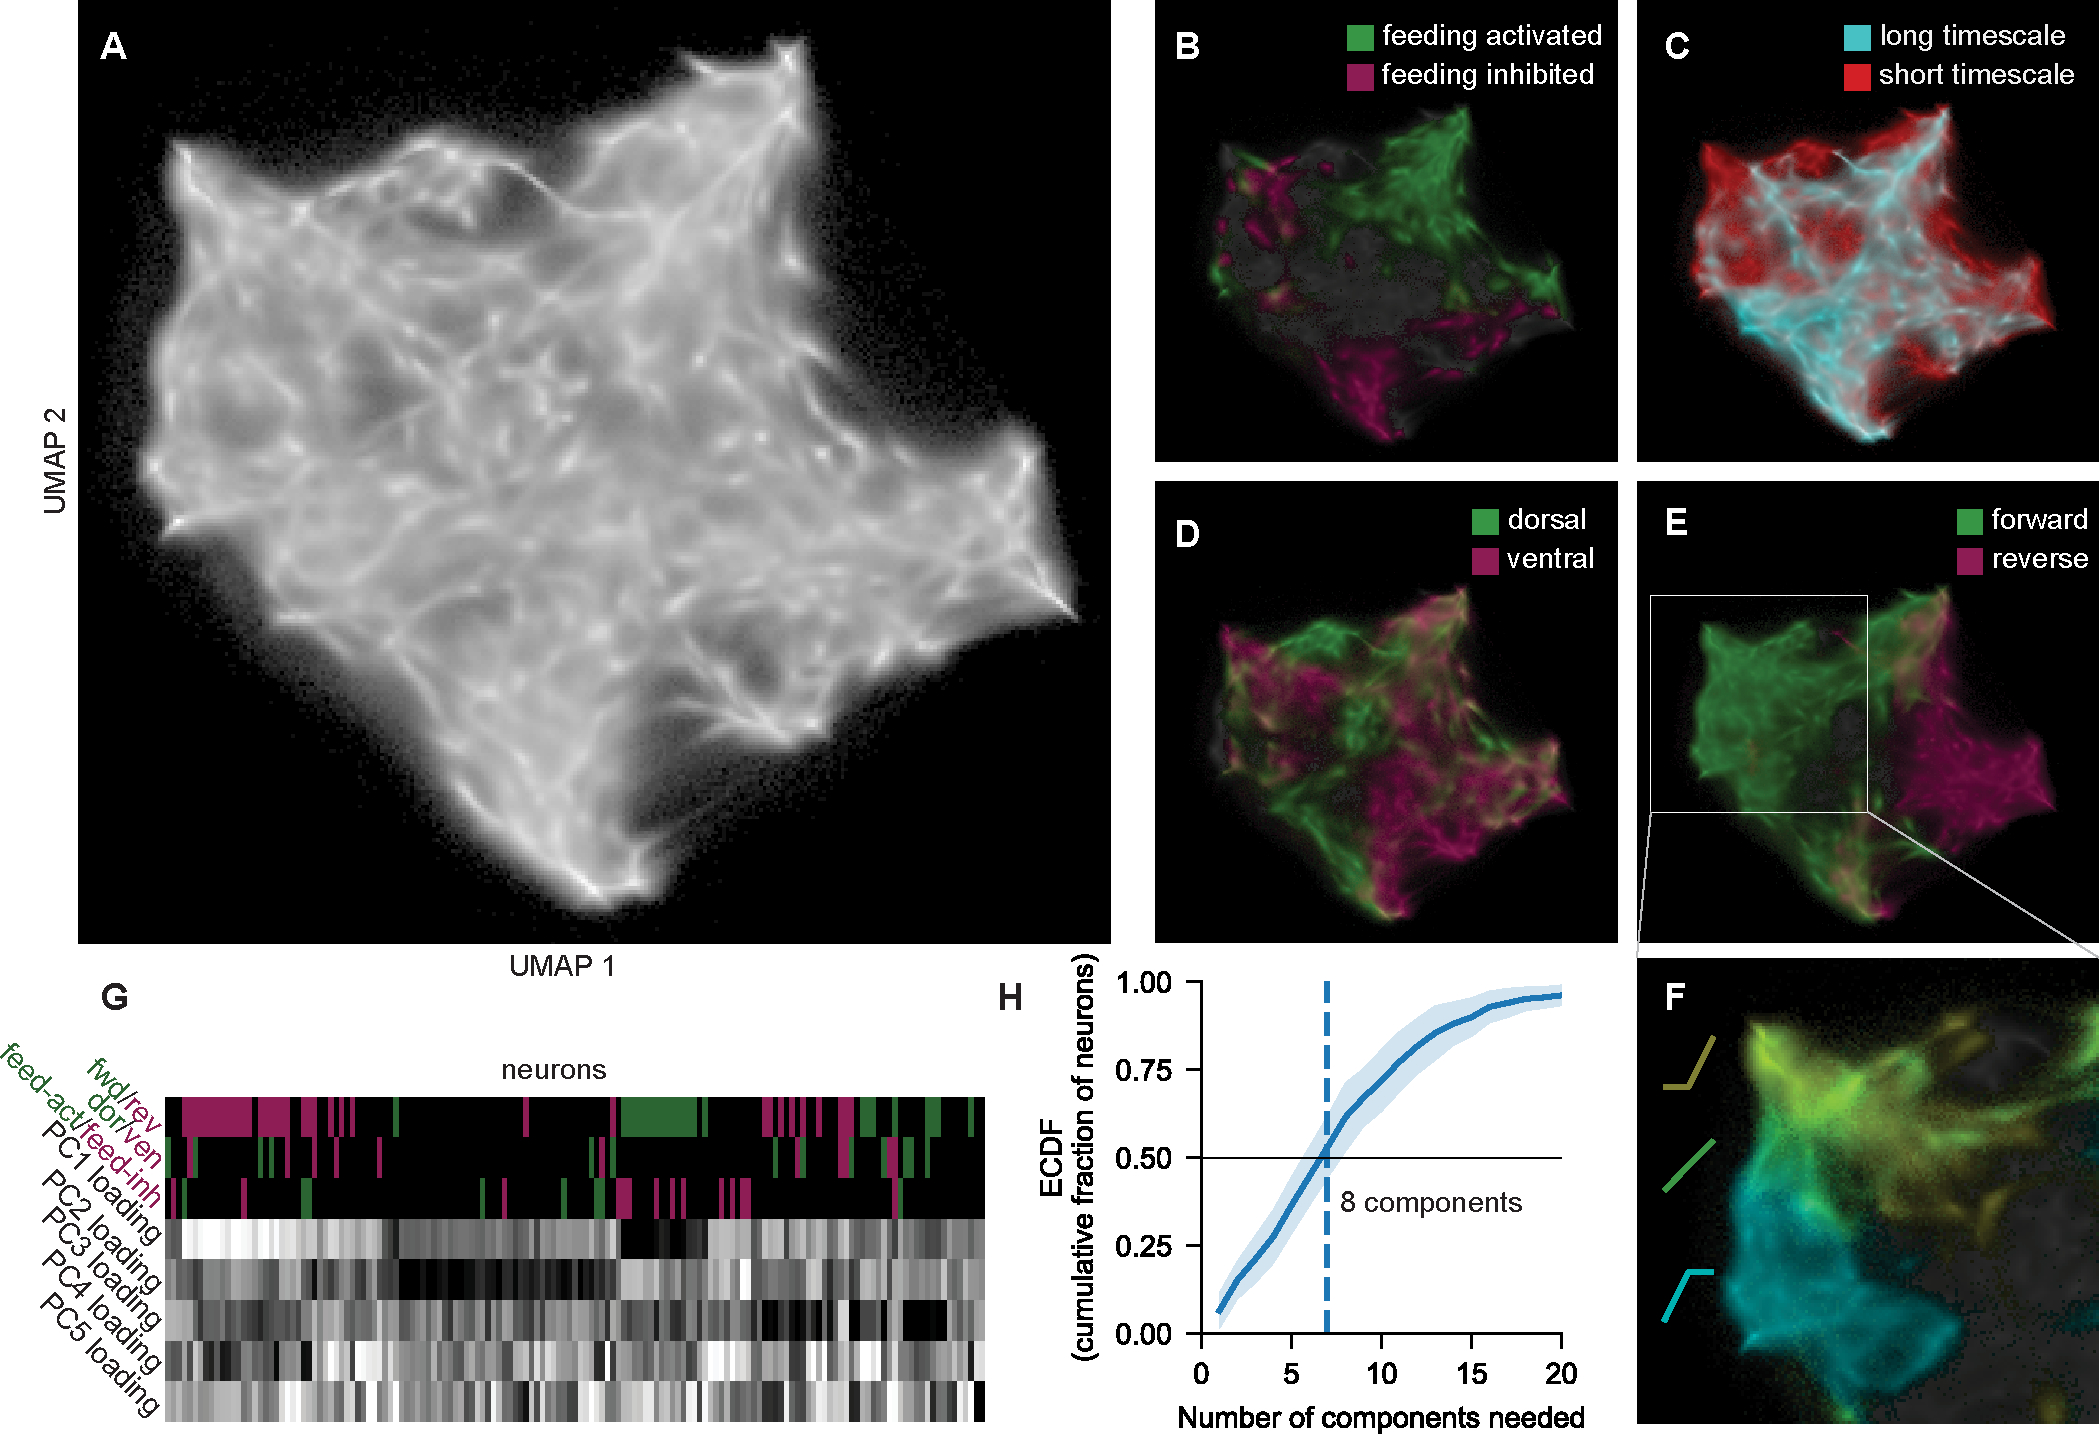
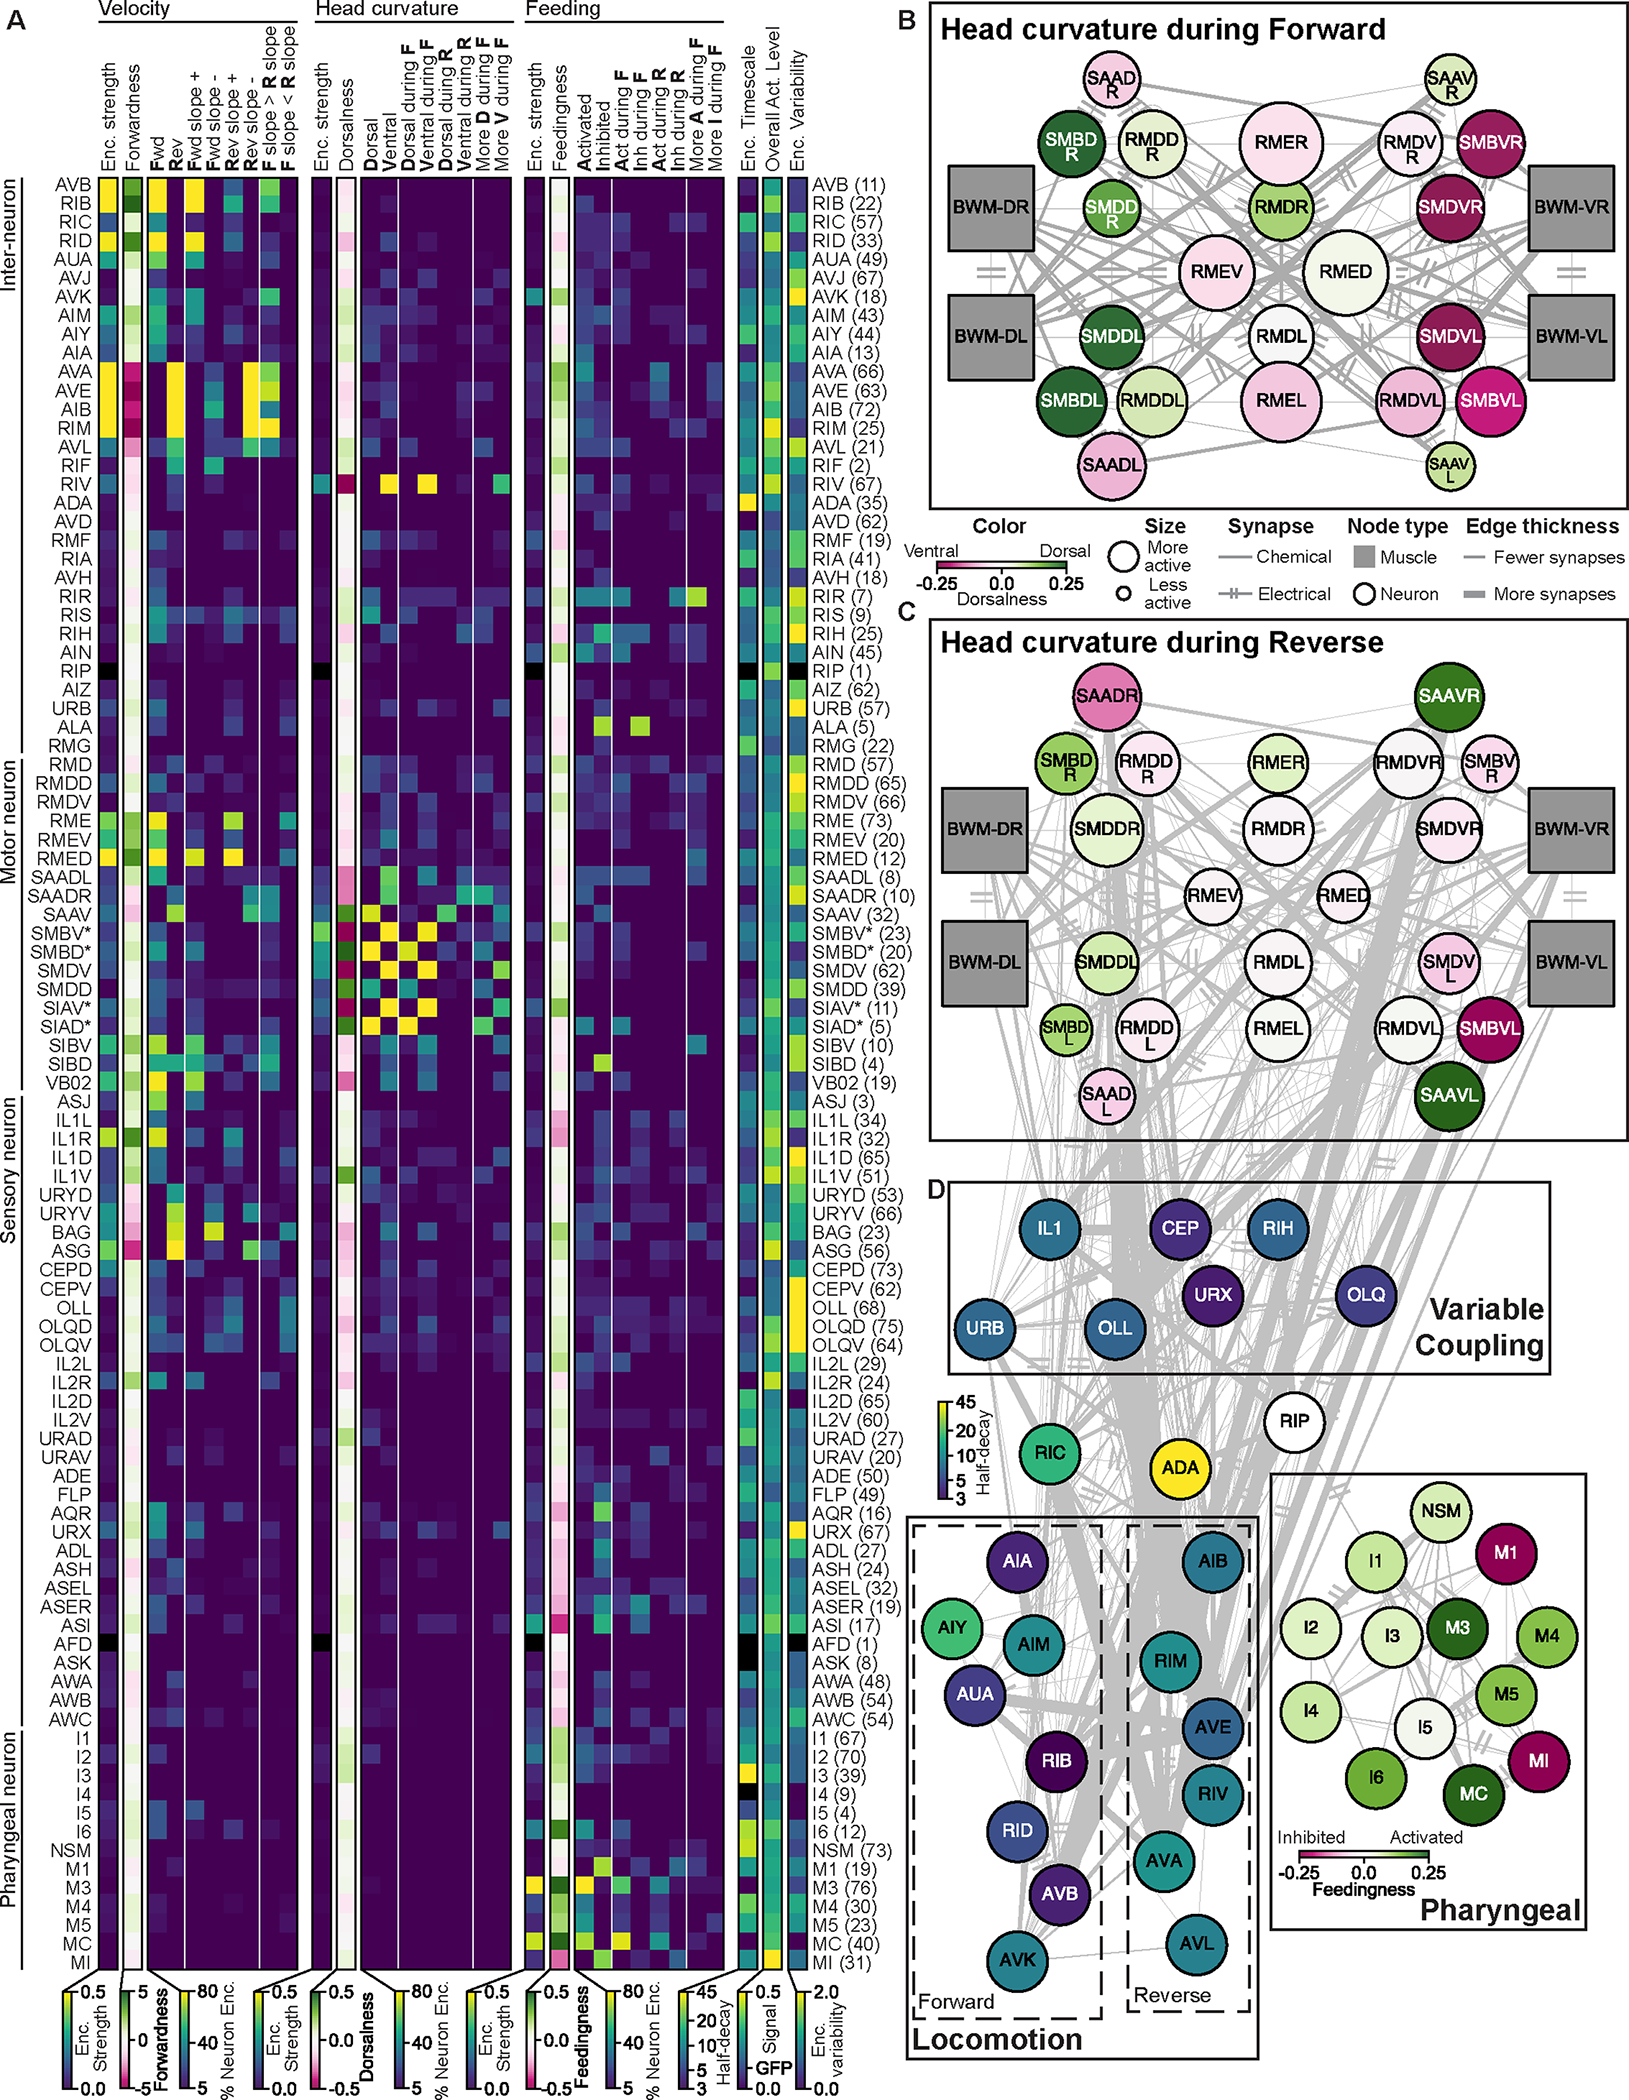
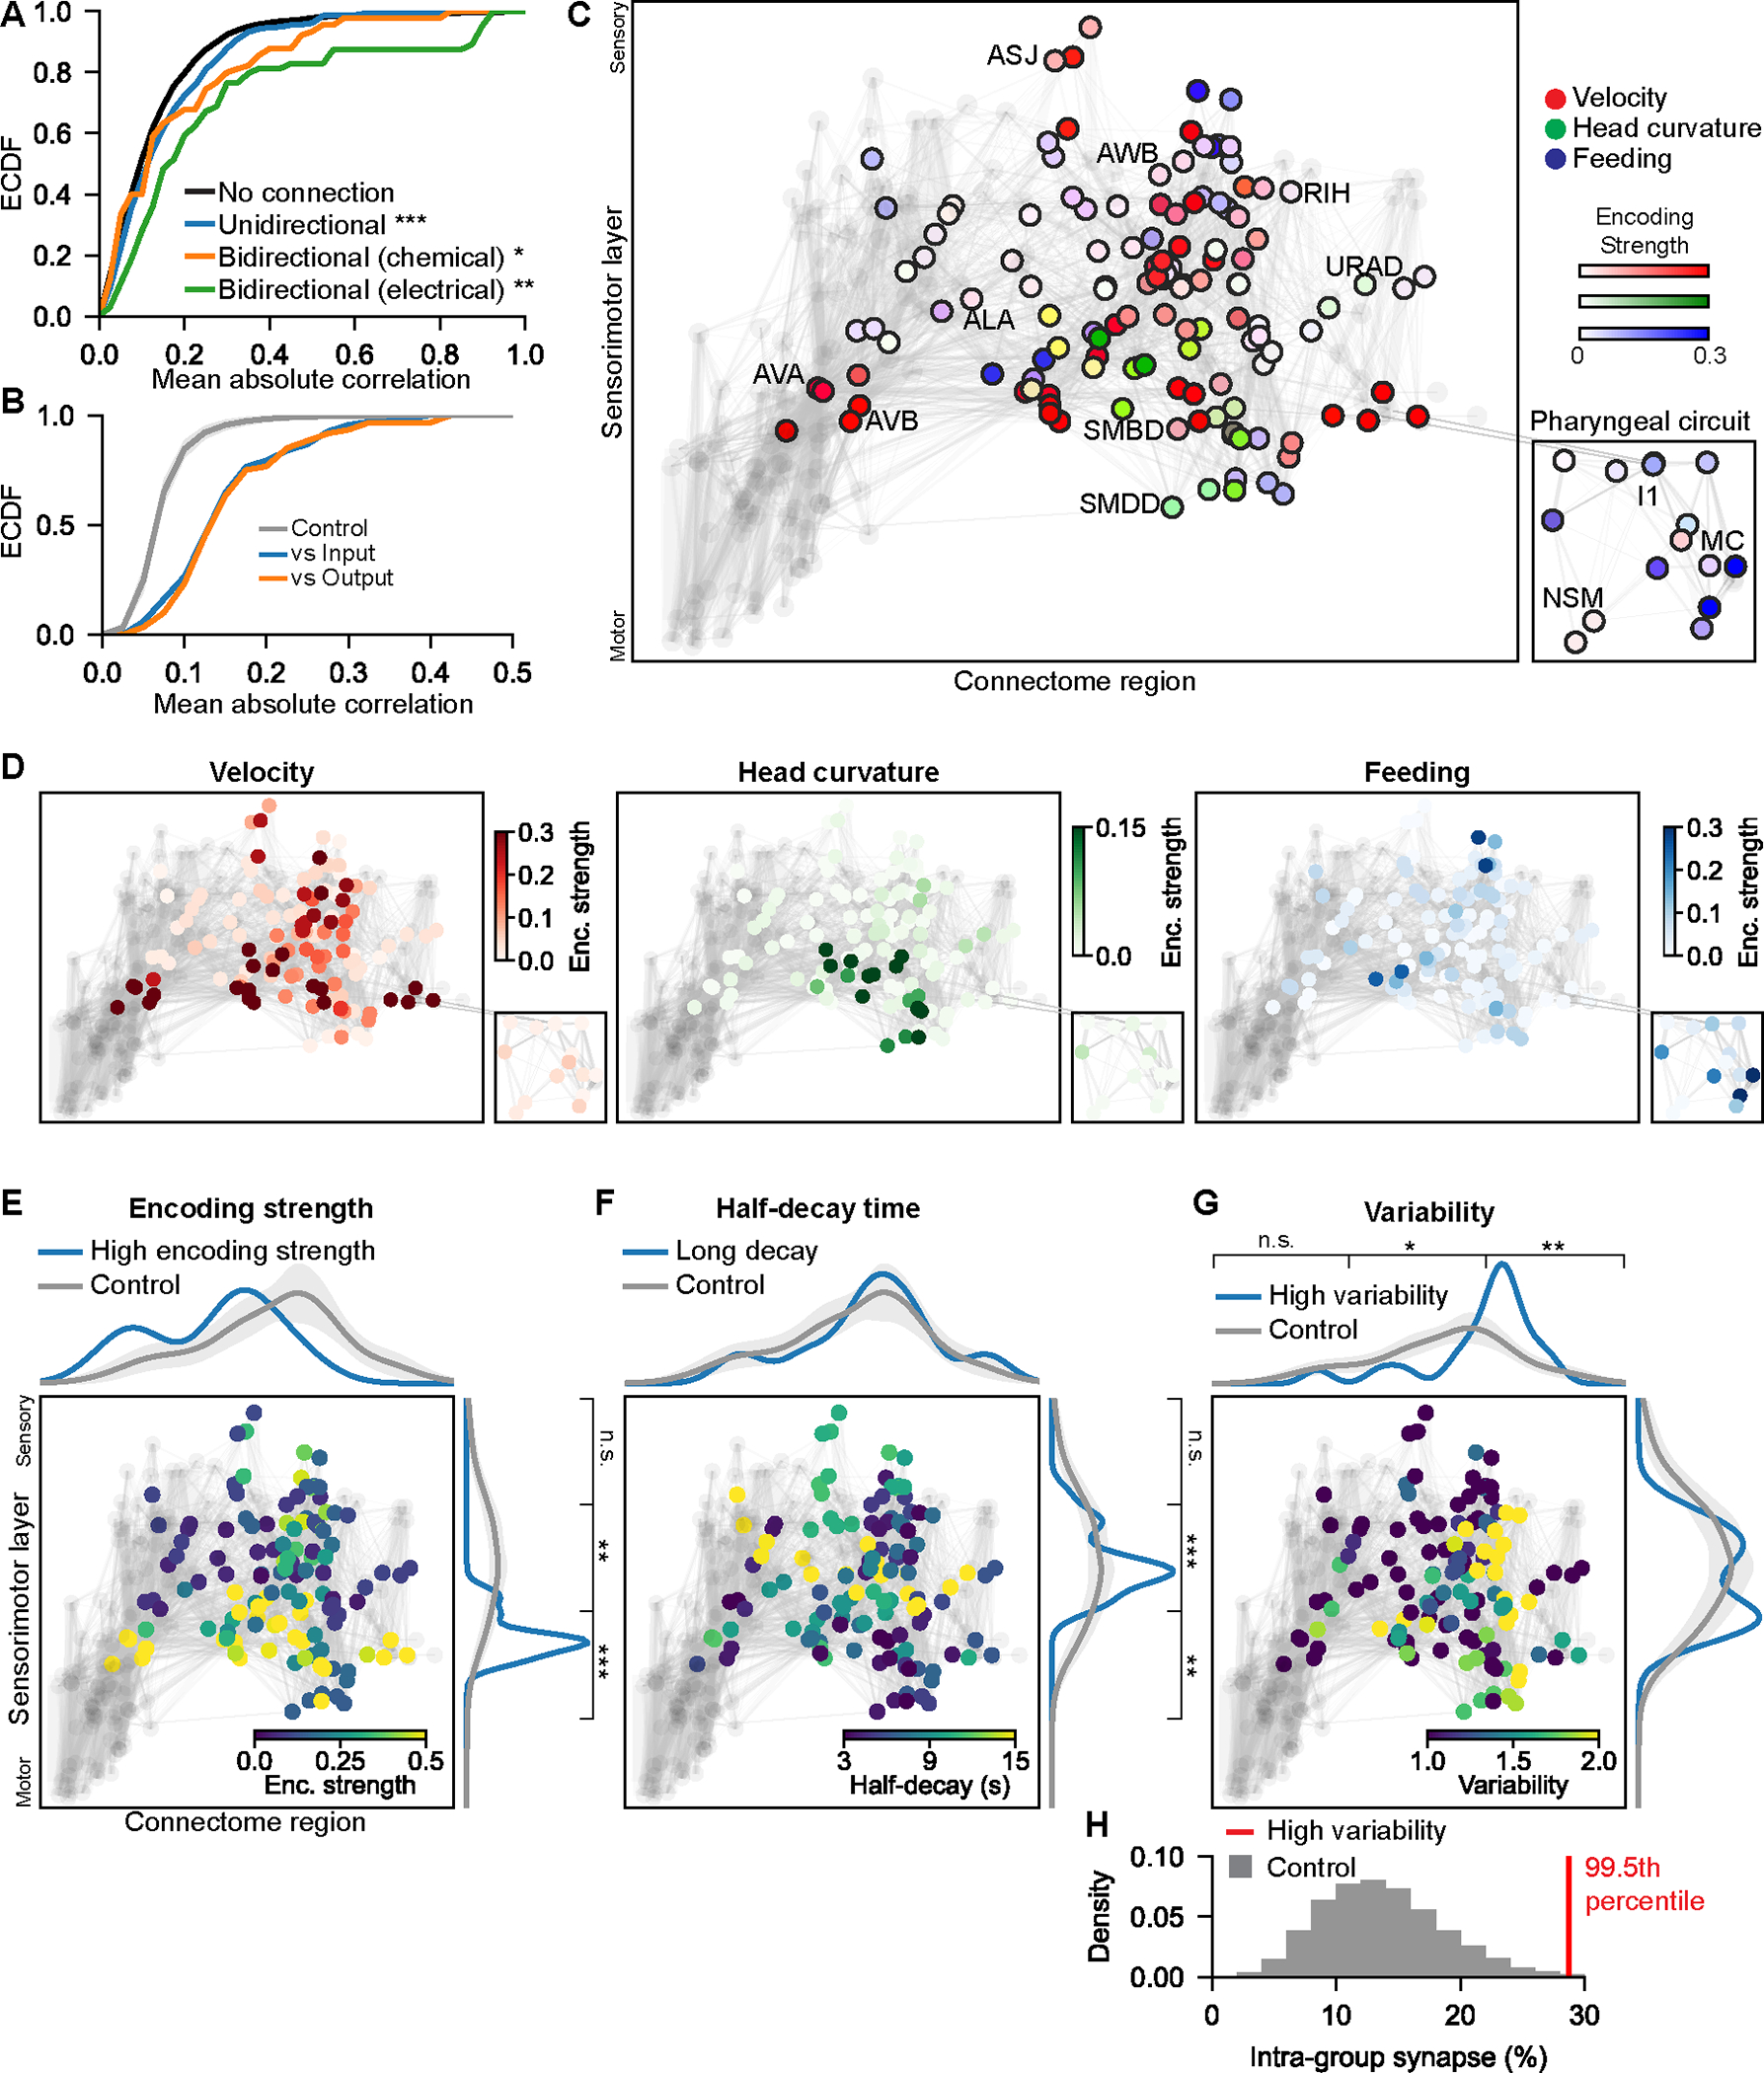
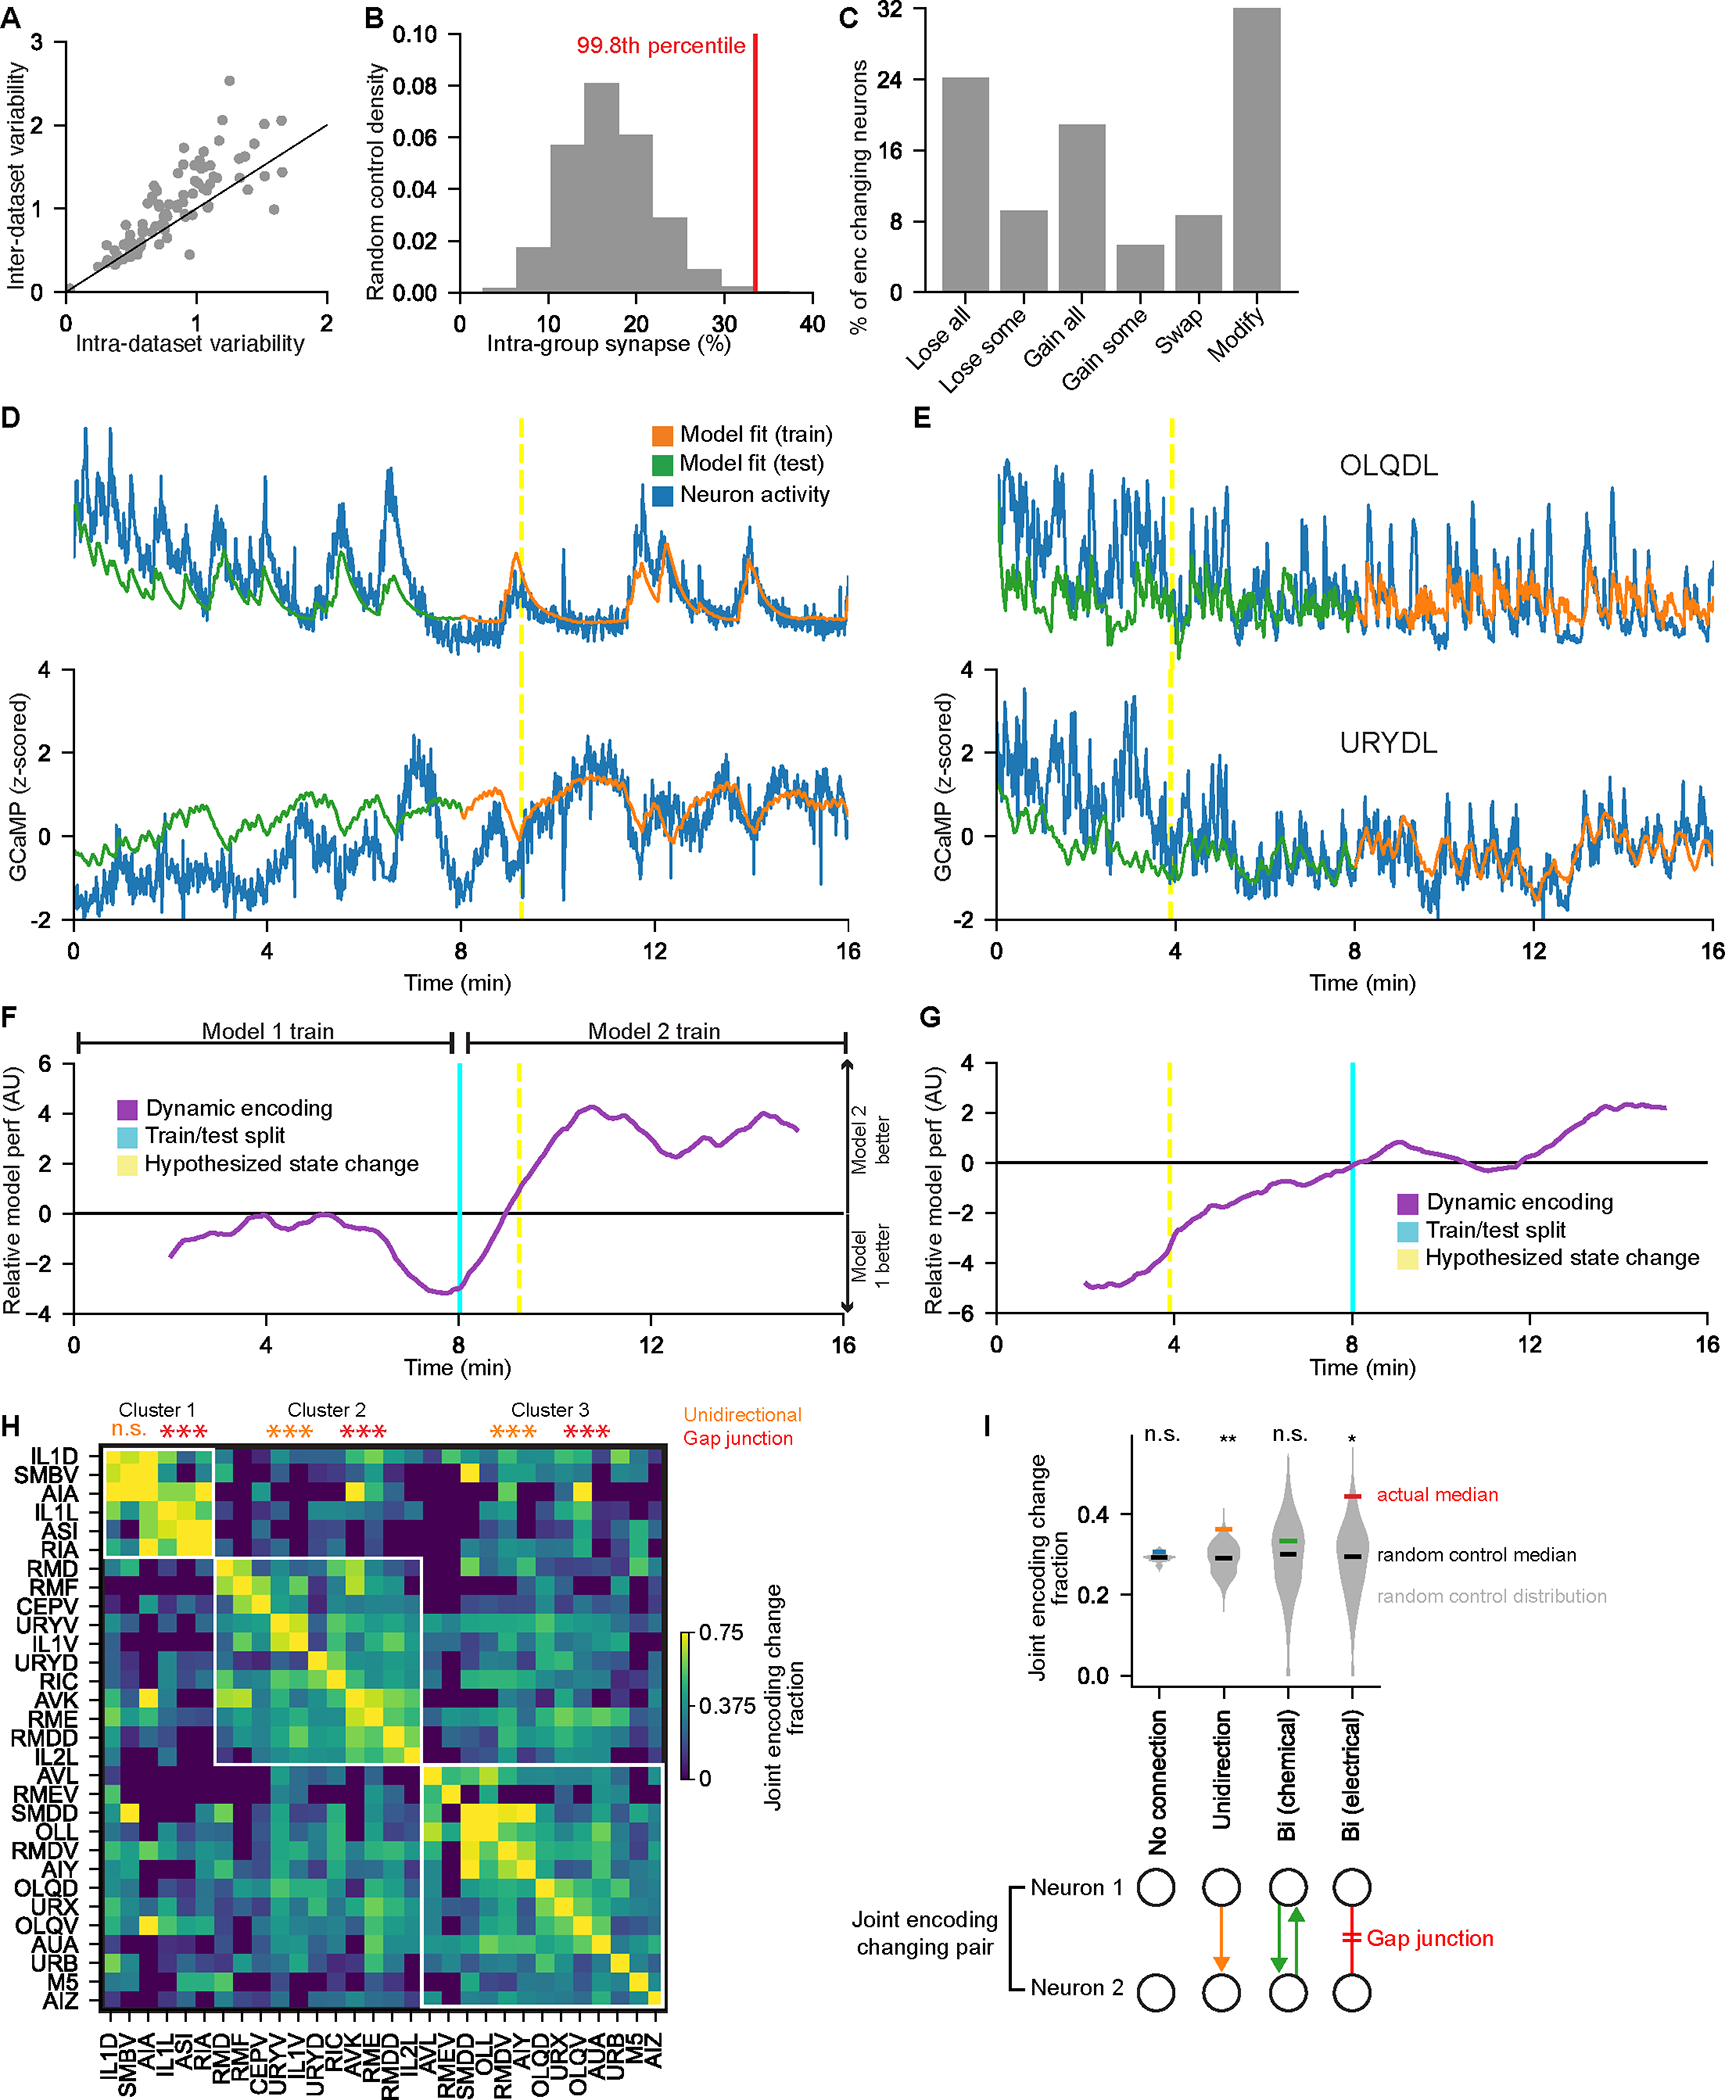
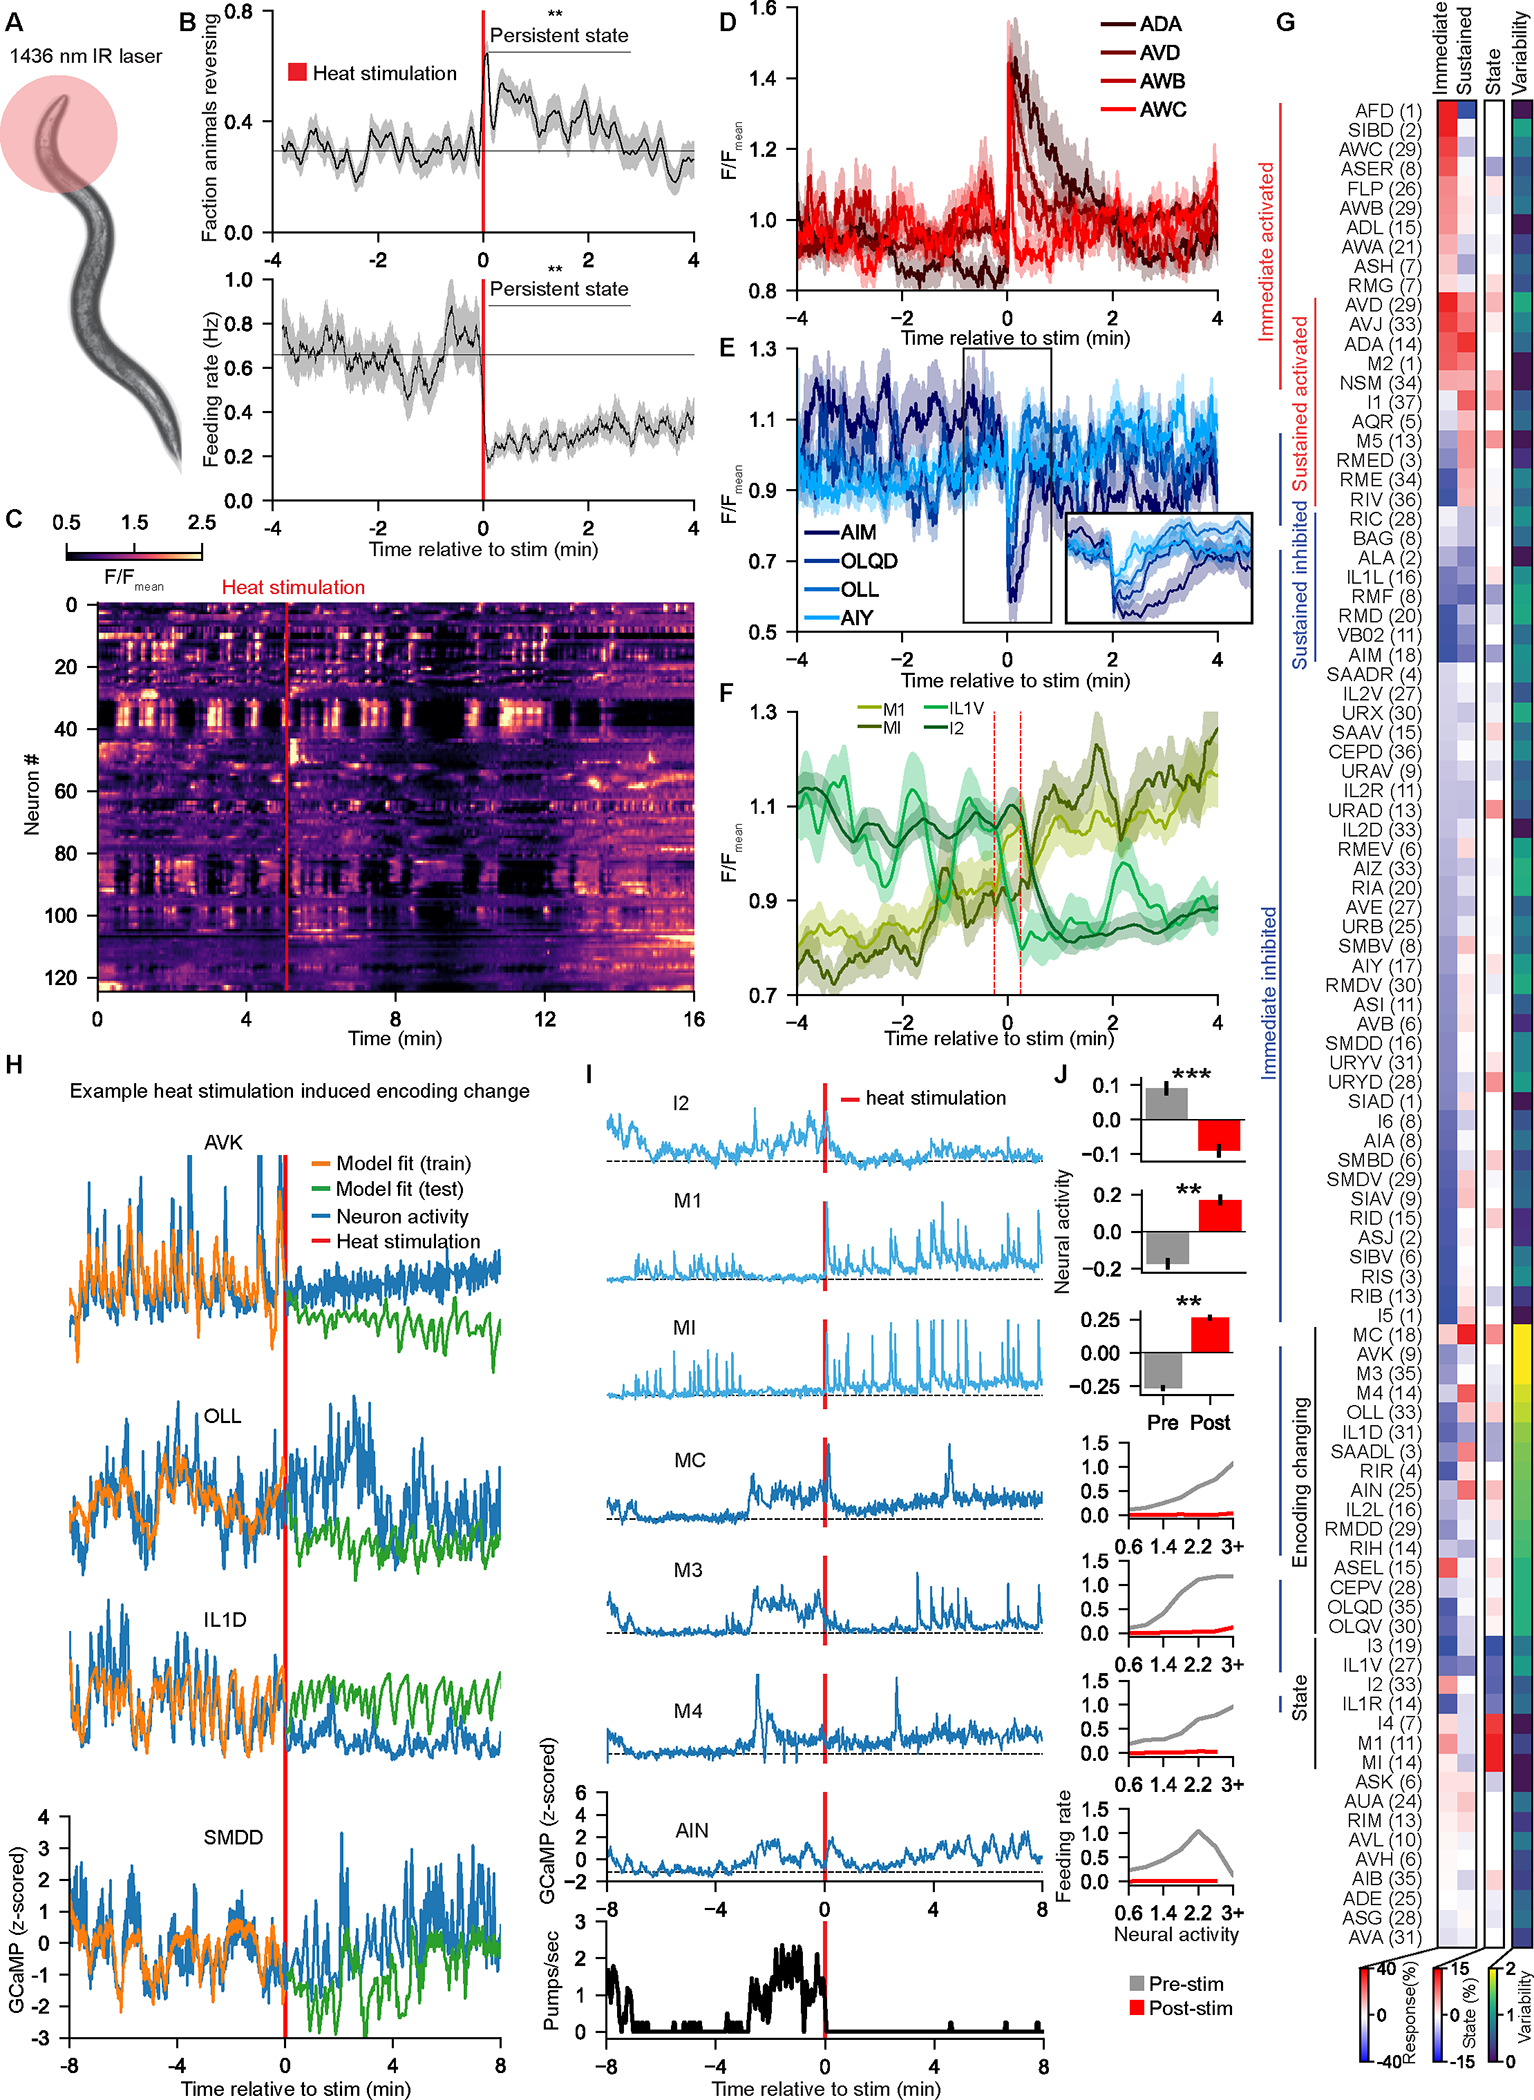
Changes in an animal's behavior and internal state are accompanied by widespread changes in activity across its brain. However, how neurons across the brain encode behavior and how this is impacted by state is poorly understood. We recorded brain-wide activity and the diverse motor programs of freely moving C. elegans and built probabilistic models that explain how each neuron encodes quantitative behavioral features. By determining the identities of the recorded neurons, we created an atlas of how the defined neuron classes in the C. elegans connectome encode behavior. Many neuron classes have conjunctive representations of multiple behaviors. Moreover, although many neurons encode current motor actions, others integrate recent actions. Changes in behavioral state are accompanied by widespread changes in how neurons encode behavior, and we identify these flexible nodes in the connectome. Our results provide a global map of how the cell types across an animal's brain encode its behavior.

Keywords: C. elegans; behavior; brain-wide activity; cell atlas; internal states; neural circuits.


Conflict of interest statement

Declaration of interests The authors declare no competing interests.

Figures

Figure 1.
Figure 1.. A probabilistic encoder model reveals how neurons across the C. elegans brain represent behavior
(A) Light path of the microscope. Top: behavioral data are collected in NIR brightfield. Images (panel B) are processed by the online tracking system, which sends commands to the stage to cancel out the motion. Bottom: spinning disk confocal for imaging head fluorescence. (B-C) Example images from the two light paths in (A). Panel (C) is a maximum intensity projection. (D) Software pipeline to extract GCaMP signals from the confocal volumes. See Methods. (E) Heatmap of neural traces collected from a pan-neuronal GFP control animal. Data are shown using same color scale as GCaMP data in (G). (F) Comparison of signal variation in all neurons from GFP and GCaMP recordings. (G) Example dataset, with GCaMP data and behavioral features. GCaMP data displayed on same color scale as (E). Body segment is a vector of body angles from head to tail. Inset (green) shows a zoomed region to illustrate fast head oscillations. (H) Three example neurons from one animal that encode velocity over different timescales. Each neuron (blue) is correlated with an exponentially-weighted (red kernels) moving average (gray) of the animal’s recent velocity, over different timescales. Inset shows half-decay times of exponentials and correlations of neurons to gray traces. (I) Example tuning scatterplots for three neurons (different from those in H) showing how their activity relates to velocity. Dots are individual timepoints. (J) Example tuning scatterplots for three neurons that combine information about head curvature (color) and velocity (x-axis). Dots are individual timepoints. For each neuron, the red and green dots separate from one another only for negative or positive velocity values. (K) Simplified expression of the deterministic component of CePNEM. Here, we represent the effect of timescale via an integral, whereas Equation 1 in the text represents timescale via recursion. (L) Left and Middle: Fitting procedure. Likelihood weighting selects a particle with the best fit to the data and uses it to initialize a Monte Carlo process that infers the posterior distribution (see Methods for details). Gray shading indicates model likelihood. Right: example posterior distribution for a neural trace, shown for two model parameters for illustrative purposes. (M) Example neural traces and median of all posterior CePNEM fits for that neuron. Inset cross-validation (cv) scores are pseudo-R2 scores on withheld testing data (see Methods). See also Figure S1, Figure S2, and Movie S1.
Figure 2.
Figure 2.. Varied representations of behavior across the C. elegans brain
(A) Fraction of neurons per animal that encode indicated behaviors. If a neuron encoded >1 behavior, it is represented in multiple categories. Error bars show standard deviation between animals. (B) Fraction of neurons per animal that encode 0, 1, 2, or 3 of the behaviors. Error bars show standard deviation between animals. (C) ECDF of the median model half-decay time for neurons that encode at least one behavior. Shading shows standard deviation between animals. (D) Performance of linear decoders that predict velocity at times offset from current neural activity (brown). Performance is the difference in error between the actual decoders and control scrambled decoders. Predicted velocity values were averaged over a 10-sec sliding window centered Δ𝑡 seconds from the current time. Decoders trained to make this prediction based on current velocity (black) or velocity values at all times (gray) are also shown. Shading shows standard deviation across animals. (E) Distributions of how neurons encode the indicated behaviors. Neurons were categorized based on their tuning curves to each behavior (see Methods). Example tuning curves are shown above and prototypical tuning curves for each category are shown. (F) Five example neurons that encode forward locomotion, together with CePNEM-derived tuning curves for each neuron, and the mean and standard deviation of each neuron’s half-decay time. (G) Three example neurons that encode head curvature in conjunction with movement direction, together with CePNEM-derived tuning parameters. (H) Three example neurons that encode feeding information, together with CePNEM-derived tuning parameters.
Figure 3.
Figure 3.. Global analysis of how neurons encode behavior in the C. elegans nervous system
(A) UMAP embedding of all neurons in 14 animals, where proximity indicates encoding similarity (see Methods). Here, we projected all points from each neuron’s CePNEM posterior. Fig. S3D shows only one dot per neuron. (B-E) UMAP space where neurons are colored by their behavioral encodings. Long versus short timescale is split at half-decay time of 20 sec. (F) Zoomed portion of UMAP space, where neurons are color-coded by their velocity tuning curves. (G) Example animal, showing neurons’ tuning to behavior and loadings onto the top five PCs. Neurons are hierarchically clustered by their PC loadings. (H) Number of PCs needed to explain 75% of the variance in a given neuron, averaged across neurons in 14 animals. Data are means and standard deviation across animals. See also Figure S3.
Figure 4.
Figure 4.. An atlas of how the different C. elegans neuron classes encode behavior
(A) An atlas of how the indicated neuron classes encode behavior, derived from analysis of fit CePNEM models. Columns show: • Encoding strength: approximate variance in neural activity explained by each behavioral variable. • Forwardness, Dorsalness, and Feedingness: slope of the tuning to each behavior. • Enc. timescale: median half-decay time • Overall act. level: standard deviation of the calcium traces when normalized as F/Fmean. • Enc. Variability: how differently the neuron class encoded behavior across recordings. Other columns show the fraction of recorded neurons that significantly encoded behaviors: • Fwd, Rev, Dorsal, Ventral, Activated, and Inhibited: neurons with that overall tuning to behavior. • Fwd slope −, Fwd slope +, Rev slope −, and Rev slope +: neurons with that slope in their velocity tuning curves during the specified movement direction. • F slope > R slope and F slope < R slope: neurons displaying rectification in their velocity tuning curves. • Dorsal during F, Ventral during F, Dorsal during R, Ventral during R, Act during F, Inh during F, Act during R, and Inh during R: neurons with that tuning to behavior during the specified movement direction (Forward or Reverse). • More D during F, More V during F, More A during F, and More I during F: neurons with different tunings to behavior during forward versus reverse. Parenthesis on right indicates the number of CePNEM fits per neuron class (first and second halves of videos, which have different model fits, are counted separately). (B-C) Circuit diagram of neurons that innervate head muscles with overlaid behavioral encodings during forward (B) and reverse (C) movement. Edge thickness indicates number of synapses between neurons. Left/right neurons shown separately, because one of these pairs (SAAD) exhibited asymmetric activity, suggesting an asymmetry in this circuit. (D) Circuit diagrams of behavioral circuits. See also Figures S4, Figure S5, and Table S1.
Figure 5.
Figure 5.. Neural encoding features map onto different regions of the connectome
(A) Cumulative distribution of the correlation coefficients of activities of pairs of neurons connected in different ways. Left/right pairs were merged for this analysis, so it only considers relationships between different neuron classes. *p<0.05 **p<0.005 ***p<0.0005, Mann-Whitney U-test. (B) Median correlation coefficients between each neuron and its synaptic inputs (blue) or outputs (orange). Control (gray) shows randomly selected neurons of equal group size. (C) Neurons (circles) and connections (gray lines) in the C. elegans connectome, with behavior encoding information. Connectome region (x-axis): neurons with similar wiring are adjacent on this axis, computed as the second eigenvector of the laplacian of the connectome graph. Sensorimotor layer (y-axis): neurons arranged from sensory to motor (see Methods). Some neurons are labeled to provide rough orientation to the layout. (D) Same as in (C), but one behavior per plot. (E-G) Distribution of encoding features in the connectome, arranged as in (C). Marginal distributions (blue) show values of each behavioral feature along each axis. Gray control lines show how behavioral features are distributed when randomly shuffled. *p< 0.05 **p<0.005, ***p<0.0005, one sample Z-test for proportion. (H) The number of synapses connecting the neurons with high variability (see Methods) is shown as a red line. Gray shows the number of synapses connecting random neuron groups. Inset shows rank of the true value in this shuffle distribution.
Figure 6.
Figure 6.. Neural representations of behavior dynamically change over time
(A) Analysis of inter- versus intra-dataset encoding variability. Each dot is a neuron class. (B) For the group of neurons that frequently change encoding, red line shows percent of synapses onto these neurons that come from neurons within the group. Gray controls are the same values for random groups of neurons of similar size. Inset percentile shows rank of true number. (C) How neurons changed encoding across SWF415 animals. Categories are: “lose all” (lost tuning to behavior), “lose some” (lost tuning to one or more behavior), “gain all”, “gain some”, “swap” (both gained and lost tuning to behaviors), and “modify” (encode the same behavior(s), but differently). (D) Two example neurons with CePNEM fits, showing a change in neural encoding of behavior. Yellow dashed lines indicate times when neurons across the full dataset displayed a sudden shift in encoding (see (F)). (E) Example neurons OLQDL and URYDL, depicted as in (D). (F) Data from same animal as (D) showing a sharp change in neural encoding of behavior. We fit CePNEM models to the first and second halves of the recording (Model 1 and Model 2). We then computed the difference between the errors of the two median model fits and smoothened with a 200-timepoint moving average. This was then averaged across encoding changing neurons. A sudden change (yellow line) indicates a sudden shift in behavior encoding across neurons. (G) Data from the same animal as (E) showing a sudden change in neural encoding, displayed as in (F). (H) Fraction of times that neuron classes changed encoding at the same moment, relative to their encoding changes overall. Rows were clustered and white outlines depict main clusters. **p<0.005, empirical p-value that clustering would perform as well during random shuffles. Within each cluster, the neurons were more likely to have unidirectional synapses and/or gap junctions with one another compared to random shuffles, as indicated. ***p<0.0005, empirical p-value. (I) Neuron pairs with unidirectional synapses or electrical synapses were more likely to change encoding together, compared to random shuffles (gray distributions). *p<0.05, **p<0.005, empirical p-value. See also Figure S6.
Figure 7.
Figure 7.. Behavioral state changes cause a widespread remapping of how neurons encode behavior
(A) Illustrative cartoon: a 1436nm IR laser transiently increases the temperature around the animal’s head by 10°C for 1 sec. (B) Event-triggered averages of behavior of 32 animals in response to the heat stimulus. **p<0.05, Wilcoxon signed rank test, pre- versus post-stimulus. (C) Neural data from an animal that received a heat stimulus (red line). (D-F) Event-triggered averages of neural activity aligned to the heat stimulus for some neurons with (D) excitatory or (E) inhibitory responses to the stimulus, or (F) persistent activity changes. ETAs in (F) are smoothed over 30 seconds; dashed lines indicate where the stim is within the moving average window. (G) Responses of different neuron classes to the heat stimulus (n=19 animals): • Immediate (<4 seconds) and sustained (15–30 seconds) GCaMP responses • Persistent activity changes. See Methods. • Encoding variability pre- vs post-stimulus. See Methods. (H) Example neurons that showed abrupt changes in their behavior encoding immediately after the stimulus. (I) Example dataset. Light blue neurons had persistent activity changes. Dark blue neurons changed encoding after the stimulus. (J) Top three plots: Average activity, computed as F-FmeanFmean, before and after the heat stimulus. Error bars show SEM across animals. **p<0.005, ***p<0.0005, Wilcoxon signed rank test. Bottom four plots: tuning curves to feeding behavior for each neuron class (pre- versus post-heat-stimulus data). Data are pooled across 19 animals. See also Figure S7.

Similar articles

Cited by

References

    1. Allen WE, Chen MZ, Pichamoorthy N, Tien RH, Pachitariu M, Luo L, and Deisseroth K (2019). Thirst regulates motivated behavior through modulation of brainwide neural population dynamics. Science 364, 253. 10.1126/science.aav3932. - DOI - PMC - PubMed
    1. Brezovec LE, Berger AB, Druckmann S, and Clandinin TR (2022). Mapping the Neural Dynamics of Locomotion across the Drosophila Brain. 2022.03.20.485047. 10.1101/2022.03.20.485047. - DOI - PubMed
    1. Hallinen KM, Dempsey R, Scholz M, Yu X, Linder A, Randi F, Sharma AK, Shaevitz JW, and Leifer AM (2021). Decoding locomotion from population neural activity in moving C. elegans. Elife 10, e66135. 10.7554/eLife.66135. - DOI - PMC - PubMed
    1. Marques JC, Li M, Schaak D, Robson DN, and Li JM (2020). Internal state dynamics shape brainwide activity and foraging behaviour. Nature 577, 239–243. 10.1038/s41586-019-1858-z. - DOI - PubMed
    1. Musall S, Kaufman MT, Juavinett AL, Gluf S, and Churchland AK (2019). Single-trial neural dynamics are dominated by richly varied movements. Nat Neurosci 22, 1677–1686. 10.1038/s41593-019-0502-4. - DOI - PMC - PubMed

Publication types