. 2023 Oct 3;35(10):1704-1721.e6.
doi: 10.1016/j.cmet.2023.07.014. Epub 2023 Aug 21.

Circadian modulation by time-restricted feeding rescues brain pathology and improves memory in mouse models of Alzheimer's disease

Affiliations

Circadian modulation by time-restricted feeding rescues brain pathology and improves memory in mouse models of Alzheimer's disease

Daniel S Whittaker et al. Cell Metab. .

Abstract

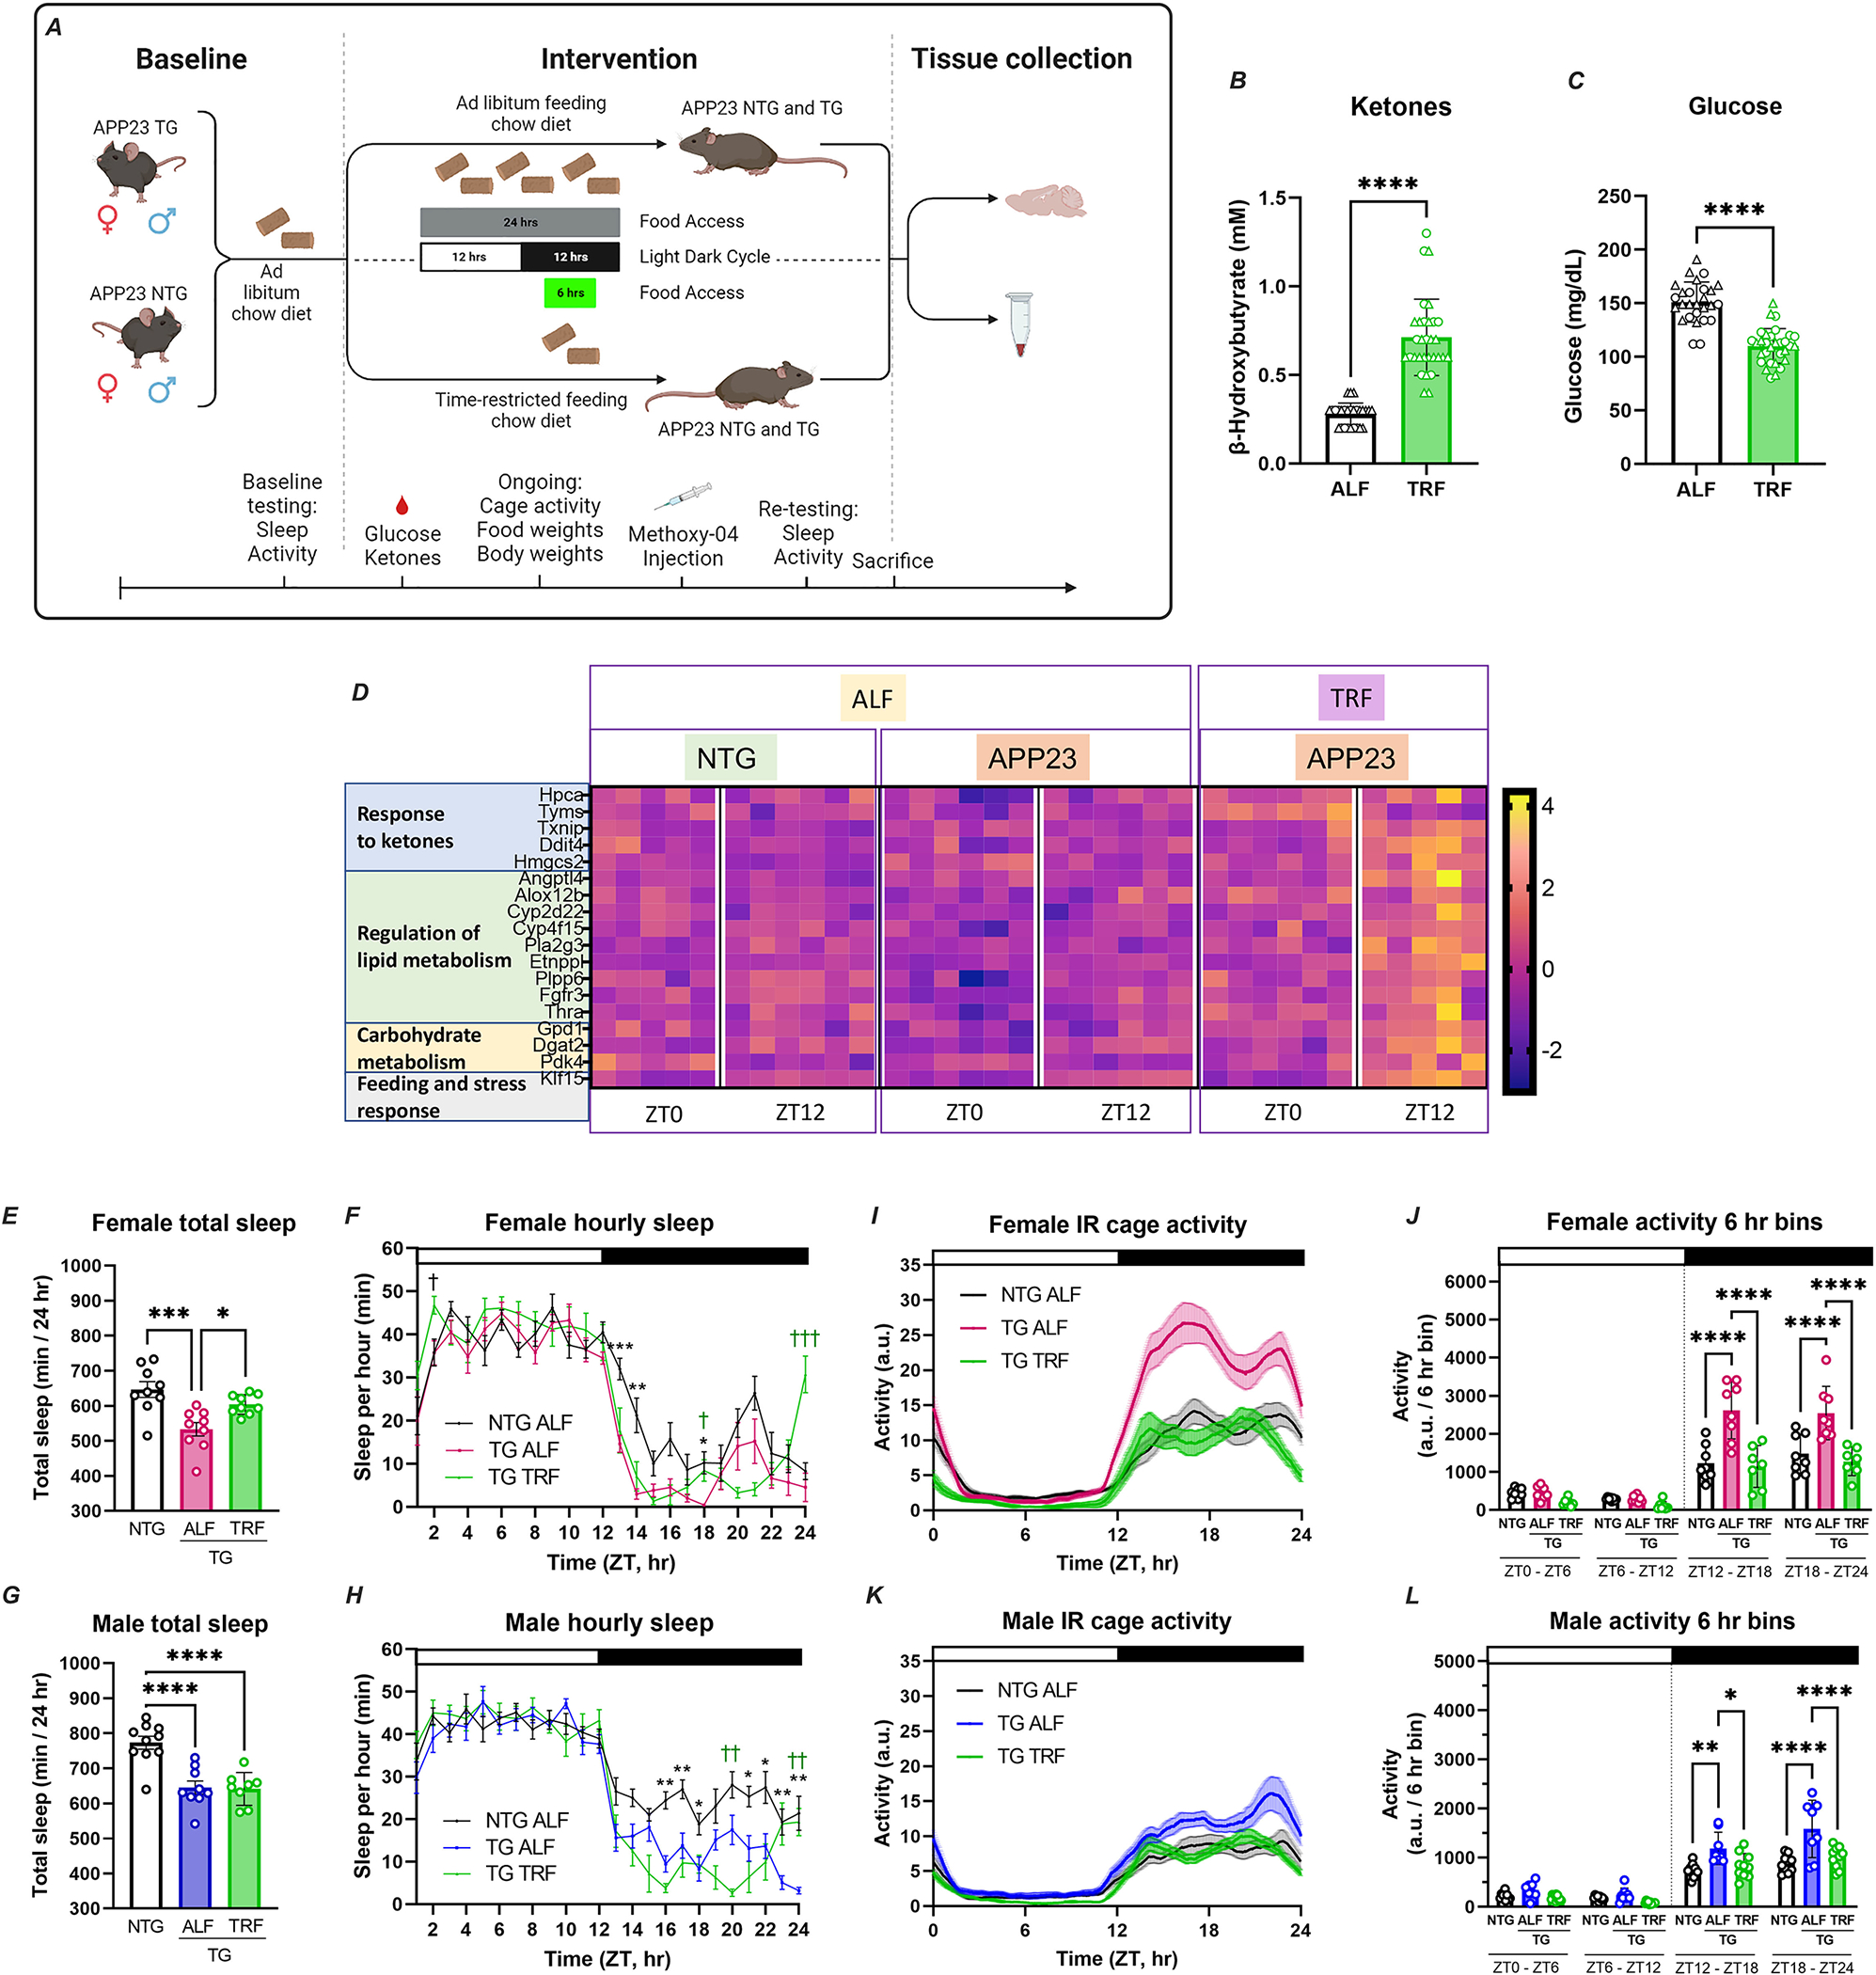
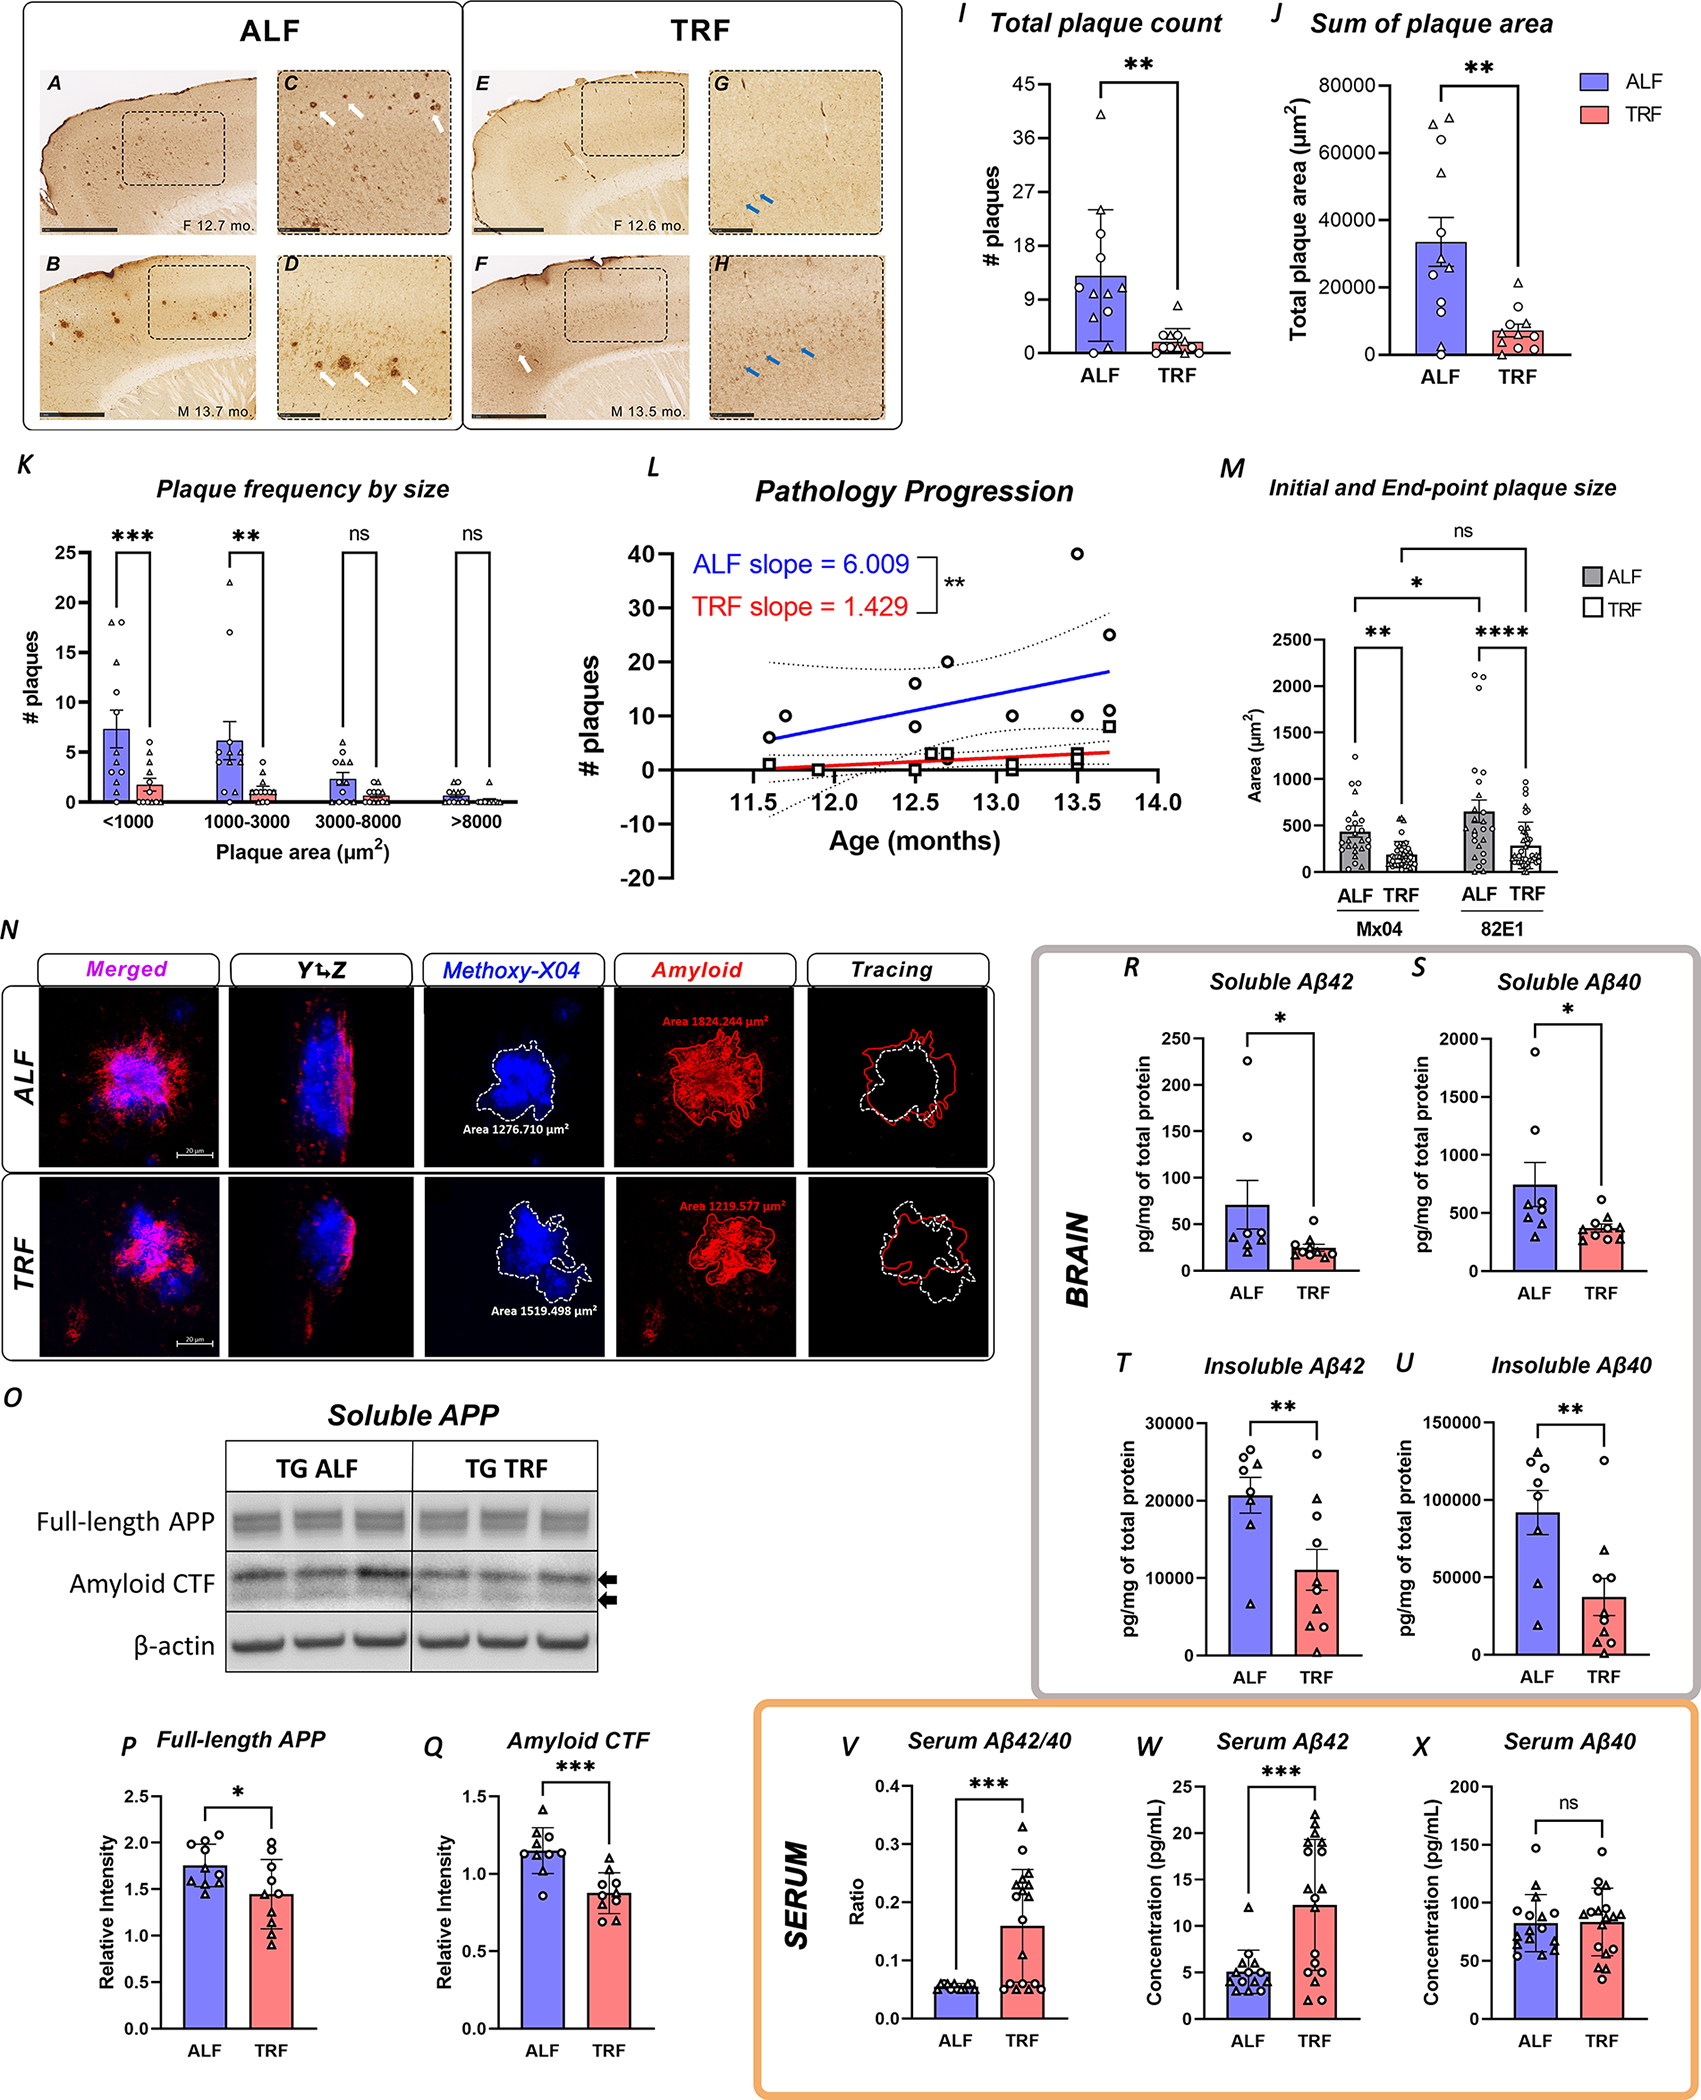
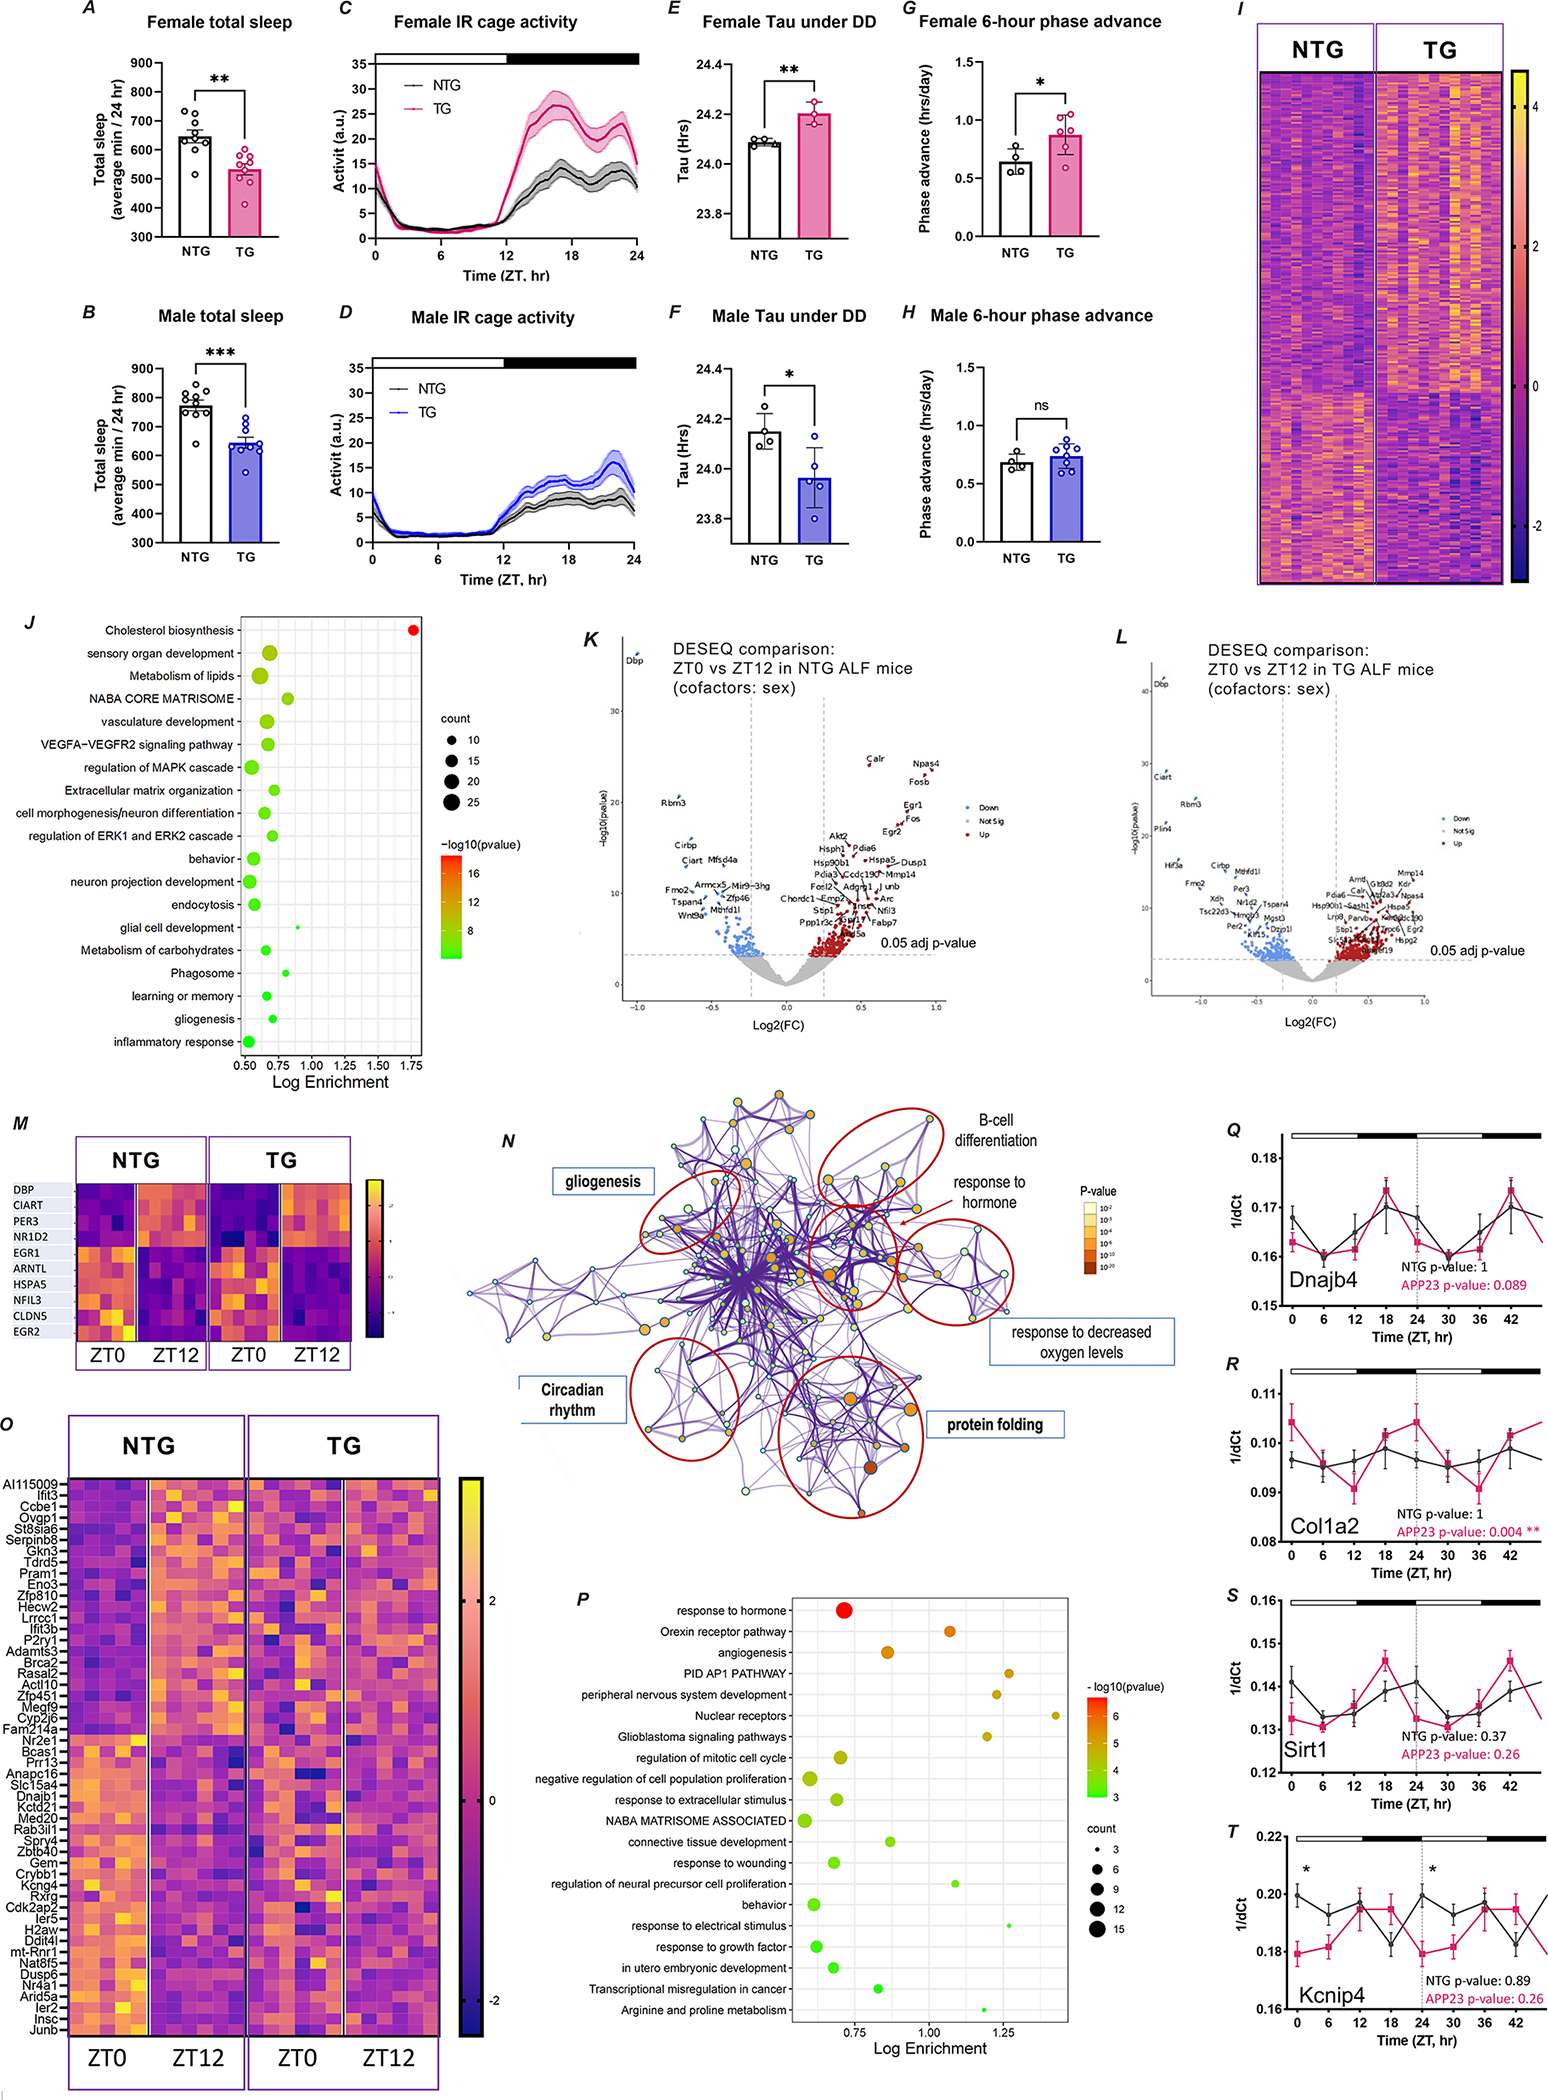
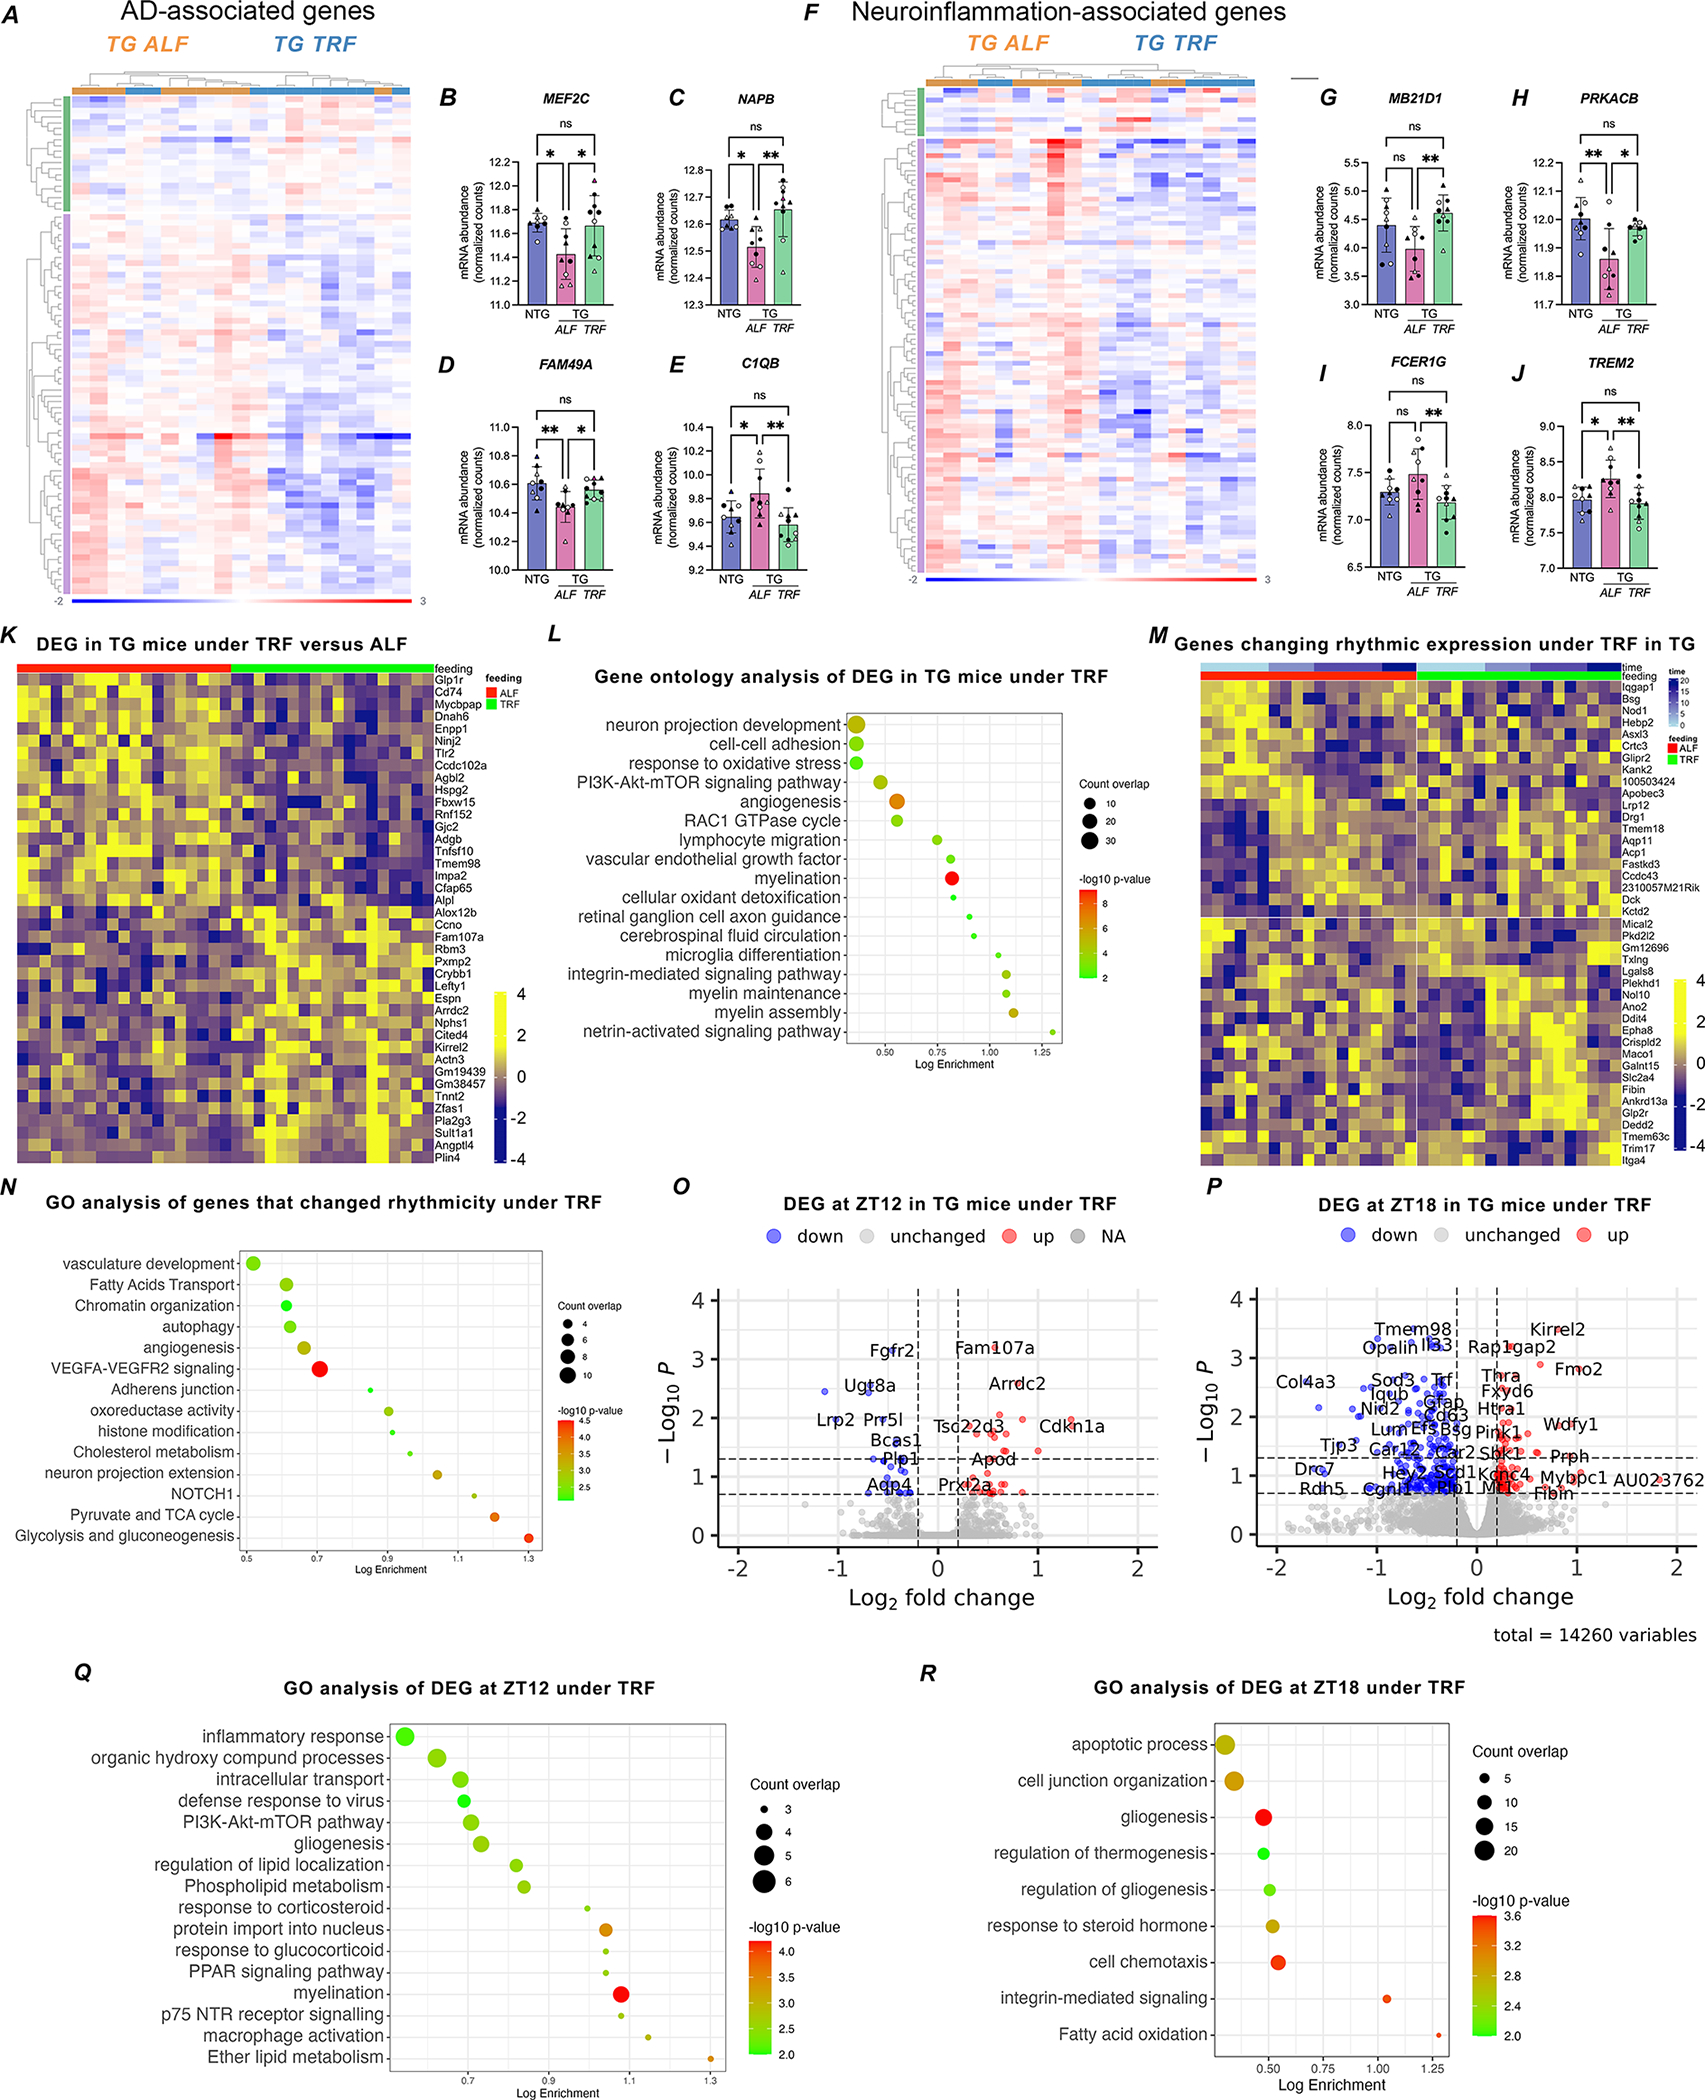
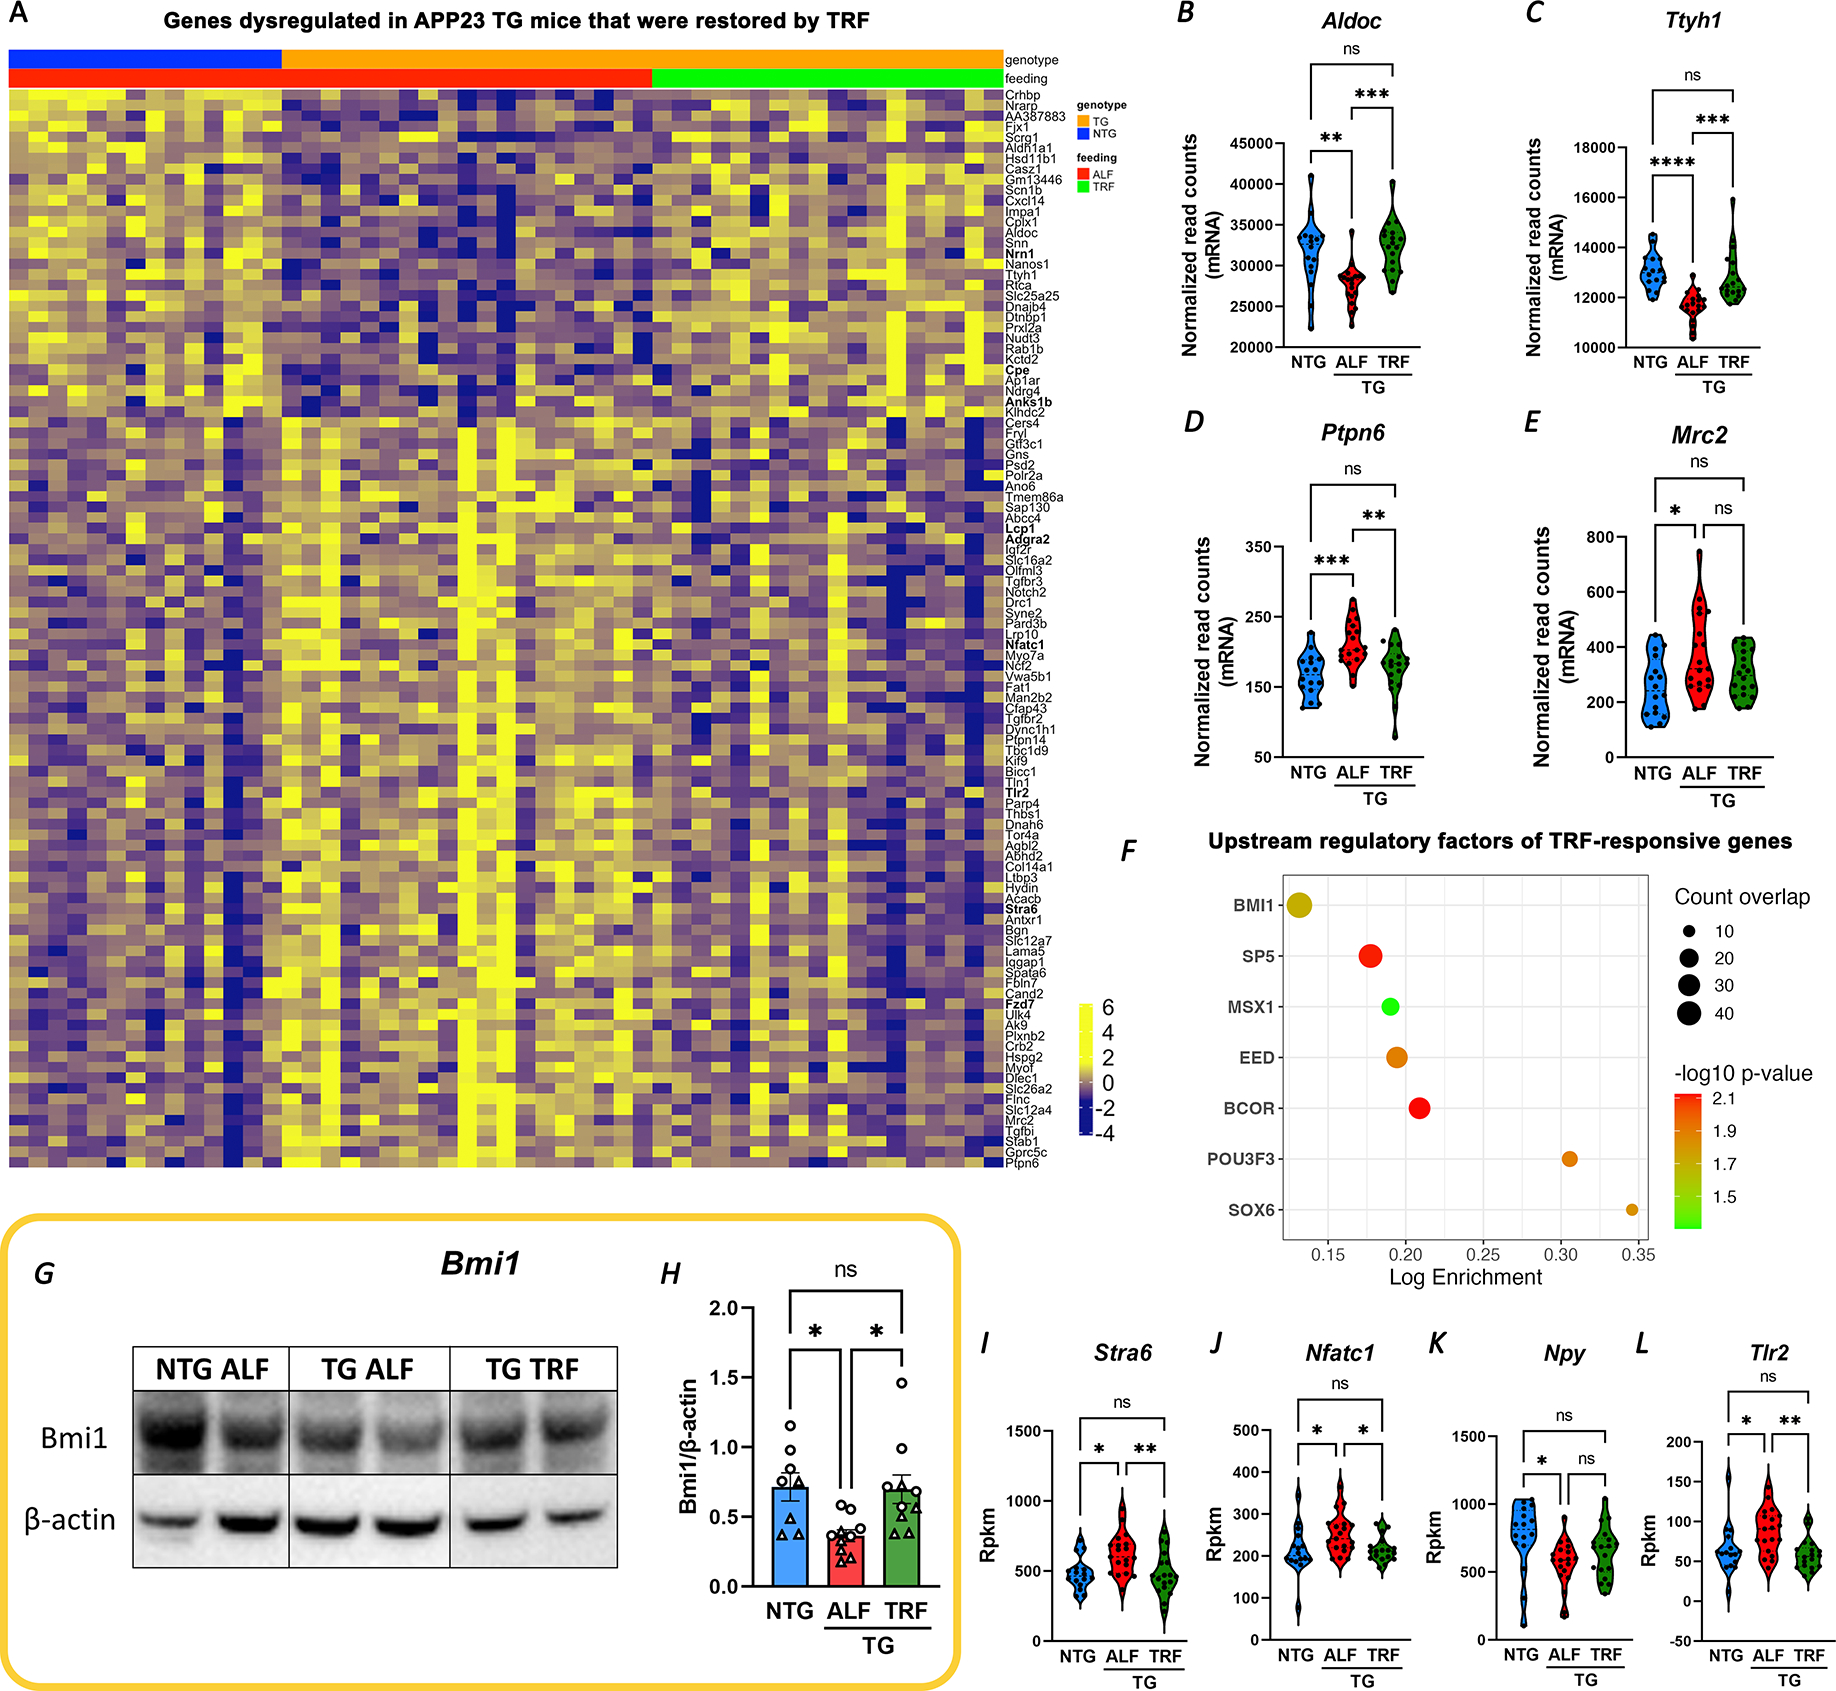
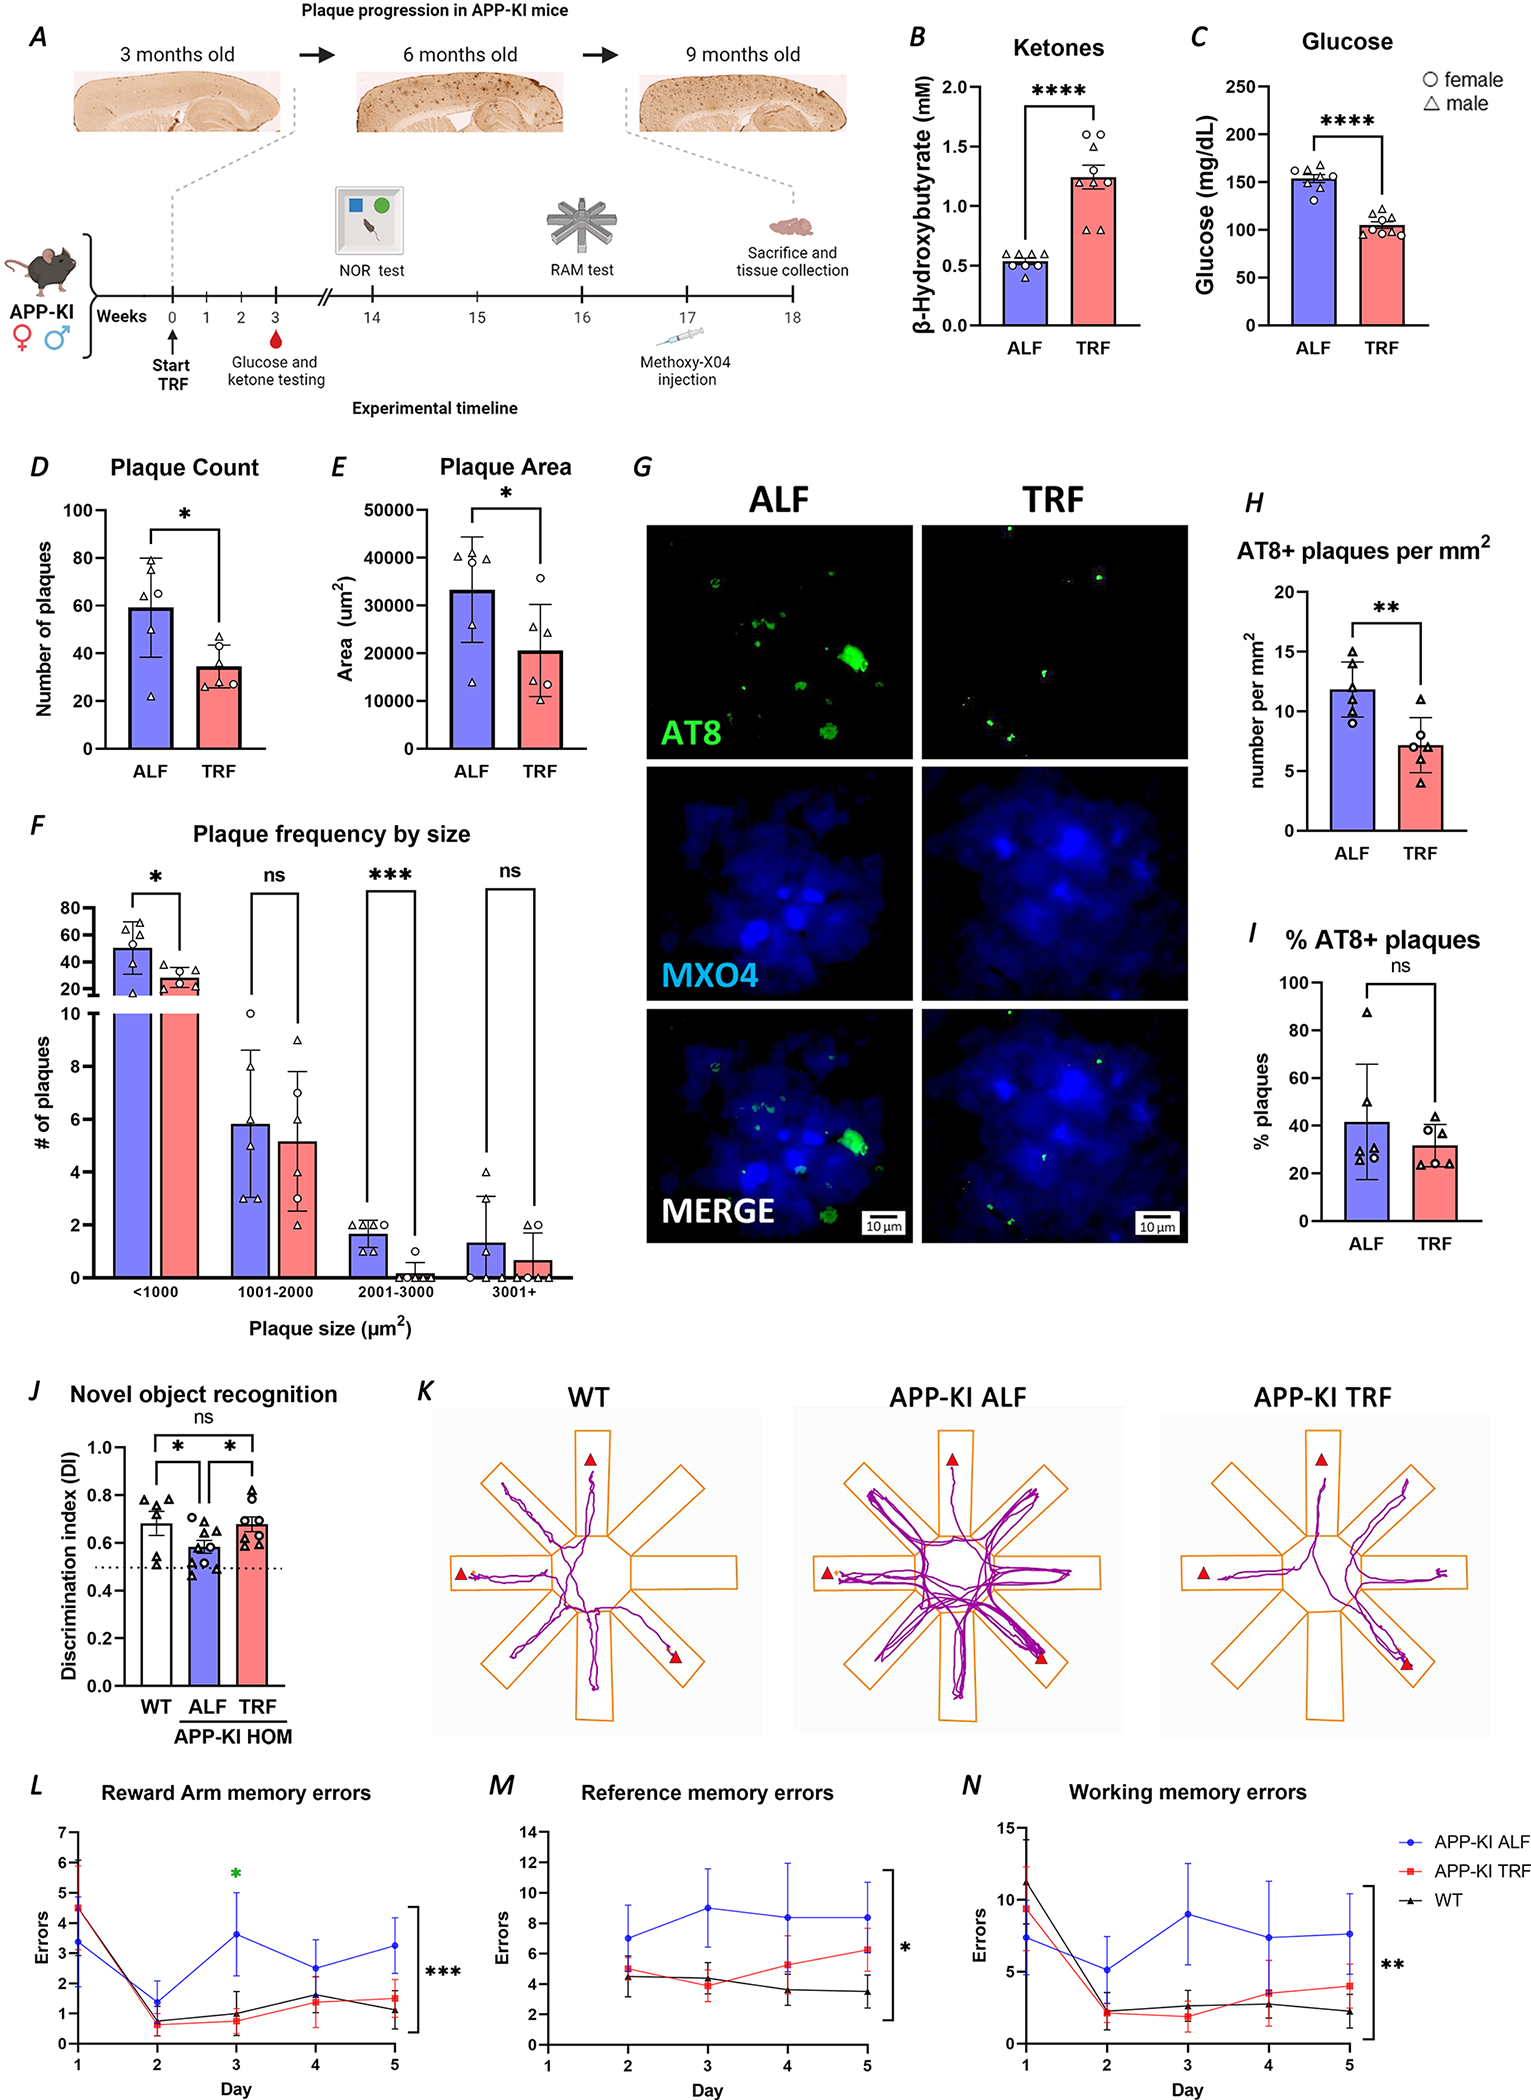
Circadian disruptions impact nearly all people with Alzheimer's disease (AD), emphasizing both their potential role in pathology and the critical need to investigate the therapeutic potential of circadian-modulating interventions. Here, we show that time-restricted feeding (TRF) without caloric restriction improved key disease components including behavioral timing, disease pathology, hippocampal transcription, and memory in two transgenic (TG) mouse models of AD. We found that TRF had the remarkable capability of simultaneously reducing amyloid deposition, increasing Aβ42 clearance, improving sleep and memory, and normalizing daily transcription patterns of multiple genes, including those associated with AD and neuroinflammation. Thus, our study unveils for the first time the pleiotropic nature of timed feeding on AD, which has far-reaching effects beyond metabolism, ameliorating neurodegeneration and the misalignment of circadian rhythmicity. Since TRF can substantially modify disease trajectory, this intervention has immediate translational potential, addressing the urgent demand for accessible approaches to reduce or halt AD progression.

Keywords: Alzheimer's mouse models; Alzheimer’s disease; amyloid plaque deposition; circadian rhythms; cognition; hippocampal transcriptome; memory; neuroinflammation; rhythmic transcription; time-restricted feeding.


Conflict of interest statement

Declaration of interests The authors declare no competing interests.

Figures

FIGURE 1.
FIGURE 1.. AD mice show alterations in sleep, activity, circadian rhythms and brain transcription.
A-B. Total sleep is represented as average minutes per 24 h from data collected over two 24 h sleep-wake cycles. C-D. Activity recordings reported in 3-min bins averaged from 7–10 days of activity. E-F. Tau (circadian period length) under DD was calculated from activity onset times and is presented in hour units. G-H. Phase shift was calculated as [(Δh “activity onset” to “entrained onset”)/days to entrainment] and is presented as the shift in h/day. Top bar in waveforms represents the light-dark cycle. Bar graphs represent individual data plots with standard error of the mean. Statistical significance represents the comparison between TG and NTG mice as per unpaired Students’ t-test *p≤0.05; **p≤0.01; ***p≤0.001. I. Heatmap of significant DEGs in APP23 TG vs NTG mice based on RNA-Seq analysis of hippocampus tissue using DESEQ2; threshold adj.p≤0.2. Each row is one gene and expression is represented by z-score. J. Gene ontology terms for genes differentially expressed in TG mice using Metascape. K-L. Transcriptional profiling by RNA-Seq shows time-of-day expression in both APP23 TG (K; n=12) and NTG mice (L; n=13) hippocampus. Depicted as volcano plots at adj.p≤0.05; red denotes increased and blue decreased at ZT0 in comparison to ZT12. M. Expression of circadian clock genes in NTG and TG mice, presented as heatmap sorted by phase of gene expression in z-scores. N. Pathway enrichment analysis of rhythmic genes using Metascape and showing enrichment in functions associated with neurodegeneration and circadian clock. O. Time-of-day expression patterns are obliterated in some genes in APP23 TG mouse hippocampus, as shown by heatmap sorted by phase of expression in NTG and represented by z-scores. P. GO analysis of the genes that lost rhythmicity in TG mice, showing top enriched functions in Metascape, including pathways associated with transcription regulation, sleep, and behavior. Q-T. Alterations in the rhythmic patterns of expression of selected AD-associated core clock were detected by qPCR using samples taken every 6 hr. Transcript abundance at each time point is expressed as inverse delta Ct. The periodicity p-value is denoted on each plot for NTG and TG. Values are double plotted. Asterisks in the waveform show statistical significance representing the comparison between TG and NTG mice at single timepoints as per unpaired Students’ t-test, *p≤0.05; **p≤0.01.
FIGURE 2.
FIGURE 2.. Time-restricted feeding induces metabolic changes, modulates brain transcription, and rescues behavior and sleep in AD mice.
A. Schematic representation of TRF intervention indicating feeding models and assay/evaluations performed. B-C. Significant changes in β-hydroxybutyrate and glucose in TRF-treated animals (n=31) in comparison to ALF mice (n=27), as detected in blood and presented as individual values with standard error of the mean. Statistical significance as per unpaired Students’ t-test. ◯ female; △ male. D. The expression of a set of metabolism-associated genes was modulated by TRF in the hippocampus of APP23 TG mice in a phase-dependent fashion, as shown by heatmap based on z-score of normalized reads and sorted by phase of expression in NTG mice. E-H. Total sleep is represented as average minutes per 24 h and sleep as average sleep per 1 h bin. Data was analyzed averaged over two 24 h sleep-wake cycles. Statistical significance represents one-way ANOVA with Tukey’s multiple comparisons test (E and G), or two-way ANOVA with Tukey’s multiple comparisons test (F and H) I-L. Activity recordings reported in 3-min and 6 h bins averaged from 7–10 days of activity. Statistical significance represents one-way ANOVA followed by Šídák’s multiple comparisons test (J and L). Top bar in waveforms represents the light-dark cycle. Bar graphs represent individual data plots with standard error of the mean. *p≤0.05; **p≤0.01; *** p≤0.001; **** p≤0.0001.
FIGURE 3.
FIGURE 3.. Effects of TRF on hippocampus transcription and diurnal rhythms of gene expression.
A-J. Differential expression of genes associated with Alzheimer’s disease (A-E) and neuroinflammation (F-J) in APP123 TG mice under TRF (n=10) vs ALF regimen (n=9) and as detected by NanoString® panels. Heatmaps sorted by fold-change after normalization and analysis in Rosalind. Comparison based on treatment, controlling by genotype, sex, and time of collection. Examples of gene expression are shown by box plots for the top changed genes in each group (B-E and G-J) and are based on normalized counts and presented as individual values with standard error of the mean. Statistical significance as per unpaired Students’ t-test *p≤0.05; **p≤0.01. ◯ female; △ male; white symbols for samples taken at ZT0; black symbols for samples taken at ZT12. K. Heatmap of significant DEGs in APP23 TG mice in TRF (n=18) vs ALF (n=20) conditions, based on RNA-Seq analysis of hippocampus tissue using DESEQ2; threshold adj.p≤0.05. Each row is one gene and normalized expression is represented by z-score. L. Gene ontology terms for the top significantly enriched functions for genes modulated by TRF in TG mice. M. Heatmap of genes showing changes in rhythmic expression in response to TRF in TG mice hippocampus, as defined by Metacycle analysis using JTK and LS statistics on normalized transcript levels detected by RNAseq across 4-time points. N. Gene ontology terms for genes that gained or lost rhythmicity under TRF. O-P. Volcano plot representation of DEGs between TG TRF and ALF at the maximum fasting time ZT12 (O) or after re-feeding at ZT18 (P). DESEQ2 analysis of RNA-Seq data, red denotes increased and blue decreased expression at adj.p<0.05. Q-R. Gene ontology terms for genes found to be differentially expressed at ZT12 (Q) or ZT18 (R) in TG mice under TRF.
FIGURE 4.
FIGURE 4.. TRF rescue of hippocampal transcription is partially mediated by Bmi1.
A-E. Heatmap representing changes in expression of genes deregulated in TG mice that were rescued by TRF. DESEQ2 analysis of RNA-Seq data at adj. pvalue<0.05 (A). Examples of gene expression changes are shown by violin plots for the top changed genes in each group (B-E) based on normalized counts. F. Top upstream regulatory factors enriched in TRF-responsive genes using GSEA; FDR q-value= 7.67E-07. G-H. Analysis of Bmi1 protein levels in brain lysates from NTG (n=8), TG ALF (n=10), and TG TRF (n=10) mice western blot (G) and quantification of Bmi1 abundance by densitometry, normalized to β-actin levels, and represented as individual values with standard error of the mean (H). I-L. Violin plots of selected Bmi1 downstream targets restored under TRF, based on normalized counts from RNAseq data. Statistical significance represents one-way ANOVA with Tukey’s multiple comparisons test *p≤0.05; **p≤0.01; ***p≤0.001 (B-E; H and I-L). ◯ female; △ male.
FIGURE 5.
FIGURE 5.. TRF significantly ameliorates amyloid pathology and disease progression in AD mice.
A-H. APP23 TG mice show progressive amyloid pathology, with plaque accumulation in the frontal and medial cortex. Pathology is substantially reduced for APP23 TG mice in TRF, as sex- and age-matched animals show only sparse plaques (white arrows) and intracellular accumulation of amyloid-β (blue arrows) in higher magnification sections (C, D, G and H). Lower magnification views with outlines indicating the magnified sections (A, B, E and F). I-K. Quantification of amyloid plaque counts (I), area occupied by plaques (J), and comparison of plaque number after binning by size (K) in APP23 TG mice in TRF (n=11) vs ALF (n=12). L. TRF slows down disease progression as seen by comparing the slopes obtained by simple linear regression of plotting total plaque number per mouse as a function of age in APP23 TG mice in TRF and ALF. M-N. In vivo analysis of plaque growth in APP23 TG mice. We labeled the initial time-stamp plaques that were present 7 weeks into the treatment by i.p. injection of Methoxy-X04 (Mx04). End point plaques were detected by immunostaining of sagittal sections with anti-amyloid antibody 82E1. Orthogonal projections of z-stacks obtained by confocal microscopy (80x) were used to trace and calculate the plaque area using ZEN Blue digital imaging software. Plot showing plaque sizes at initial (Mx04) and end point (82E1) times in APP23 TG mice under ALF or TRF from 12 mice/condition (M). Panels show representative images from single plaques analyzed in one TG TRF and one TG ALF (N; scale bar = 20 μm). O-Q. Detection of full length APP and amyloid C-terminal fractions in soluble brain lysates from TG mice on TRF (n=10) or ALF (n=10). Representative western blot image (O) and quantification of protein abundance normalized to β-actin (P-Q). R-U. TRF decreased soluble and insoluble Aβ40 and Aβ42 in brain lysates in APP23 TG mice comparing TRF (n=10) vs ALF (n=8) as quantified by ELISA (Mesoscale). V-X. TRF modulates clinically relevant blood biomarkers in treated mice. Total serum levels of amyloid-β fragments 40 and 42 were quantified by ELISA (Mesoscale) in APP23 TG mice in TRF (n=18) vs ALF (n=12) and presented individually or as ratio. Bar graphs represent individual data plots with standard error of the mean. ◯ female; △ male. Statistical significance represents the comparison between TG TRF vs ALF mice as per unpaired Students’ t-test (I-J and P-X) or one-way ANOVA with multiple comparison (K-M) * p≤0.05; **p≤0.01; *** p≤0.001; **** p≤0.0001.
FIGURE 6.
FIGURE 6.. Time-restricted feeding rescues cognitive behavior and reduces disease progression in the APP-KI AD mouse model.
A. Schematic representation of the TRF intervention in APP-KI indicating evaluations performed with relation to timescale of pathology progression. B-C. Significant changes in β-hydroxybutyrate (B) and glucose (C) in APP-KI TRF treated mice (n=9) in comparison to APP-KI ALF mice (n=8), as detected in blood and presented as individual values. D-F. Plaque counts (D) and total plaque area (E) are reduced, and frequency by size (F) shows fewer plaques at any size under TRF. Plaques assessed in Methoxy-X04 injected APP-KI under ALF and TRF at 8.5-months (n=6 per treatment). 20 μm sagittal brain section images were analyzed using ImageJ. G-I. AT8+ puncta co-occurring with plaques was assessed in Methoxy-X04 injected APP-KI under TRF and ALF. Representative images show plaque staining with MX04, P-Tau detected by AT8 antibody and merged images (G). Number of AT8+ plaques per mm2 (H), and the percentage of assessed plaques that are AT8+ (I). J. Learning and memory was tested using the Novel Object Recognition test (n=6 WT; n=10 ALF; n=8 TRF). Values above the dotted line represent greater novel object exploration. K-N. Hippocampal dependent memory deficits were assessed using the Radial Arm Maze (n=8 per condition). Representative trace plots of animal center point for the duration of Radial Arm test on day 3. Red triangles indicate reward arms (K). 5 days of Radial Arm Maze testing showed Reward arm, and total Reference and Working memory errors (L-N). All graphs plotted with standard error of the mean. ◯ female; △ male. Statistical significance as per unpaired Students’ t-test (B-E and H-I), repeat measures two-way ANOVA (F), one-way ANOVA with multiple comparisons (J), multiple unpaired t-tests for APP-KI ALF vs TRF (L), and two-way ANOVA (L-N). *p≤0.05; **p≤0.01; ***p≤0.001; **** p<0.0001.

Comment in

References

    1. Rajan KB, Weuve J, Barnes LL, McAninch EA, Wilson RS, and Evans DA (2021). Population estimate of people with clinical Alzheimer’s disease and mild cognitive impairment in the United States (2020–2060). Alzheimers Dement. 17, 1966–1975. 10.1002/alz.12362. - DOI - PMC - PubMed
    1. Colwell CS (2021). Defining circadian disruption in neurodegenerative disorders. J. Clin. Invest. 131. 10.1172/JCI148288. - DOI - PMC - PubMed
    1. Fifel K, and Videnovic A (2021). Circadian and Sleep Dysfunctions in Neurodegenerative Disorders—An Update. Front. Neurosci. 0. 10.3389/fnins.2020.627330. - DOI - PMC - PubMed
    1. Holth JK, Patel TK, and Holtzman DM (2016). Sleep in Alzheimer’s Disease–Beyond Amyloid. Neurobiol. Sleep Circadian Rhythms 2, 4–14. 10.1016/j.nbscr.2016.08.002. - DOI - PMC - PubMed
    1. Cronin P, McCarthy MJ, Lim ASP, Salmon DP, Galasko D, Masliah E, De Jager PL, Bennett DA, and Desplats P (2017). Circadian alterations during early stages of Alzheimer’s disease are associated with aberrant cycles of DNA methylation in BMAL1. Alzheimers Dement. 13, 689–700. 10.1016/j.jalz.2016.10.003. - DOI - PMC - PubMed

Publication types

Substances