. 2023 Aug;13(8):230068.
doi: 10.1098/rsob.230068. Epub 2023 Aug 23.

RNF4 and USP7 cooperate in ubiquitin-regulated steps of DNA replication

Affiliations

RNF4 and USP7 cooperate in ubiquitin-regulated steps of DNA replication

Ya-Chu Chang et al. Open Biol. 2023 Aug.

Abstract

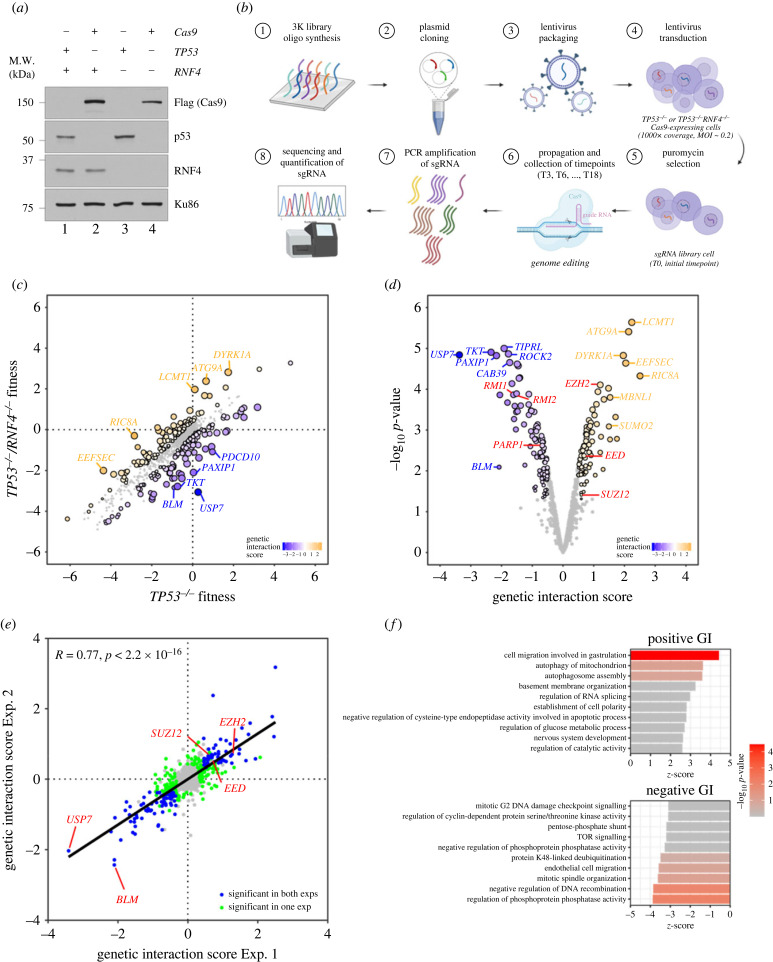
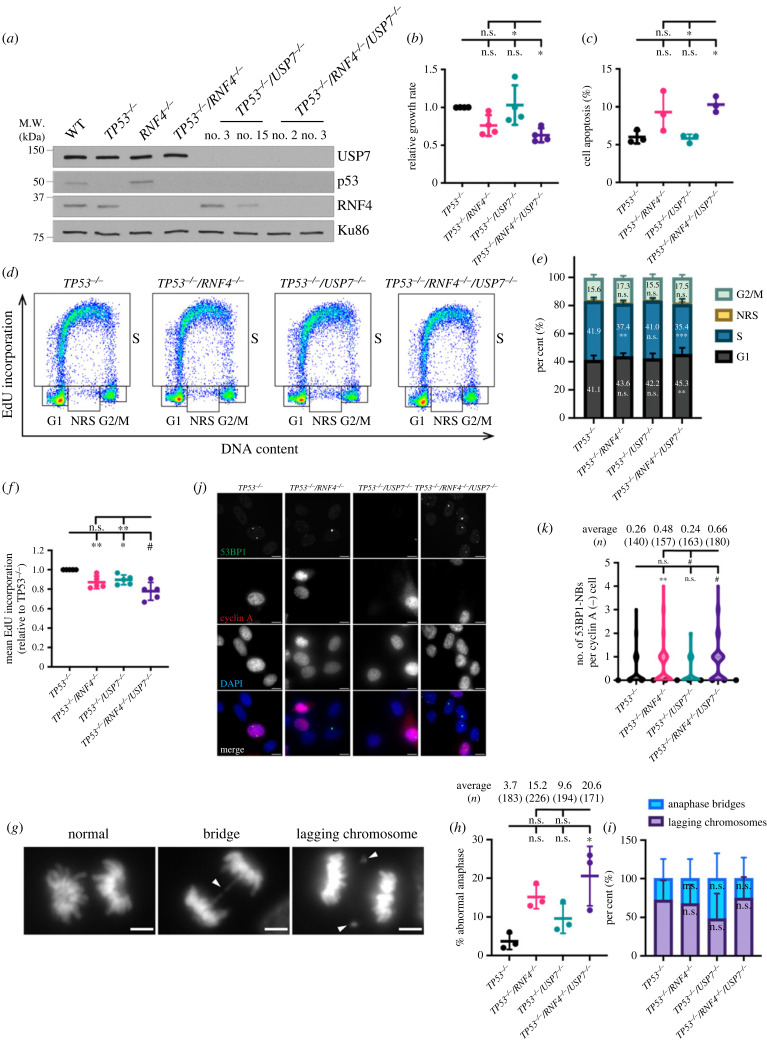
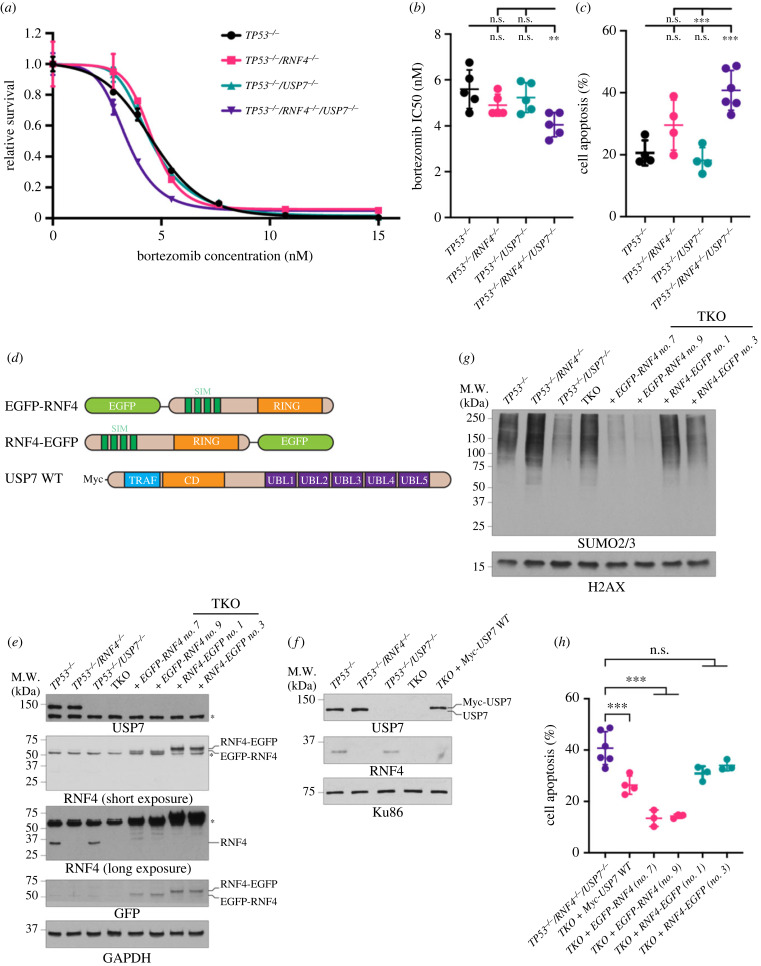
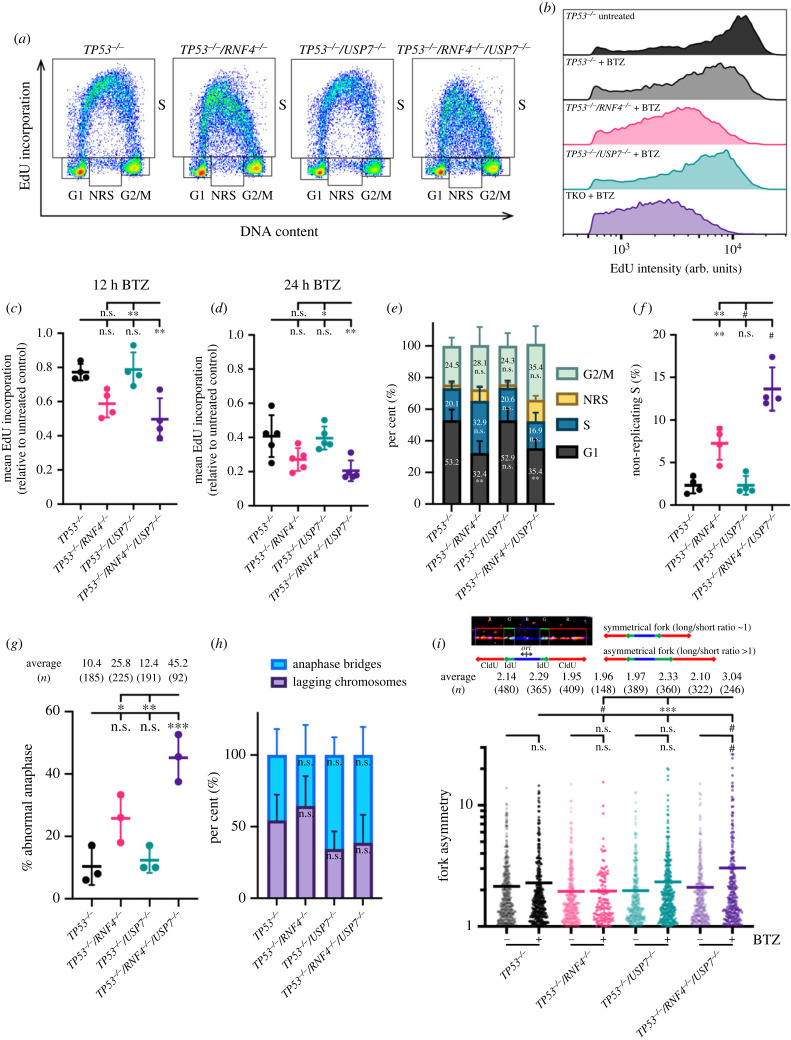
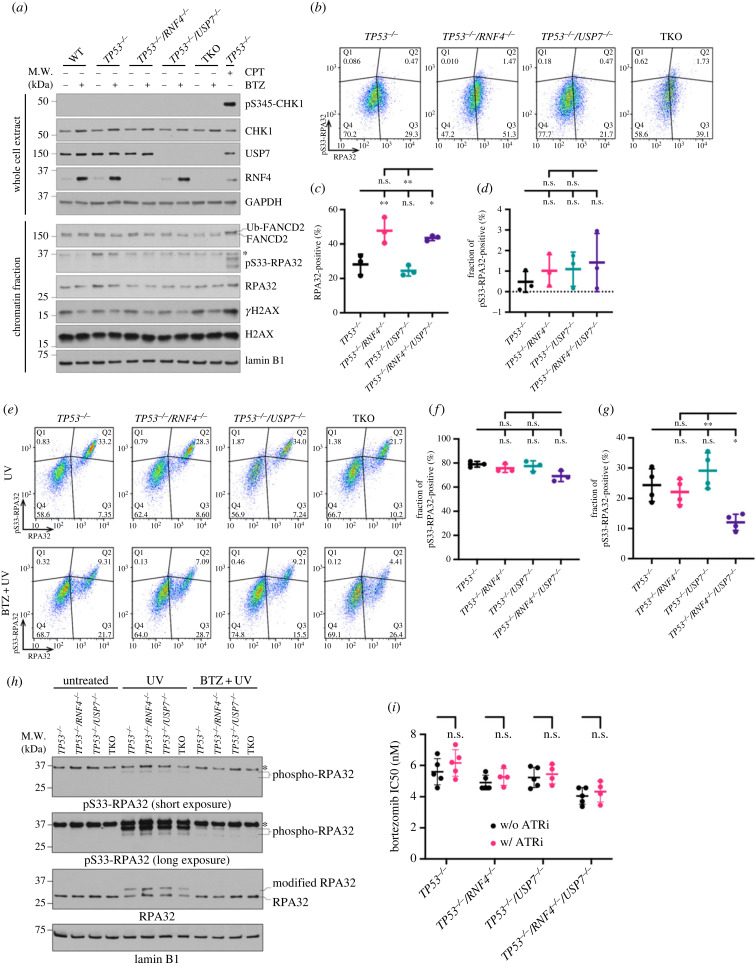
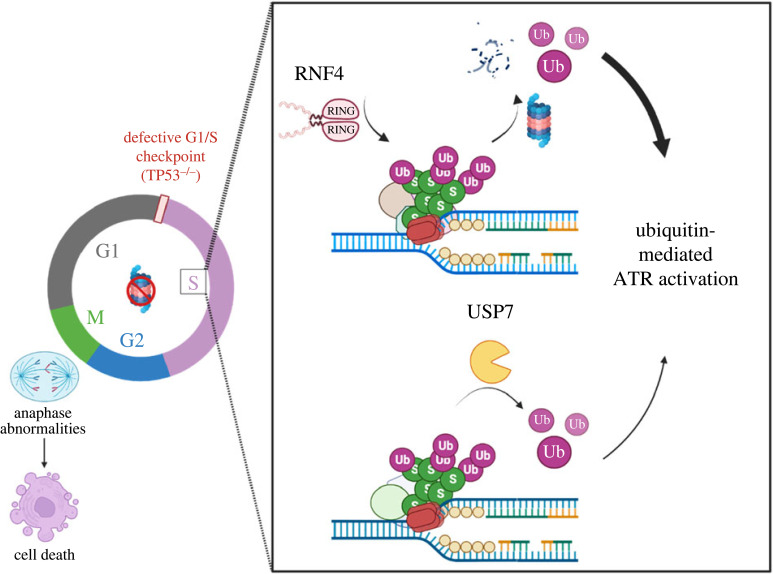
DNA replication requires precise regulation achieved through post-translational modifications, including ubiquitination and SUMOylation. These modifications are linked by the SUMO-targeted E3 ubiquitin ligases (STUbLs). Ring finger protein 4 (RNF4), one of only two mammalian STUbLs, participates in double-strand break repair and resolving DNA-protein cross-links. However, its role in DNA replication has been poorly understood. Using CRISPR/Cas9 genetic screens, we discovered an unexpected dependency of RNF4 mutants on ubiquitin specific peptidase 7 (USP7) for survival in TP53-null retinal pigment epithelial cells. TP53-/-/RNF4-/-/USP7-/- triple knockout (TKO) cells displayed defects in DNA replication that cause genomic instability. These defects were exacerbated by the proteasome inhibitor bortezomib, which limited the nuclear ubiquitin pool. A shortage of free ubiquitin suppressed the ataxia telangiectasia and Rad3-related (ATR)-mediated checkpoint response, leading to increased cell death. In conclusion, RNF4 and USP7 work cooperatively to sustain a functional level of nuclear ubiquitin to maintain the integrity of the genome.

Keywords: RNF4; STUbL; SUMO; USP7; genome stability; ubiquitin.


Conflict of interest statement

The authors declare that they have no competing interests.

Figures

Figure 1.
Figure 1.
Genetic screens in TP53−/– RNF4-proficient and RNF4-deficient cells. (a) Western blot analyses of whole cell extracts from RPE-1 WT, RNF4−/– and TP53−/– mutants with Cas9 expression. Lanes 2 and 4 are samples isolated from the cell lines used in the genetic screens. (b) Flow chart of the CRISPR–Cas9 genetic screen in RPE-1 TP53−/– RNF4-proficient and RNF4-deficient cells using a custom, targeted DNA damage response sgRNA library. (c) Scatter plot showing the fitness of RNF4-proficient and -deficient cells between T0 and T18. The fitness is calculated as the log2 fold change of each gene between T0 and T18. Positive and negative genetic interactors are indicated in orange and blue, respectively. (d) Volcano plot showing the positive and negative genetic interactors of RNF4 at T18. The genetic interaction scores are the differential fitness between RNF4-proficient and -deficient cells. Positive and negative genetic interactors are indicated in orange and blue, respectively. Other genes of interest are shown in red. (e) Scatter plot showing the genetic interaction scores in two independent biological experiments for each gene. The Pearson correlation coefficient (R) and p-value are indicated. (f) Gene ontology (GO) analysis of genetic interactors (GIs) of RNF4 at T18. The top 10 positive (top) and negative (bottom) GO:BP terms and their z-scores are shown (see Material and methods). The significance (−log10 p-value) of each term is indicated by the colour scale.
Figure 2.
Figure 2.
USP7 is synthetically sick with RNF4 deficiency. (a) Western blot of whole cell extracts from RPE-1 WT, RNF4−/–, TP53−/–, TP53−/–/RNF4−/–, TP53−/–/USP7−/– and TKO cells. (b) Proliferation rate in RNF4 and USP7 mutants normalized to TP53−/– cells. (c) Cell apoptosis measured by Annexin V-PI staining followed by FACS analysis. (d) Representative cell cycle distributions based on DNA content (DAPI) and DNA synthesis (EdU incorporation). Cell cycle phases (G1, S, G2/M and NRS) are indicated. (e) Cell cycle distribution of each cell line. Cumulative bars representing the average percentage of G1-, S-, G2/M- or NRS-phase populations from three experiments are shown. Error bars indicate standard deviations (SDs). Significance was measured using a two-way ANOVA with the Geisser–Greenhouse correction and Šidák's multiple comparisons test, n.s.: not significant, **p ≤ 0.01, #p ≤ 0.0001. (f) DNA synthesis in S-phase cells measured by EdU/DAPI staining and normalized to TP53−/– cells. (g) Representative images of normal and abnormal anaphases. White arrows indicate the lagging chromosome or the anaphase bridge. The scale bar is 5 µm. (h) Anaphase abnormalities scored by examining anaphase cells with DAPI staining. Bars represent the average of three biological experiments and the total numbers of anaphases scored are shown. Significance was measured using an ordinary one-way ANOVA with Tukey's multiple comparisons test, n.s.: not significant, *p ≤ 0.05. (i) The breakdown of abnormal anaphases in each cell line. Cumulative bars representing the average percentage of anaphase bridges or lagging chromosome from three experiments are shown. Error bars indicate SD. Significance was measured using an ordinary two-way ANOVA with Šidák's multiple comparisons test, n.s.: not significant. (j) Representative images of 53BP1-NB immunofluorescent staining. The scale bar is 10 µm. (k) Violin plot showing the number of 53BP1-NBs in G1 (cyclinA-negative) cells. The total numbers of G1 cells scored from two independent experiments are shown. Significance was measured using a Kruskal–Wallis with Dunn's multiple comparisons test, n.s.: not significant, **p ≤ 0.01, #≤ 0.0001. (b,c,f) Each data point represents the average value from independent plates in an experiment. Bars and error bars indicate the mean and SD across multiple biological experiments. Significance was measured using an ordinary one-way ANOVA with Tukey's multiple comparisons test; n.s., not significant; *p ≤ 0.05; **p ≤ 0.01; #p ≤ 0.0001.
Figure 3.
Figure 3.
Bortezomib causes elevated cell apoptosis in TKO cells. (a) Representative dose–response curve to bortezomib measured by CellTiter-Glo cell viability assay. Cell survival is normalized to the untreated control. The mean survival with SD of each concentration is shown. The asymmetrical (five-parameter) logistic dose–response model is used to fit the curve. (b) Bortezomib IC50 values. Each data point is an IC50 value from an experiment. Bars and error bars indicate the mean with SD. (c) Cell apoptosis after 48 h of bortezomib measured by Annexin V-PI staining. Each data point is a biological replicate and the mean with SD is shown. (d) Cartoon schematics of constructs used to complement TKO cells. EGFP, enhanced green fluorescent protein; SIM, SUMO-interacting motif; RING, really interesting new gene; TRAF, tumour necrosis factor receptor-associated factor; CD, catalytic domain; UBL, ubiquitin-like. (e) Western blot analyses of whole cell extracts of TKO cells expressing either EGFP-RNF4 or RNF4-EGFP. (f) Western blot analyses of whole cell extracts of TKO cells expressing WT USP7. (g) Western blot analyses of SUMOylated chromatin-bound proteins of TKO cells expressing either EGFP-RNF4 or RNF4-EGFP. Cells were treated with 10 µM of MG132 and 1 mM of HU for 4 h before collecting. (h) Cell apoptosis after 48 h of bortezomib measured by Annexin V-PI staining in TKO and complemented cells. (b,c,h) Each data point represents the average value from independent plates in an experiment. Bars and error bars indicate the mean and SD across multiple biological experiments. Significance was measured using an ordinary one-way ANOVA with Tukey's multiple comparisons test; n.s., not significant; **p ≤ 0.01; ***p ≤ 0.001.
Figure 4.
Figure 4.
DNA synthesis is significantly reduced in TKO treated with bortezomib. (a) Representative cell cycle distributions based on DNA content (DAPI) and DNA synthesis (EdU incorporation) after 12 h of BTZ treatment. Cell cycle phases (G1, S, G2/M and NRS) are indicated. (b) Representative histograms of DNA synthesis in S-phase cells. Cells were incubated with or without BTZ for 12 h. (c,d) DNA synthesis in S-phase cells measured by EdU/DAPI staining and normalized to the untreated control. Cells were treated with BTZ for 12 h (c) or 24 h (d). (e) Cell cycle distribution of each cell line treated with BTZ for 24 h. Cumulative bars representing the average percentage of G1-, S-, G2/M- or NRS-phase populations are shown. Error bars indicate SD. Significance was measured using a two-way ANOVA with the Geisser–Greenhouse correction and Šidák's multiple comparisons test, n.s.: not significant, **p ≤ 0.01. (f) Percentage of NRS-phase cells in each cell line treated with BTZ for 24 h. (g) Anaphase abnormalities scored by DAPI staining following treatment with BTZ for 24 h. Representative images are shown in figure 2g. Bars represent the average of three biological experiments and the total numbers of anaphases scored are shown. (c,d,f,g) Ordinary one-way ANOVA with Tukey's multiple comparisons test, n.s.: not significant, *p ≤ 0.05, **p ≤ 0.01, ***p ≤ 0.001, #p ≤ 0.0001. (h) The breakdown of abnormal anaphases in each cell line. Cumulative bars representing the average percentage of anaphase bridges or lagging chromosome from three experiments are shown. Error bars indicate SD. Significance was measured using an ordinary two-way ANOVA with Šidák's multiple comparisons test, n.s.: not significant. (i) Fork asymmetry analysed by DNA combing. Fork asymmetry was calculated as the ratio of the long track over the short track of sister forks flanking each origin (ori). Top, representative sister forks; bottom, quantification of fork asymmetry in cells incubated with or without BTZ for 12 h. Average fork asymmetry and the number of sister forks quantified (n) are listed. Significance was measured using a one-way Kruskal–Wallis test with Dunn's multiple comparisons tests; n.s., not significant; ***p ≤ 0.001; #p ≤ 0.0001.
Figure 5.
Figure 5.
TKO cells are susceptible to bortezomib-mediated ATR suppression. (a) Western blot analyses of whole cell extracts and chromatin fractions of cells incubated without or with BTZ for 12 h. TP53−/– cells treated with 1 µM of camptothecin (CPT) for 12 h was used as a control for ATR activation. Asterisk indicates a non-specific band. (b) Representative analytic flow cytometry plots for chromatin-bound RPA32 and pS33-RPA32. Cells were incubated in BTZ for 12 h. (c) Quantification of RPA32-positive cells after 12 h of bortezomib treatment based on analytic flow cytometry. (d) Quantification of the fraction of pS33-RPA32-positive cells in total RPA32-positive cells as in (c). The fraction of pS33-RPA32-positive cells in total RPA32-positive cells was calculated as Q2/(Q2 + Q3) shown in (b). (c,d) Each data point represents the average value from independent plates in an experiment. Bars and error bars indicate the mean and SD across multiple biological experiments. Significance was measured using an ordinary one-way ANOVA with Tukey's multiple comparisons test, n.s.: not significant, *p ≤ 0.05, **p ≤ 0.01. (e) Representative analytic flow cytometry plots for chromatin-bound RPA32 and pS33-RPA32. Cells were grown with or without BTZ for 12 h prior to exposure to 100 J m−2 of UV and collected after 2 h. (f,g) Quantification of the fraction of pS33-RPA32-positive cells in total RPA32-positive cells with UV alone (f) or bortezomib plus UV (g). Each data point represents the average value from independent plates in an experiment. Bars and error bars indicate the mean and SD across multiple biological experiments. Significance was measured using an ordinary one-way ANOVA with Tukey's multiple comparisons test; n.s., not significant; *p ≤ 0.05; **p ≤ 0.01. (h) Western blot analyses of chromatin fractions of cells under untreated, UV alone or bortezomib plus UV treatment. (i) Bortezomib IC50 values in the presence or absence of 200 nM of ATR inhibitor. Each data point is an IC50 value from an experiment. Bars and error bars indicate the mean with SD. Significance was measured by ordinary two-way ANOVA with Šidák's multiple comparisons test; n.s., not significant.
Figure 6.
Figure 6.
RNF4 and USP7 cooperate in ubiquitin-regulated steps of DNA replication. TP53−/– cells have defective G1/S checkpoint, leading to unrestrained G1/S transition even in the presence of DNA damage. With a functional intra-S checkpoint response, cells are capable of pausing and repairing the lesions to prevent premature mitotic entry if cells accumulate too much damage. RNF4, a SUMO-targeted E3 ubiquitin ligase, facilitates the turnover of SUMOylated and ubiquitinated proteins accumulated upon replication stress. USP7, on the other hand, maintains the SUMO and ubiquitin balance at the replication forks by deubiquitinating substrate proteins. These two seemingly opposite actions, however, both sustain the nuclear ubiquitin pool and are particularly critical when proteasome activity is inhibited, where RNF4 and USP7 play a major and a minor role, respectively. Depletion of the nuclear ubiquitin pool suppresses the ATR-mediated checkpoint response upon proteasome inhibition. TKO cells exhibit significantly increased fork asymmetry and reduced DNA synthesis when the proteasome is inhibited. A compromised ATR-mediated checkpoint upon proteasome inhibition permits premature mitotic entry in TKO cells, leading to high levels of anaphase abnormalities and presumably programmed cell death.

Similar articles

Cited by

References

    1. Blow JJ, Ge XQ, Jackson DA. 2011. How dormant origins promote complete genome replication. Trends Biochem. Sci. 36, 405-414. (10.1016/j.tibs.2011.05.002) - DOI - PMC - PubMed
    1. Zhong Y, et al. 2013. The level of origin firing inversely affects the rate of replication fork progression. J. Cell Biol. 201, 373-383. (10.1083/jcb.201208060) - DOI - PMC - PubMed
    1. Bielinsky AK, Gerbi SA. 2001. Where it all starts: eukaryotic origins of DNA replication. J. Cell Sci. 114, 643-651. (10.1242/jcs.114.4.643) - DOI - PubMed
    1. Aguilera A, García-Muse T. 2013. Causes of genome instability. Annu. Rev. Genet. 47, 1-32. (10.1146/annurev-genet-111212-133232) - DOI - PubMed
    1. Saldivar JC, Cortez D, Cimprich KA. 2017. The essential kinase ATR: ensuring faithful duplication of a challenging genome. Nat. Rev. Mol. Cell Biol. 18, 622-636. (10.1038/nrm.2017.67) - DOI - PMC - PubMed

Publication types