. 2023 Oct:218:198-209.
doi: 10.1016/j.ymeth.2023.08.009. Epub 2023 Aug 20.

Probing excited state 1Hα chemical shifts in intrinsically disordered proteins with a triple resonance-based CEST experiment: Application to a disorder-to-order switch

Affiliations

Probing excited state 1Hα chemical shifts in intrinsically disordered proteins with a triple resonance-based CEST experiment: Application to a disorder-to-order switch

Ajith Kumar et al. Methods. 2023 Oct.

Abstract

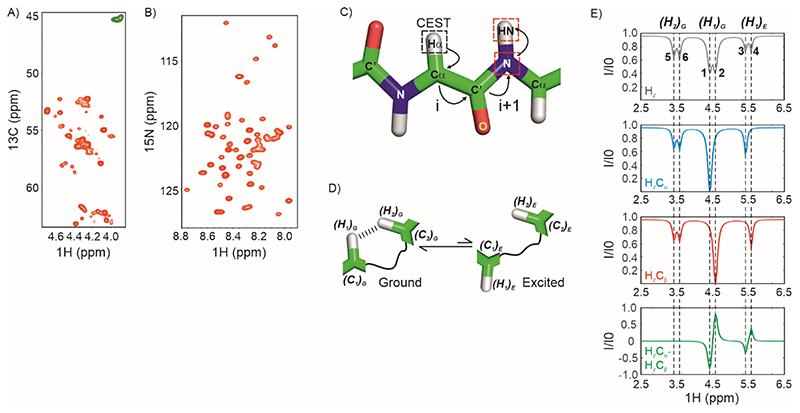
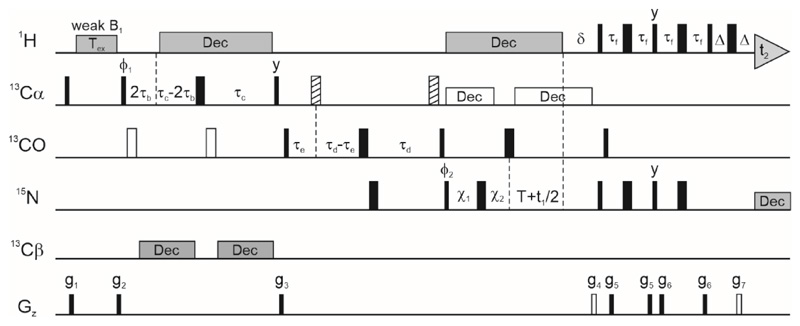
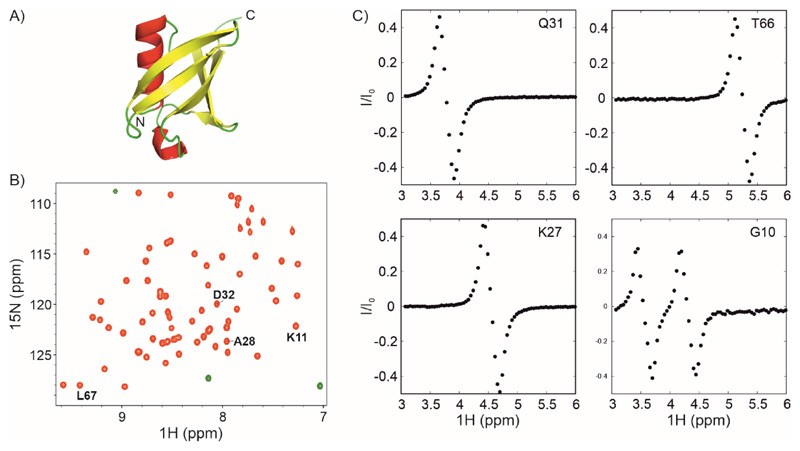
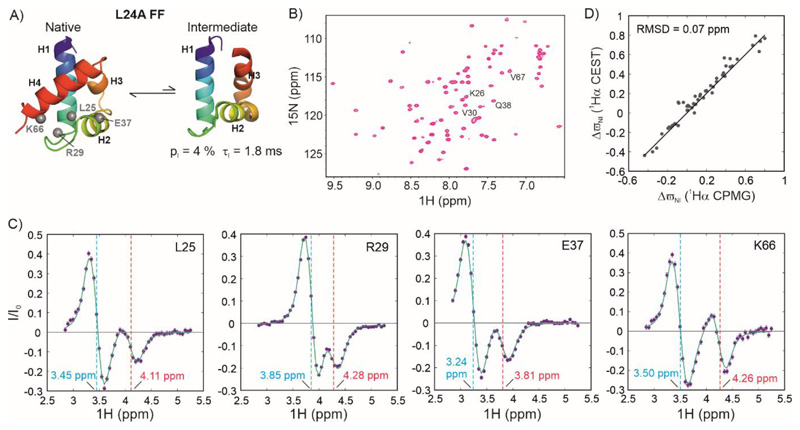
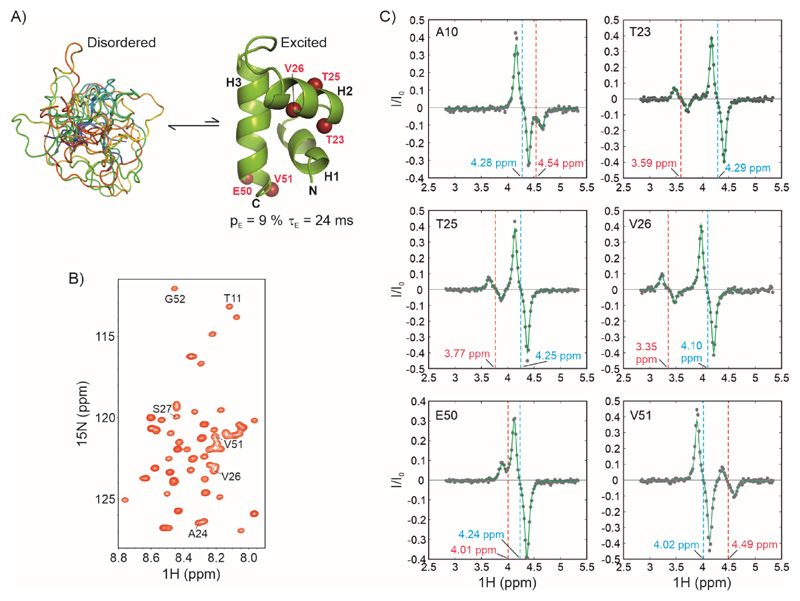
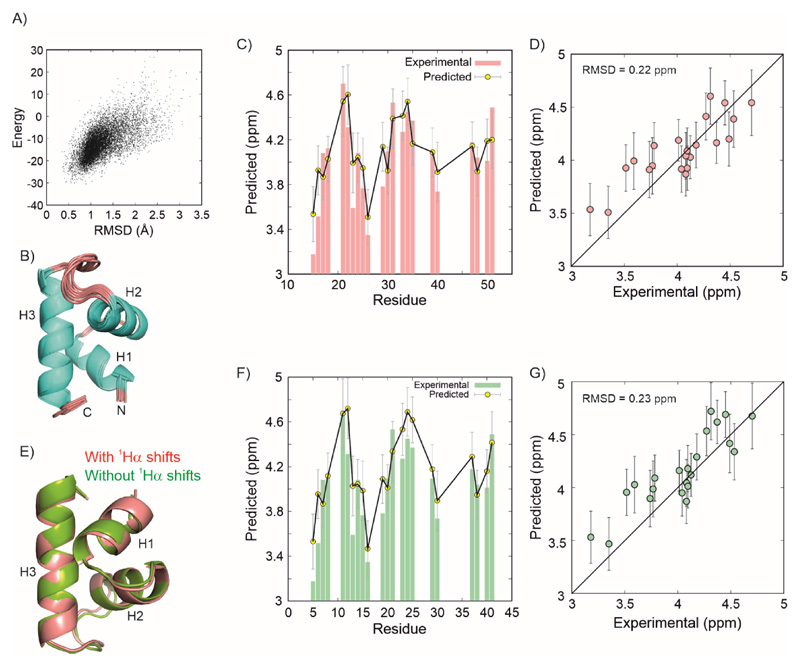
Over 40% of eukaryotic proteomes and 15% of bacterial proteomes are predicted to be intrinsically disordered based on their amino acid sequence. Intrinsically disordered proteins (IDPs) exist as heterogeneous ensembles of interconverting conformations and pose a challenge to the structure-function paradigm by apparently functioning without possessing stable structural elements. IDPs play a prominent role in biological processes involving extensive intermolecular interaction networks and their inherently dynamic nature facilitates their promiscuous interaction with multiple structurally diverse partner molecules. NMR spectroscopy has made pivotal contributions to our understanding of IDPs because of its unique ability to characterize heterogeneity at atomic resolution. NMR methods such as Chemical Exchange Saturation Transfer (CEST) and relaxation dispersion have enabled the detection of 'invisible' excited states in biomolecules which are transiently and sparsely populated, yet central for function. Here, we develop a 1Hα CEST pulse sequence which overcomes the resonance overlap problem in the 1Hα-13Cα plane of IDPs by taking advantage of the superior resolution in the 1H-15N correlation spectrum. In this sequence, magnetization is transferred after 1H CEST using a triple resonance coherence transfer pathway from 1Hα (i) to 1HN(i + 1) during which the 15N(t1) and 1HN(t2) are frequency labelled. This approach is integrated with spin state-selective CEST for eliminating spurious dips in CEST profiles resulting from dipolar cross-relaxation. We apply this sequence to determine the excited state 1Hα chemical shifts of the intrinsically disordered DNA binding domain (CytRN) of the bacterial cytidine repressor (CytR), which transiently acquires a functional globally folded conformation. The structure of the excited state, calculated using 1Hα chemical shifts in conjunction with other excited state NMR restraints, is a three-helix bundle incorporating a helix-turn-helix motif that is vital for binding DNA.

Keywords: Alpha proton; Chemical exchange saturation transfer; Conformational change; Intrinsically disordered proteins; Nuclear magnetic resonance spectroscopy; Protein dynamics.


Conflict of interest statement

Declaration of Competing Interest The authors declare that they have no known competing financial interests or personal relationships that could have appeared to influence the work reported in this paper.

Figures

Figure 1
Figure 1. Strategy for acquiring 1Hα CEST data on IDPs.
A) The 1Hα region of a constant-time 1H-13C HSQC spectrum of U-13C,15N labelled CytRN. Green resonances arise from Gly which do not have a scalar coupled sidechain 13Cβ. B) 1H-15N HSQC spectrum of CytRN. C) The coherence transfer pathway in the 1Hα CEST experiment reported here. CEST is carried out on 1Hα (black dashed square) and the magnetization is then transferred from 1Hα(i) through 13Cα(i) and 13CO(i) to 15N (i+1) and then to 1HN(i+1) for detection. Red dashed squares indicate nuclei that are frequency labelled in the experiment. D) Cartoon representation of conformational exchange between ground and excited states of a protein where the alpha proton H1 comes close (< 5 Å) to H2 in the ground state. E) The spin-state-selective approach for acquiring proton CEST without interference from dipolar cross-relaxation. (Top) 1H CEST profile of an alpha proton resonating at 4.5 ppm (major dip), exchanging with a second conformation where the chemical shift of the 1Hα is 5.5 ppm (minor dip). The 1Hα is proximal to a second 1Hα which results in an NOE dip at 3.5 ppm. There is no 13C-decoupling during the CEST period; therefore doublets separated by 1JHαCα are seen for each dip. (Middle) Spin-state-selective CEST data selecting for HzCα (blue) and HzCβ (red). (Bottom) CEST profile of HzCα-HzCβ =2HzCz, where the NOE dip cancels out (green).
Figure 2
Figure 2. The pulse sequence for acquiring HACACONNH-based 1Hα CEST data.
The 1H carrier is centred on the water resonance except during the CEST period and the 15N carrier at ~ 118 ppm, while the 13C carrier is placed at 58 ppm till gradient g3 and then jumped to 176 ppm for the rest of the pulse sequence. All pulses are applied along the x-axis unless specified otherwise. Narrow and wide rectangles represent 90° and 180° pulses respectively. Open rectangles correspond to rectangular pulses applied 118 ppm off-resonance while the hashed rectangles are rectangular pulses applied -118 ppm off-resonance. 1H and 15N pulses are applied at the highest power while 13C 90° and 180° pulses are applied at RF field amplitudes of ξ/15 and ξ/3 Hz respectively, where ξ is the frequency difference in Hz between the 13Cα and 13CO spectral bands (90). 1H decoupling is implemented via a ~6 kHz WALTZ-16 (91) composite pulse decoupling pattern. Off-resonance 13Cα decoupling is carried out with a cosine modulated SEDUCE-1 pattern (92, 93) with a pulse width of 315 μs (at 600 MHz B0 field strength), and 15N decoupling during acquisition is carried out with a ~ 1 kHz WALTZ-16 pattern. WURST-2 adiabatic decoupling (94) is used for 13Cβ decoupling in the 16.5-41.5 ppm and 68-72 ppm bands. The phase cycling used in the sequence is: ϕ1 = (-y,y), ϕ2 = (x,x,-x,-x) and receiver = (x,-x,-x,x). The delays used in the experiment are: τb = 1.8 ms, τc = 4.4 ms, τd = 12.4 ms, τe = 5 ms, τf = 2.3 ms, T = 12.4 ms, δ = 5.5 ms and Δ = 0.5 ms. The amplitudes and durations of the various gradients in (G/cm, ms) are: g1: (12000, 0.5), g2: (-8343, 0.5), g3: (10000, 0.8), g4: (30000, 1.25), g5: (4000, 0.3), g6: (2000, 0.4), g7: (30400, 0.125). The two gradients g4 and g7 represented as open rectangles are required for coherence selection. Delays χ1 and χ2 are set to the larger of the two values (T-t1/2, 0) and (0, t1/2-T) respectively, and this allows 15N chemical shift evolution in t1 to occur in a semi-constant manner (72, 95). Quadrature detection in the F1 dimension is implemented using enhanced sensitivity gradient coherence selection (–98).
Figure 3
Figure 3. 1Hα CEST on U-13C,15N labelled ubiquitin.
A) Three-dimensional structure of ubiquitin showing helices, sheets and loops in red, yellow and green respectively (PDB ID: 1UBQ (99)). B) 1H-15N HSQC spectrum of ubiquitin. C) 1Hα CEST profiles of selected residues in ubiquitin that were obtained by analyzing the i+1 correlations indicated in the HSQC spectrum in panel B. 1Hα CEST data were acquired using the pulse sequence in Figure 2. The 1Hα CEST profile for Gly10 shows two dips arising from each of the two diastereotopic 1Hα protons of Gly10.
Figure 4
Figure 4. Characterizing exchange in the folded L24A FF domain using 1Hα CEST.
A) Cartoon representation of the native (31) and intermediate states of L24A FF (PDB ID:2L9V (31)) in exchange on the millisecond timescale. B) 1H-15N HSQC spectrum of L24A FF. Resonances whose 1Hα CEST profiles are quantified in panel C are labelled in the spectrum. C) 1Hα CEST profiles of selected resonances of L24A FF. Cyan and red dashed lines indicate the chemical shifts of the native and intermediate states respectively. D) Correlation between the 1Hα chemical shifts of L24A FF intermediate states acquired using 1Hα CPMG (y-axis, (31)) and 1Hα CEST (x-axis). The solid line depicts the y=x function.
Figure 5
Figure 5. Characterizing exchange in the IDP CytRN using 1Hα CEST.
A) CytRN exchanges between a disordered ensemble and a three-helix bundle folded state (52). B) 1H-15N HSQC spectrum of disordered CytRN showing limited spectral dispersion characteristic of an IDP. Resonances for which 1Hα CEST profiles are quantified in panel C are labelled on the spectrum (except A10, which is not a part of the fragment included in the structure calculation). C) 1Hα CEST profiles of selected residues of CytRN. The chemical shift positions of the ground (disordered) and excited (folded) states are indicated by cyan and red dashed lines respectively.
Figure 6
Figure 6. Structure of the CytRN excited state calculated chemical shifts and RDCs.
A) Composite chemical shift and Rosetta energy score of structures plotted against the RMSD of each structure to the lowest energy structure. B) Overlay of the cartoon representations of the 10 structures with the lowest energy. Comparison between the experimental (red bars) and predicted 1Hα chemical shifts (yellow circles) for the CytRN excited state shown as a function of residues (C) and as a correlation plot (D). Predictions were done using Sparta+ on the lowest energy structure. Error bars are uncertainties in residue-specific chemical shift predictions from Sparta+. E) Overlay of the CytRN excited state calculated without (green) and with (red) 1Hα chemical shifts. F,G) A comparison of the same experimental data as in panels (C) and (D) with predictions made using Sparta+ (84) on the lowest energy structure calculated without using input 1Hα chemical shifts (52).

Similar articles

Cited by

References

    1. Uversky VN. Intrinsically disordered proteins and their “mysterious”(meta) physics. Front Phys. 2019;7:10.
    1. Wright PE, Dyson HJ. Linking folding and binding. Curr Opin Struct Biol. 2009;19:31. - PMC - PubMed
    1. Gianni S, Dogan J, Jemth P. Coupled binding and folding of intrinsically disordered proteins: what can we learn from kinetics? Curr Opin Struct Biol. 2016;36:18. - PubMed
    1. Uversky VN. Unusual biophysics of intrinsically disordered proteins. Biochim Biophys Acta: Proteins Proteomics. 2013;1834:932. - PubMed
    1. Babu MM. The contribution of intrinsically disordered regions to protein function, cellular complexity, and human disease. Biochem Soc Trans. 2016;44:1185. - PMC - PubMed

Publication types

LinkOut - more resources