. 2023 Aug 22;14(1):4521.
doi: 10.1038/s41467-023-40243-8.

TUG1-mediated R-loop resolution at microsatellite loci as a prerequisite for cancer cell proliferation

Affiliations

TUG1-mediated R-loop resolution at microsatellite loci as a prerequisite for cancer cell proliferation

Miho M Suzuki et al. Nat Commun. .

Abstract

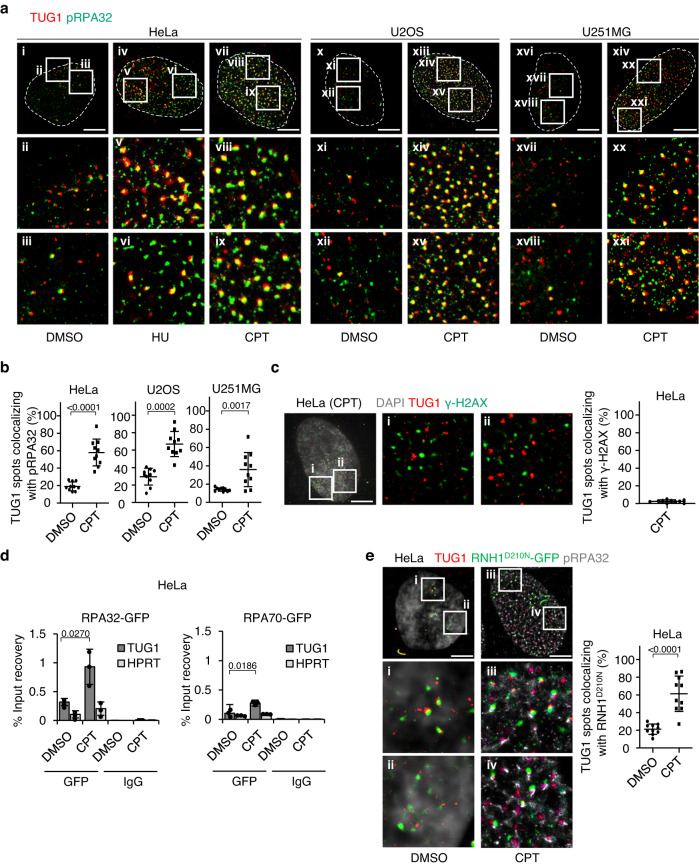
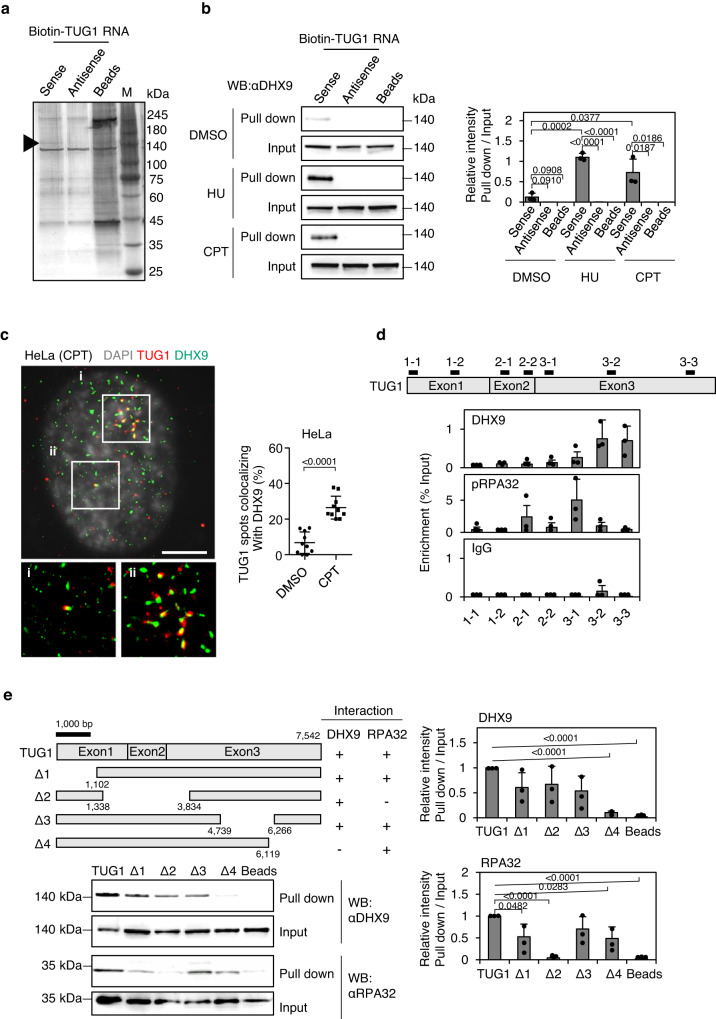
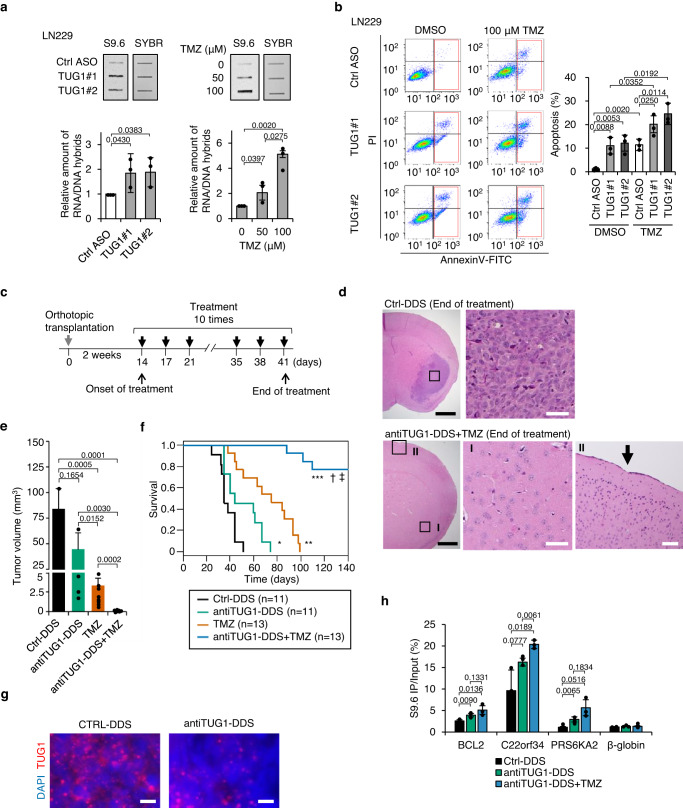
Oncogene-induced DNA replication stress (RS) and consequent pathogenic R-loop formation are known to impede S phase progression. Nonetheless, cancer cells continuously proliferate under such high-stressed conditions through incompletely understood mechanisms. Here, we report taurine upregulated gene 1 (TUG1) long noncoding RNA (lncRNA), which is highly expressed in many types of cancers, as an important regulator of intrinsic R-loop in cancer cells. Under RS conditions, TUG1 is rapidly upregulated via activation of the ATR-CHK1 signaling pathway, interacts with RPA and DHX9, and engages in resolving R-loops at certain loci, particularly at the CA repeat microsatellite loci. Depletion of TUG1 leads to overabundant R-loops and enhanced RS, leading to substantial inhibition of tumor growth. Our data reveal a role of TUG1 as molecule important for resolving R-loop accumulation in cancer cells and suggest targeting TUG1 as a potent therapeutic approach for cancer treatment.


Conflict of interest statement

The authors declare no competing interests.

Figures

Fig. 1
Fig. 1. RS rapidly induces TUG1 expression.
a Heat map representing fold changes in lncRNA expression after HU or CPT treatment. The experiments were conducted in duplicate. 14 lncRNAs with upregulation on average > 2.0-fold of HU-1, HU-2, CPT-1, and CPT-2 are indicated. F. C., fold change. b RT-qPCR analyzes of TUG1 expression in cell-cycle-synchronized HeLa/Fucci2 cells treated with DMSO, HU, or CPT for 2 h. Mean ± SD, n = 3. Two-sided t-test. c Representative images of TUG1 smFISH in HeLa/Fucci2 cells treated with DMSO, HU, or CPT for 2 h. Scale bar = 10 μm. d Quantification of smFISH experiments. The y-axis indicates the relative fold-number of TUG1 spots in the nucleus and cytoplasm after 0, 2, 4, 6, and 8 h of HU treatment compared with the median number of TUG1 spots in the S/G2 nucleus at 0 h. e Inhibition of transcription by DRB suppresses TUG1 induction. HeLa/Fucci2 cells were incubated with DRB for 30 min before treatment with HU or CPT for 2 h. N, nucleus, C, cytoplasm. f Relative fold-number of TUG1 spots after bleomycin (BLM) treatment compared with the median number of TUG1 spots in the S/G2 nucleus of DMSO-treated cells at 0 h. For d, e, and f, more than 60 HeLa/Fucci2 cells were analyzed per sample. Two-tailed Wilcoxon rank sum test. g Top, Western blotting of HeLa/Fucci2 cells treated with an inhibitor of ATR (VE-821) or CHK1 (SCH900776) for 30 min before treatment of HU or CPT for 2 h. Bottom, bar graph generated by quantifying the Western blot. Mean ± SD, n = 3. Two-sided t-test. h Relative fold-number of TUG1 spots in cells treated with VE-821 or SCH900776 for 30 min before HU treatment for 2 h. More than 30 cells were analyzed per sample using one-way ANOVA and Tukey’s multiple comparison tests. For d, e, f, and h, in the box plot, center lines show medians; box limits indicate the 25th and 75th percentiles; whiskers extend 1.5 times the interquartile range from the 25th and 75th percentiles. The experiments were conducted in triplicate with similar results. Source data are provided as a Source Data file.
Fig. 2
Fig. 2. TUG1 interacts with pRPA32 at R-loop.
a Super-resolution images of the nucleus (dotted line) co-stained with pRPA32 (green) and TUG1 smFISH (red). (i-ix) HeLa cell treated with DMSO (untreated control), or 2 mM HU for 2 h, or 10 μM CPT for 2 h. (x-xv) U2OS cell treated with DMSO or 10 μM CPT for 2 h. (xvi-xxi) U251MG cell treated with DMSO or 10 μM CPT for 2 h. Magnified regions where TUG1 and pRPA32 colocalize in the top panels were shown in the bottom two panels. Three independent experiments were carried out with similar results (Supplementary Table 1) and representative images are shown. Scale bar = 5 μm. b The percentage of TUG1 spots colocalizing with pRPA32 relative to total number of TUG1 spots in each cell. c Left, representative super-resolution images of TUG1 (red) and γ-H2AX (green) in HeLa cell treated with 10 μM CPT for 2 h. Magnified regions in the left panel were shown in middle (i) and right (ii) panels. Scale bar = 5 μm. Right, the percentage of TUG1 spots colocalizing with γ-H2AX relative to the total number of TUG1 spots in each cell. d RIP assay using GFP antibody indicating the interaction between RPA32 or RPA70 and TUG1 after treatment with 10 μM CPT in HeLa cells expressing RPA32-GFP or RPA70-GFP. HPRT and IgG-bound RNA were taken as negative controls. Data are mean ± SD, n = 3. Two-sided t-test. e Left top, super-resolution images of HeLa cell transfected with catalytically inactive RNase H1 (RNH1D210N-GFP, green) co-stained with pRPA32 (white) and TUG1 smFISH (red). Cell was treated with DMSO or 10 μM CPT for 2 h. Left bottom panels are magnified regions. Scale bar = 5 μm. Right, the percentage of TUG1 spots colocalizing with RNH1D210N-GFP relative to the total number of TUG1 spots in each cell. For b, c, and e, median, upper and lower quartile range from 10 independent cells are indicated. Two-sided t-test. Three independent experiments were carried out with similar results (Supplementary Table 1) and a representative image is shown. Source data are provided as a Source Data file.
Fig. 3
Fig. 3. TUG1 interacts with DHX9.
a Silver-staining gel image of RNA pull-down experiment using Biotin-labeled TUG1 RNA and HeLa cells treated with 2 mM HU for 2 h. Lane M, marker proteins (sizes in kDa). The arrowhead indicates DHX9. Two independent experiments were carried out with similar results and a representative image is shown. b Left, Western blotting of DHX9 pulled down with TUG1. HeLa cells treated with DMSO (untreated control), 2 mM HU, or 10 μM CPT for 2 h were used. Right, bar graph generated by quantifying the Western blot. Data are means ± SD, n = 3. Two-sided t-test. c Top, super-resolution images of HeLa cells treated with 10 μM CPT for 2 h were co-stained with DAPI (white), DHX9 (green), and TUG1 smFISH (red). Bottom panels are magnified regions where TUG1 and DHX9 colocalize in the top panels. Scale bar = 5 μm. Right, the percentage of TUG1 spots colocalizing with DHX9 relative to total number of TUG1 spots in each cell. HeLa cells were treated with DMSO or 10 μM CPT for 2 h. Median, upper and lower quartile range from 10 independent cells are indicated. Two-sided t-test. Three independent experiments were carried out with similar results (Supplementary Table 1) and representative images are shown. d CLIP assay of DHX9 and pRPA32 performed in HeLa. Associated TUG1 RNA was quantified by qPCR using primers indicated in the upper TUG1 scheme. Data are presented as % input, mean ± SD, n = 3. e Left, Western blotting of DHX9 and RPA32 pulled down with TUG1-full length (TUG1) or TUG1-deletion RNA (Δ1-Δ4) indicated in the upper TUG1 scheme. See also Supplementary Fig. 3a. Right, bar graph generated by quantifying the Western blot. Signal intensities are normalized to the Input. Values are relative to TUG1-full length. Data are means ± SD, n = 3. Two-sided t-test. Source data are provided as a Source Data file.
Fig. 4
Fig. 4. TUG1 resolves R-loops via DHX9 activity.
a KD efficiency by ASOs analyzed by RT-qPCR in HeLa/Fucci2 cells at indicated time after transfection. Mean ± SD, n = 3. b Left, Slot blot with S9.6 antibody. HeLa/Fucci2 cells transfected with ASOs for 4 h were treated with 100 μM DRB for the last 40 min to show transcriptional source of the R-loops. Genomic DNA was treated with RNase H (RNH) in vitro before blotting. SYBR gold staining is a loading control. Right, quantification of S9.6 signal. Mean ± SD, n = 3. Two-sided t-test. c Top, DNA fiber assay in four cell lines transfected with ASOs for 4 h. Black bar, median value. Mann–Whitney U test. Bottom left, representative fiber images. Bottom right, median replication speeds. The experiment was repeated three times (Supplementary Table 3). d Top left, HeLa/Fucci2 cells transfected with ASOs for 24 h. S/G2 cells are shown in green. Scale bar = 50 μm. Top right, cell-cycle analysis of cells treated with ASOs for 24 h by FCM. Mean ± SD, n = 3. Two-sided t-test. Bottom, representative profiles of cell-cycle distribution after 24 h of TUG1 KD. e Schematic presentation of tethering of TUG1 on LacO-repeat regions by LacO-LacR and PP7-PCP system in U2OS 2-6-3/TA cells combined with Doxycycline (Dox)-inducible transcriptional activation. Arrows indicate primer positions for DRIP-qPCR. f Quantification of RNA/DNA hybrids accumulated in transcribed CFP and β-globin gene (control) by DRIP-qPCR assay (see also Supplementary Fig. 5a). g As in f, relative amount of RNA/DNA hybrids in U2OS 2-6-3/TA cells expressing deletion mutants of TUG1 compared with those in the cells without TUG1 expression (vector) under Dox induction. For g and f, Mean ± SE, n = 5. Two-sided t-test. h Top left, levels of DHX9 in U2OS 2-6-3/TA cells transfected with siCtrl, or siDHX9 for 48 h. Bottom left, bar graph generated by quantifying the Western blot. Data are means ± SD, n = 3. Two-sided t-test. Right, as in f, relative amount of RNA/DNA hybrids in U2OS 2-6-3/TA cells transfected with siDHX9. Mean ± SE, n = 3. Two-sided t-test. Source data are provided as a Source Data file.
Fig. 5
Fig. 5. TUG1 resolves (CA)n/(TG)n containing R-loops.
a Scatter plots comparing the mean log2 concentration of DRIP-seq signals. HeLa/Fucci2 cells transfected with Ctrl ASO or TUG1#1 for 4 h were treated with or without 10 μM CPT for the last 2 h. TUG1#1-treated cells (left) and CPT-treated cells (right) against control samples. Peaks with false discovery rate (FDR) < 0.1 are colored magenta, and the number above and below the diagonal line represents up- and down-regulated peaks after the treatment, respectively. DRIP-seq signals were normalized based on library size. b Venn diagram showing the overlap between TUG1-sensitive and CPT-sensitive peaks. c Metaplot of mean input-subtracted DRIP-seq signals in 4 kb window around the TUG1-sensitive (left) and CPT-sensitive (right) peak centers. d A snapshot of representative locus of DRIP-seq peaks enhanced by TUG1 KD in chr22:49,973,028-49,975,721 (C22orf34). (CA)n repeat-containing sequence is indicated below with CA dinucleotide colored gray. e Metaplot of γ-H2AX accumulation in 4 kb window around the TUG1-sensitive (red) and CPT-sensitive (green) peak centers. f Genomic annotation of peaks differentially altered by TUG1 KD or CPT treatment, defined by homer. Percentages of repeat types (>1%) are detailed in the plot. g Simple repeat enrichment analysis in TUG1-sensitive (left) or CPT-sensitive (right) peaks. The x axis shows the fraction of TUG1- or CPT-sensitive peaks overlapping with the indicated repeat types and sequences in RepeatMasker. The y-axis shows negative log10 P-values of enrichment or depletion of indicated repeat types and sequences above background. P-values were estimated by comparison with GC%-matched background regions for TUG1- or CPT-sensitive peaks using two-sided Fisher’s exact-test and adjusted using the Benjamini–Hochberg method.
Fig. 6
Fig. 6. TUG1 depletion results in marked DNA damage and apoptosis.
a Left, Western blot showing the level of γ-H2AX in cells transfected with TUG1#1 for the indicated time. Right, the relative intensities of γ-H2AX normalized by H2AX. Mean ± SD. n = 3. Two-sided t-test. b Top, representative FCM profiles of HeLa/Fucci2 cells after 24 h of TUG1 KD. Percentage of γ-H2AX-positive cells (gated cells) are indicated. 2 C and 4 C indicate non-replicated and replicated genomes, respectively. Bottom, Percentage of γ-H2AX-positive cells after 24 h of TUG1 KD in five cell lines. Mean ± SD. n = 3. Two-sided t-test. c Detection of DSBs by a neutral comet assay. Left, representative images of comet tails in Ctrl ASO or TUG1#1 transfected cells. Right, quantification of Olivetail moment. 100 cells per group were examined. One-way ANOVA. The experiments were carried out in duplicate with similar results. d Cell growth after transfection with Ctrl ASO, TUG1#1 or TUG1#2 for the indicated times. Mean ± SD. n = 3. One-way ANOVA and Tukey’s multiple comparison tests. e Top, Annexin V/propidium iodide (PI) staining of HeLa and U2OS cells transfected with Ctrl ASO, TUG1#1 or TUG1#2 for 48 h. Annexin V-positive (apoptotic) cells are gated. Bottom, percentages of Annexin V-positive cells. Mean ± SD. n = 3. Two-sided t-test. f Top left, representative FCM profiles of TIG3 normal fibroblast cells after 24 h of TUG1 KD or treatment of HU for 24 h. Percentage of γ-H2AX-positive cells (gated cells) are indicated. Top right, bar graph shows the percentage of γ-H2AX-positive cells after 24 h of TUG1 KD in TIG3 cells. Mean ± SD. n = 3. Two-sided t-test. Bottom left, Annexin V/PI staining of TIG3 cells transfected with Ctrl ASO, TUG1#1 or TUG1#2 for 48 h. Annexin V-positive (apoptotic) cells are gated. Bottom right, bar graph shows the percentages of Annexin V-positive cells. Mean ± SD. n = 3. Two-sided t-test. g Cell growth of TIG3 after transfection with Ctrl ASO, TUG1#1 or TUG1#2 for the indicated times. Mean ± SD. n = 3. One-way ANOVA. Source data are provided as a Source Data file.
Fig. 7
Fig. 7. Combination therapy with antiTUG1-DDS and TMZ suppresses tumor growth in a glioblastoma xenograft mouse model.
a Top, RNA/DNA hybrid slot blot with S9.6 antibody. LN229 cells were transfected with Ctrl ASO, TUG1#1 or TUG1#2 for 4 h, or TMZ for 1.5 h at the indicated concentrations. DNA stained by SYBR gold is shown as a loading control. Bottom, bar graphs indicate quantification of S9.6 signals. Values are normalized to control and represent the mean ± SD, n = 3. Two-sided t-test. b Left, Annexin V/ propidium iodide (PI) staining of LN229 cells transfected with Ctrl ASO, TUG1#1 or TUG1#2 in combination with TMZ for 4 days. Annexin V-positive (apoptotic) cells are gated. Right, bar graph shows the percentages of Annexin V-positive cells. Mean ± SD. n = 3. Two-sided t-test. c Schematic diagram showing the treatment protocol for xenograft mouse models of LN229. d Representative HE-stained brain sections. Arrow shows the location of the puncture site. Boxed regions in the left panels are magnified in the right panels. Black and white scale bars are 10 mm and 10 μm, respectively. e Tumor volumes at 35 days after transplantation. CTRL-DDS (n = 11), antiTUG1-DDS (n = 13), TMZ (n = 15), antiTUG1-DDS + TMZ (n = 19). Mean ± SE. Two-sided t-test. f Kaplan–Meier survival curves of mice treated as indicated. Statistical analysis was performed using the Log-rank test. *P = 0.0185 antiTUG1-DDS compared to CTRL-DDS, **P = 0.0045 TMZ compared to antiTUG1-DDS, ***P = < 0.0001 antiTUG1-DDS + TMZ compared to CTRL-DDS, P < 0.001 antiTUG1-DDS + TMZ compared to antiTUG1-DDS, P < 0.001 antiTUG1-DDS + TMZ compared to TMZ. g Representative smFISH image of TUG1 in CTRL-DDS and antiTUG1-DDS-treated tumors. Nuclei are stained with DAPI. Scale bars = 10 μm. h DRIP-qPCR of TUG1-sensitive loci in genomic DNA derived from human tumor xenografts after 1 week of treatment. Data are mean ± SD, n = 3. Two-sided t-test. Source data are provided as a Source Data file.

References

    1. Gaillard H, Garcia-Muse T, Aguilera A. Replication stress and cancer. Nat. Rev. Cancer. 2015;15:276–289. doi: 10.1038/nrc3916. - DOI - PubMed
    1. Kotsantis P, Petermann E, Boulton SJ. Mechanisms of oncogene-induced replication stress: jigsaw falling into place. Cancer Discov. 2018;8:537–555. doi: 10.1158/2159-8290.CD-17-1461. - DOI - PMC - PubMed
    1. Aguilera A, Garcia-Muse T. R loops: from transcription byproducts to threats to genome stability. Mol. Cell. 2012;46:115–124. doi: 10.1016/j.molcel.2012.04.009. - DOI - PubMed
    1. Garcia-Muse T, Aguilera A. Transcription-replication conflicts: how they occur and how they are resolved. Nat. Rev. Mol. Cell Biol. 2016;17:553–563. doi: 10.1038/nrm.2016.88. - DOI - PubMed
    1. Garcia-Muse T, Aguilera A. R loops: from physiological to pathological roles. Cell. 2019;179:604–618. doi: 10.1016/j.cell.2019.08.055. - DOI - PubMed

Publication types