. 2023 Aug 22;14(1):4944.
doi: 10.1038/s41467-023-40606-1.

Demethylase-independent roles of LSD1 in regulating enhancers and cell fate transition

Affiliations

Demethylase-independent roles of LSD1 in regulating enhancers and cell fate transition

Cheng Zeng et al. Nat Commun. .

Abstract

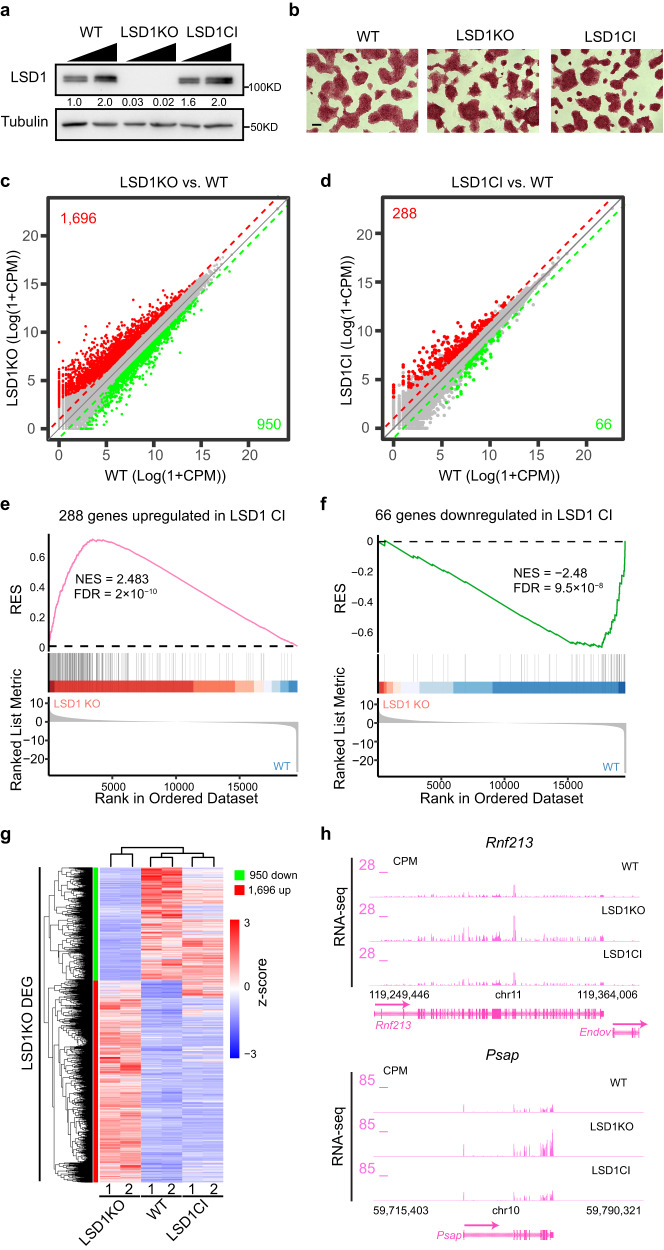
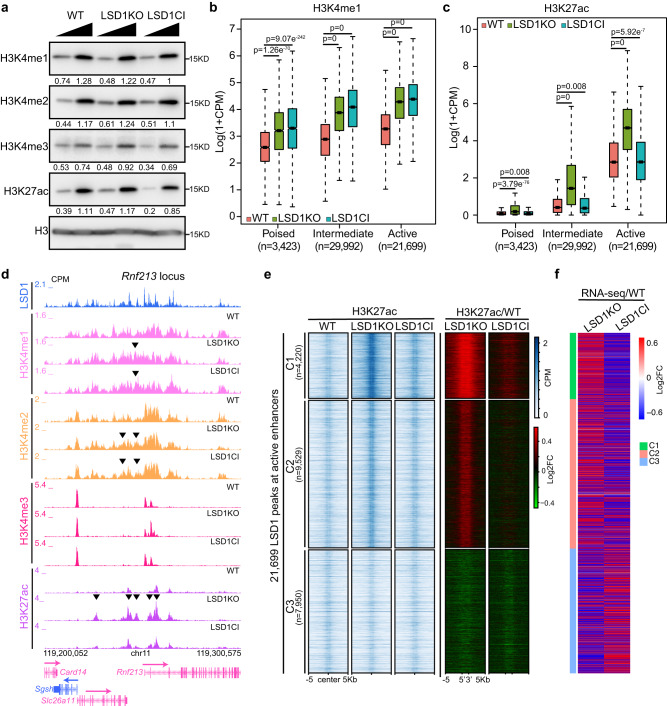
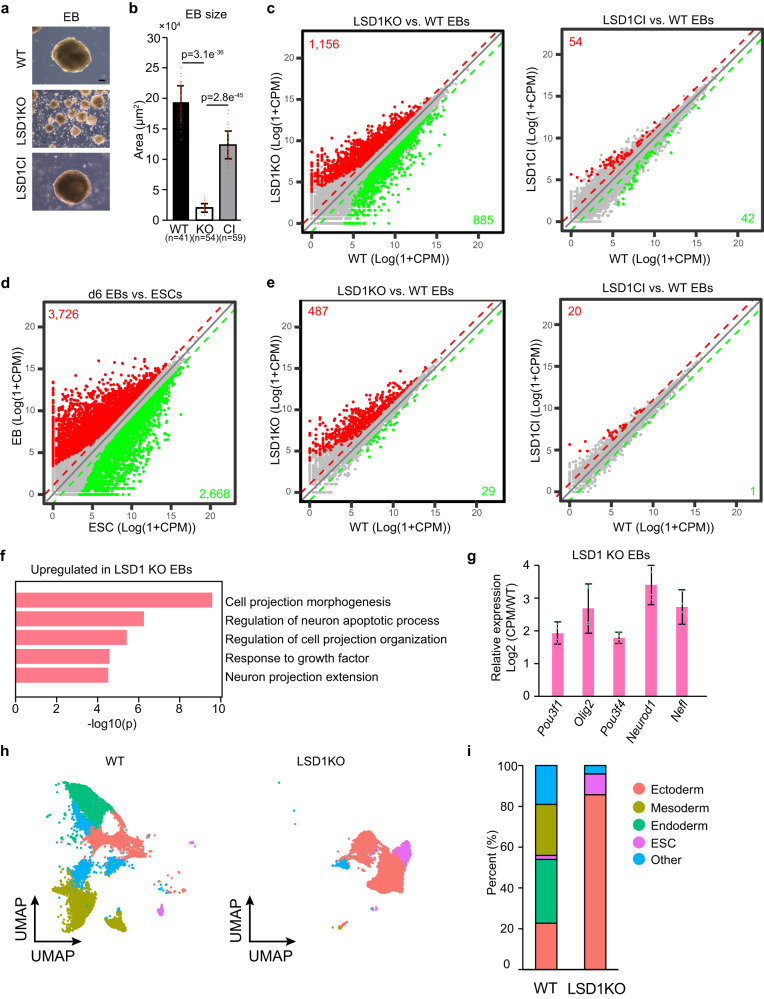
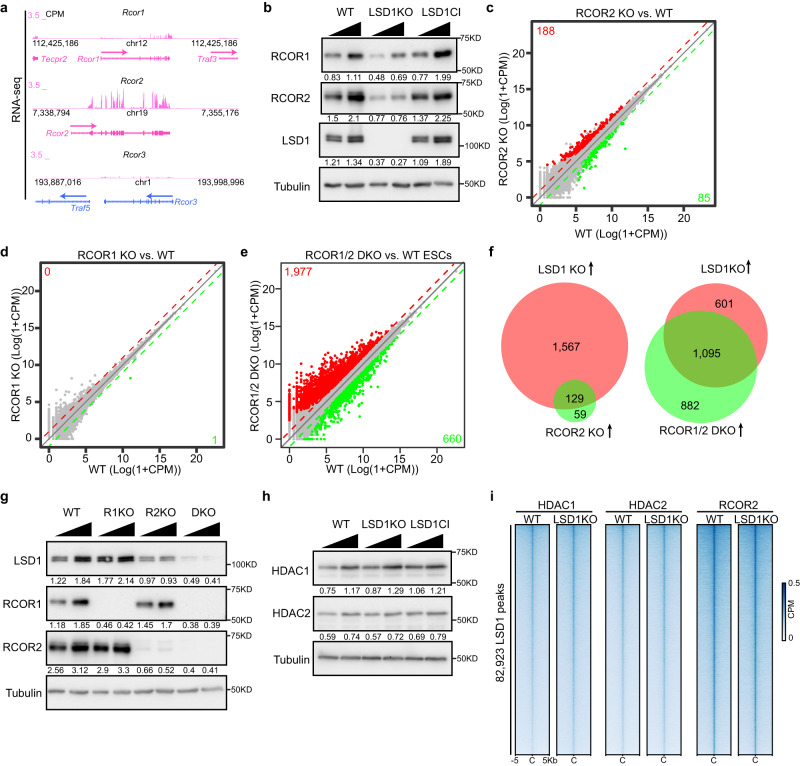
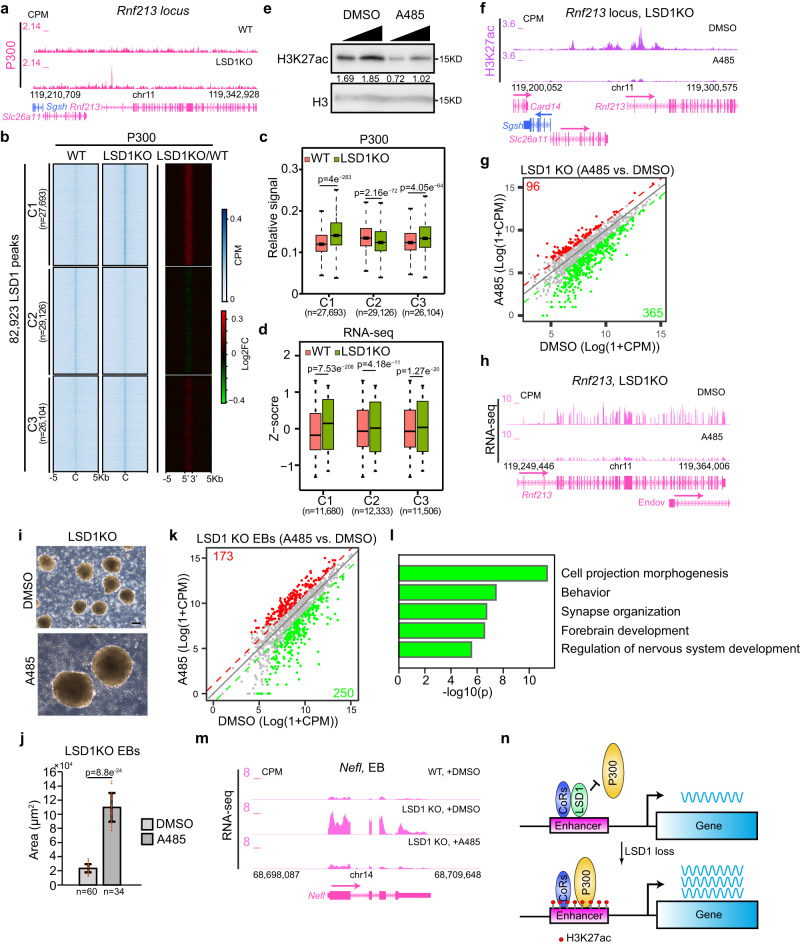
The major enhancer regulator lysine-specific histone demethylase 1A (LSD1) is required for mammalian embryogenesis and is implicated in human congenital diseases and multiple types of cancer; however, the underlying mechanisms remain enigmatic. Here, we dissect the role of LSD1 and its demethylase activity in gene regulation and cell fate transition. Surprisingly, the catalytic inactivation of LSD1 has a mild impact on gene expression and cellular differentiation whereas the loss of LSD1 protein de-represses enhancers globally and impairs cell fate transition. LSD1 deletion increases H3K27ac levels and P300 occupancy at LSD1-targeted enhancers. The gain of H3K27ac catalyzed by P300/CBP, not the loss of CoREST complex components from chromatin, contributes to the transcription de-repression of LSD1 targets and differentiation defects caused by LSD1 loss. Together, our study demonstrates a demethylase-independent role of LSD1 in regulating enhancers and cell fate transition, providing insight into treating diseases driven by LSD1 mutations and misregulation.


Conflict of interest statement

The authors declare no competing interests.

Figures

Fig. 1
Fig. 1. Catalytic-independent roles of LSD1 in gene regulation.
a Western blotting indicating LSD1 levels in WT, LSD1 KO, and LSD1 CI ESCs. 15 and 30 μg proteins from total cell lysates were loaded for each sample. LSD1 levels in each lane were quantified by normalizing with Tubulin signals of the corresponding lane. Normalized ratios were provided under the LSD1 blot. This experiment was repeated three times independently with similar results observed. Source data are provided as a Source data file. b Alkaline phosphatase staining of WT, LSD1 KO, and LSD1 CI cells. This experiment was repeated three times independently with similar results observed. Scale bar: 100 μm. c, d Correlation plots of RNA-seq data between LSD1 KO (c) or LSD1 CI (d) cells and WT cells. RNA-seq experiments were performed with two biological replicates from WT ESCs and two independent mutant cell clones. Statistical significance was determined by two-sided Wald test and p-values were corrected for multiple testing using the Benjamini–Hochberg method. Significantly upregulated genes (log2 fold change >1, adjusted p < 0.01) were highlighted in red while downregulated genes (log2 fold change <−1, adjusted p < 0.01) were highlighted in green. The number of up- and downregulated genes are listed on the plots. e, f GSEA analysis of genes upregulated (e) and downregulated (f) in LSD1 CI ESCs comparing LSD1 KO and WT ESCs. RES: running enrichment score; NES: normalized enrichment score; FDR: false discovery rate. g Hierarchical clustering analysis of expression levels of the 2646 differentially regulated genes in LSD1 KO cells comparing WT, LSD1 KO, and LSD1 CI ESCs. Z-scores were used to generate the heatmap. Numbers below the heatmap denote the 2 biological replicates of each genotype. h Genome browser view of RNA-seq signals at representative LSD1 target genes in WT and LSD1 mutant ESCs. CPM: counts per million mapped reads.
Fig. 2
Fig. 2. LSD1 deletion rather than catalytic inactivation leads to enhancer de-repression.
a Western blotting of H3K4me1/2/3 and H3K27ac in WT, LSD1 KO, and LSD1 CI cells. Levels of histone modifications in each lane were quantified by normalizing with H3 signals of the corresponding lane. Normalized ratios were provided under each histone modification blot. This experiment was repeated three times independently with similar results observed. Source data are provided as a Source data file. b, c Box plots of H3K4me1 (b) and H3K27ac (c) levels at LSD1-bound enhancers in WT, LSD1 KO, and LSD1 CI cells. 3423 poised, 29,992 intermediate, and 21,699 active enhancers were called based on H3K4me1, H3K27ac, H3K27me3, and LSD1 ChIP-Rx data. n = 2 biologically independent experiments. P-values (p) from two-sided Wilcoxon signed-rank tests on log2(LSD1KO/WT) and log2(LSD1CI/WT) are denoted in each panel. Center line: median; top and bottom hinges of box: the third and first quantiles; whiskers: quartiles ± 1.5 × interquartile range. d Genome browser view of H3K4me1/2/3 and H3K27ac ChIP-Rx signals at the Rnf213 locus in WT, LSD1 KO, and LSD1 CI ESCs. Black arrows indicate changes between LSD1 mutant and WT cells. e Heat maps showing H3K27ac ChIP-Rx levels at LSD1-enriched active enhancers in WT, LSD1 KO, and LSD1 CI ESCs. Log2 fold change between LSD1 mutant and WT cells are shown on the right. Clusters were generated by k-means clustering, and signals 5 kb up- and downstream of LSD1 peak regions were included. The number of peaks under each cluster was labeled in parentheses. f Heat maps showing the log2 fold change of RNA-seq signals between LSD1 mutant and WT ESCs. The nearest genes to each LSD1 enriched active enhancer were used to generate the heat map. Clusters are the same as in (e).
Fig. 3
Fig. 3. Catalytic-independent roles of LSD1 in cellular differentiation.
a Phase-contrast images of day 6 EBs generated from WT, LSD1 KO, and LSD1 CI ESCs. Scale bar: 100 μm. Experiments were repeated three times independently with similar results observed. b Quantification of EB sizes in (a). Data are presented as mean values ± standard deviation (SD). n = 3 biologically independent experiments. P-values were calculated using two-sided student’s t-test. Source data are provided as a Source data file. c Correlation plots of RNA-seq data between LSD1 KO (left) or CI (right) and WT day 6 EBs. Data are derived from two biological replicates from two cell clones. Statistical significance was determined by two-sided Wald test and p-values were corrected for multiple testing using the Benjamini–Hochberg method. Significantly up- and downregulated genes are labeled in red and green with numbers of genes noted, respectively. d Correlation plots of RNA-seq data between day 6 EBs and ESCs. Data are derived from two biological replicates. Statistical significance was determined by two-sided Wald test and p-values were corrected for multiple testing using the Benjamini–Hochberg method. e Correlation plots of RNA-seq data as in (c) with downregulated genes in day 6 EBs vs. ESCs (2668 green genes in d) shown. Data are derived from two biological replicates. Statistical significance was determined by two-sided Wald test and p-values were corrected for multiple testing using the Benjamini–Hochberg method. Significantly up- and downregulated genes are labeled in red and green with numbers of genes noted, respectively. f Gene ontology (GO) analysis of genes upregulated in LSD1 KO day 6 EBs. Top 5 GO terms are shown. g Fold change of RNA-seq signals (CPM) in LSD1 KO over WT EBs is shown for neural marker genes. Data are presented as mean values ± SD. n = 2 biologically independent experiments. Source data are provided as a Source data file. h scRNA-seq gene expression projected onto a UMAP space for day 6 WT and LSD1 KO EBs. Inferred cell types based on marker genes were highlighted. Data were derived from two biological replicates. i Quantification of cell types in day 6 WT and LSD1 KO EBs based on scRNA-seq data.
Fig. 4
Fig. 4. Interdependency of LSD1 and RCORs in regulating gene expression.
a Genome browser view of RNA-seq signals at Rcor1, Rcor2, and Rcor3 genes in ESCs. (b) Western blotting indicating the level of RCOR1, RCOR2, LSD1, and Tubulin in WT, LSD1KO, and LSD1CI ESCs. Levels of RCORs and LSD1 in each lane were quantified by normalizing with Tubulin signals of the corresponding lane. Normalized ratios were provided under each blot. Experiments were repeated three times independently with similar results observed. Source data are provided as a Source data file. ce Correlation plot of RNA-seq data between RCOR2 KO (c), RCOR1 KO (d), RCOR1/2 DKO (e) and WT ESCs. Data are derived from two biological replicates. Statistical significance was determined by two-sided Wald test and p-values were corrected for multiple testing using the Benjamini-Hochberg method. Significantly up- and downregulated genes are labeled in red and green with numbers of genes noted, respectively. f Venn diagrams showing the overlap of upregulated genes between LSD1 KO and RCOR2 KO (left) or RCOR1/2 DKO (right) ESCs. g Western blotting of LSD1, RCOR1, RCOR2, and Tubulin in WT and RCOR1/2 mutant cells. R1KO: RCOR1 KO; R2KO: RCOR2 KO; DKO: RCOR1/2 DKO. Levels of LSD1 and RCORs in each lane were quantified by normalizing with Tubulin signals of the corresponding lane. Normalized ratios were provided under each blot. Experiments were repeated three times independently with similar results observed. Source data are provided as a Source data file. h Western blotting of HDAC1, HDAC2, and Tubulin in WT, LSD1 KO, and LSD1 CI ESCs. Levels of HDAC1 and HDAC2 in each lane were quantified by normalizing with Tubulin signals of the corresponding lane. Normalized ratios were provided under each blot. Experiments were repeated three times independently with similar results observed. Source data are provided as a Source data file. i Heat maps showing the ChIP-Rx levels of HDAC1, HDAC2, and RCOR2 at LSD1 enriched regions in WT and LSD1 KO ESCs.
Fig. 5
Fig. 5. P300/CBP contribute to the gene misregulation and defective differentiation caused by LSD1 loss.
a Genome browser view of P300 ChIP-Rx signals at Rnf213 locus in WT and LSD1 KO ESCs. b Heatmaps showing P300 ChIP-Rx levels at LSD1 enriched regions in WT and LSD1 KO ESCs. Three clusters were generated by k-means clustering. c Box plots indicating the signals of P300 ChIP-Rx in WT and LSD1 KO cells at LSD1 peaks in the three clusters in (b). n = 2 biologically independent experiments. d Box plots of RNA-seq signals of nearest genes to LSD1 peaks in WT and LSD1 KO cells in the three clusters in (b). P-values in (c) and (d) were calculated using two-sided Wilcoxon signed-rank tests. Center line: median; top and bottom hinges of box: the third and first quantiles; whiskers: quartiles ± 1.5 × interquartile range. e Western blotting of H3K27ac in ESCs treated with DMSO or 10 μM A485 for 24 h. Experiments were repeated three times independently with similar results observed. Source data are provided as a Source data file. f Genome browser view of H3K27ac ChIP-Rx signals at Rnf213 locus in LSD1 KO ESCs treated with DMSO or 10 μM A485 for 24 h. g Correlation analysis of upregulated genes upon LSD1 deletion (1696 red genes in Fig. 1c) in A485 vs. DMSO treated LSD1 null cells. h Genome browser view of RNA-seq signals of Rnf213 gene in LSD1 KO cells treated with DMSO or 10 μM A485 for 24 h. i Phase-contrast images of day 6 EBs generated from LSD1KO ESCs treated with DMSO or 0.4 μM A485. Experiments were repeated three times independently with similar results observed. Scale bar: 100 μm. j Quantification of EB sizes in (i). Data are presented as mean values ± SD. n = 3 biologically independent experiments. P-values were calculated using two-sided student’s t-test. Source data are provided as a Source data file. k Correlation analysis of upregulated genes in LSD1 null EBs (1156 red genes in Fig. 3c) treated with respective 0.4 μM A485 and DMSO. l GO analysis of 250 genes upregulated in LSD1 KO EBs but downregulated by A485 treatment (green genes in k). m Genome browser view of Nefl RNA-seq signals in WT and LSD1 KO day 6 EBs treated with DMSO or A485. n A working model for the regulation of enhancers by LSD1. P300 occupancy increases at LSD1-targeted enhancers upon LSD1 loss, acetylating nucleosomes at enhancers previously decommissioned by LSD1 and activating gene expression.

References

    1. Ng SB, et al. Exome sequencing identifies MLL2 mutations as a cause of Kabuki syndrome. Nat. Genet. 2010;42:790–793. doi: 10.1038/ng.646. - DOI - PMC - PubMed
    1. Krantz ID, et al. Cornelia de Lange syndrome is caused by mutations in NIPBL, the human homolog of Drosophila melanogaster Nipped-B. Nat. Genet. 2004;36:631–635. doi: 10.1038/ng1364. - DOI - PMC - PubMed
    1. Petrij F, et al. Rubinstein-Taybi syndrome caused by mutations in the transcriptional co-activator CBP. Nature. 1995;376:348–351. doi: 10.1038/376348a0. - DOI - PubMed
    1. Heintzman ND, et al. Histone modifications at human enhancers reflect global cell-type-specific gene expression. Nature. 2009;459:108–112. doi: 10.1038/nature07829. - DOI - PMC - PubMed
    1. Hu D, et al. The MLL3/MLL4 branches of the COMPASS family function as major histone H3K4 monomethylases at enhancers. Mol. Cell Biol. 2013;33:4745–4754. doi: 10.1128/MCB.01181-13. - DOI - PMC - PubMed

Publication types

Substances