. 2023 Aug 23;8(1):312.
doi: 10.1038/s41392-023-01545-x.

A20 promotes colorectal cancer immune evasion by upregulating STC1 expression to block "eat-me" signal

Affiliations

A20 promotes colorectal cancer immune evasion by upregulating STC1 expression to block "eat-me" signal

Min Luo et al. Signal Transduct Target Ther. .

Abstract

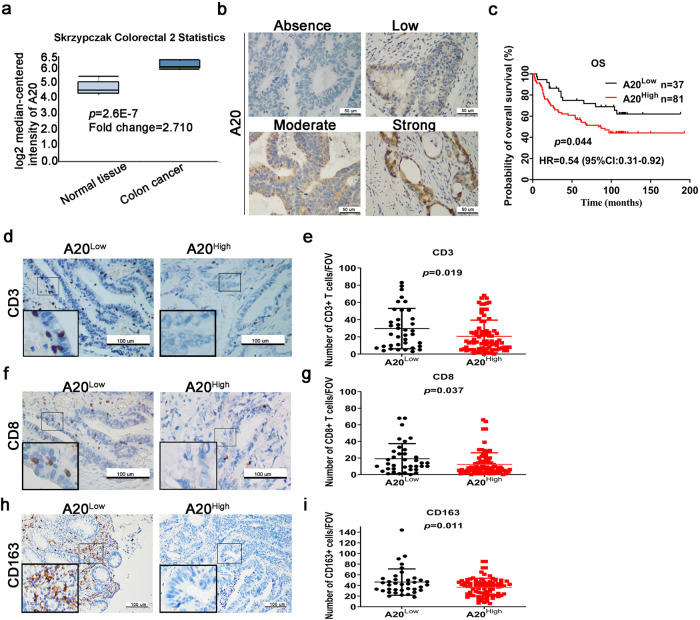
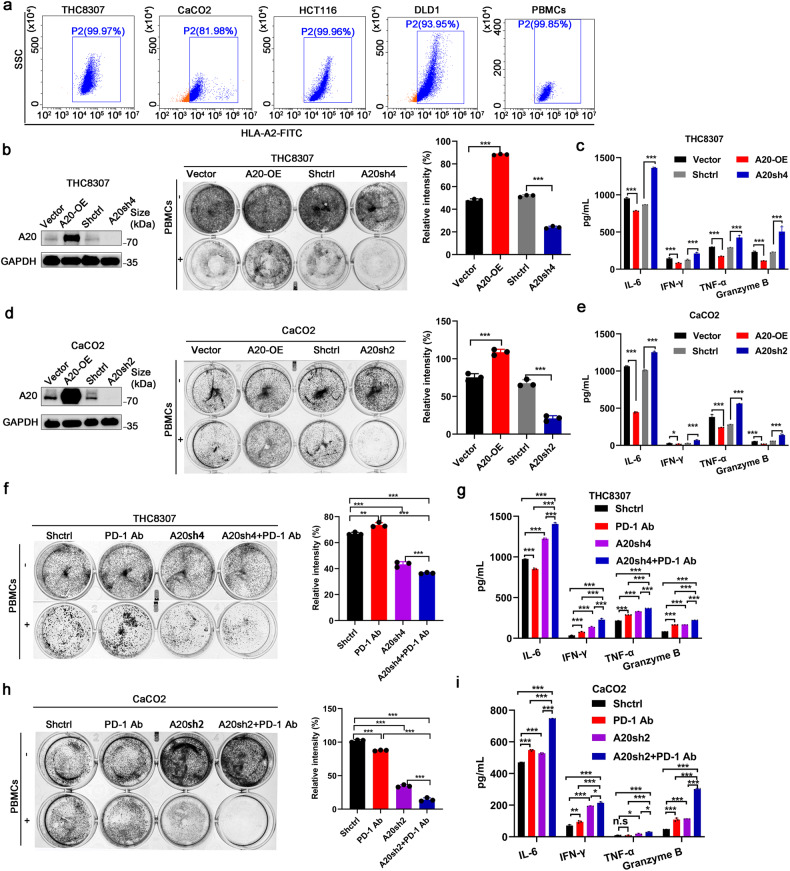
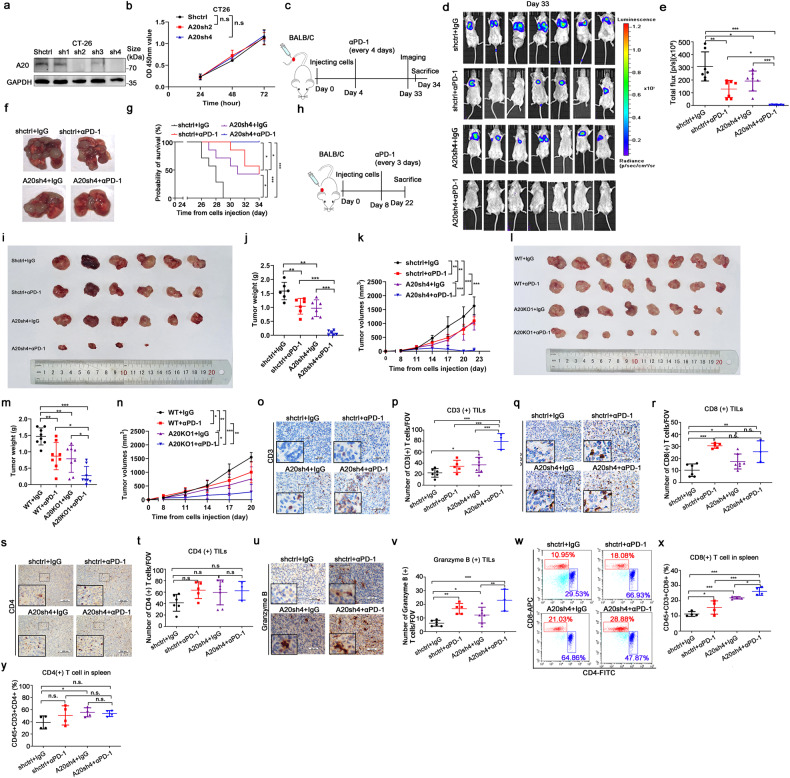
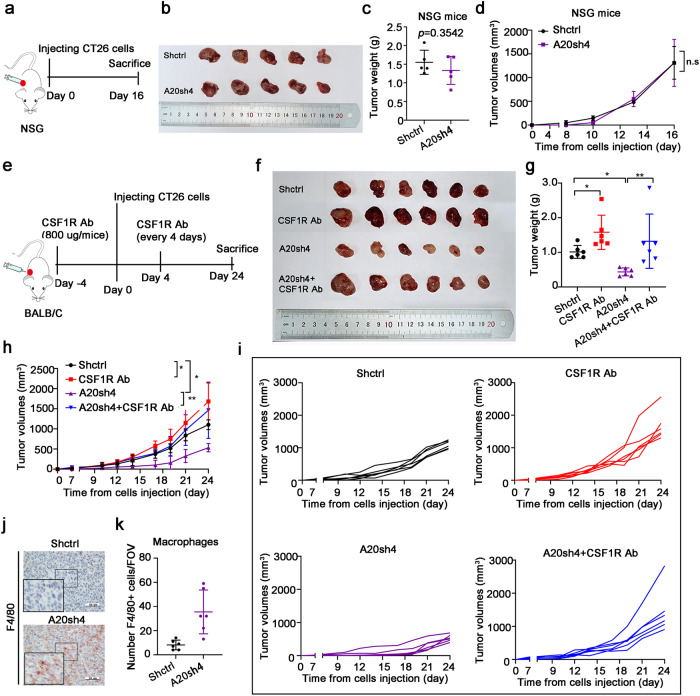
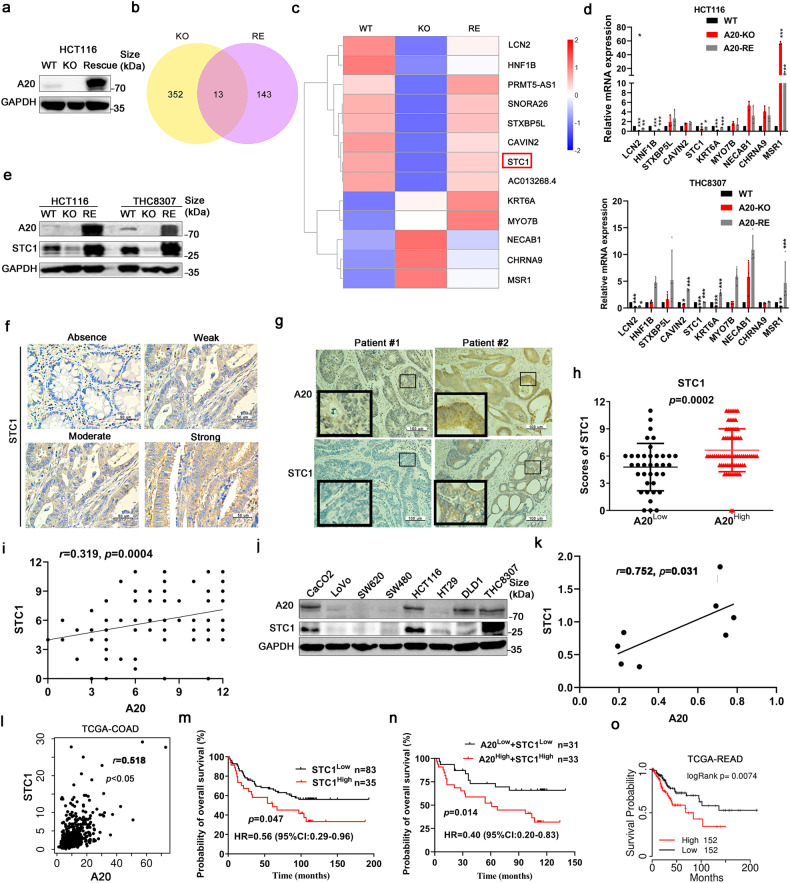
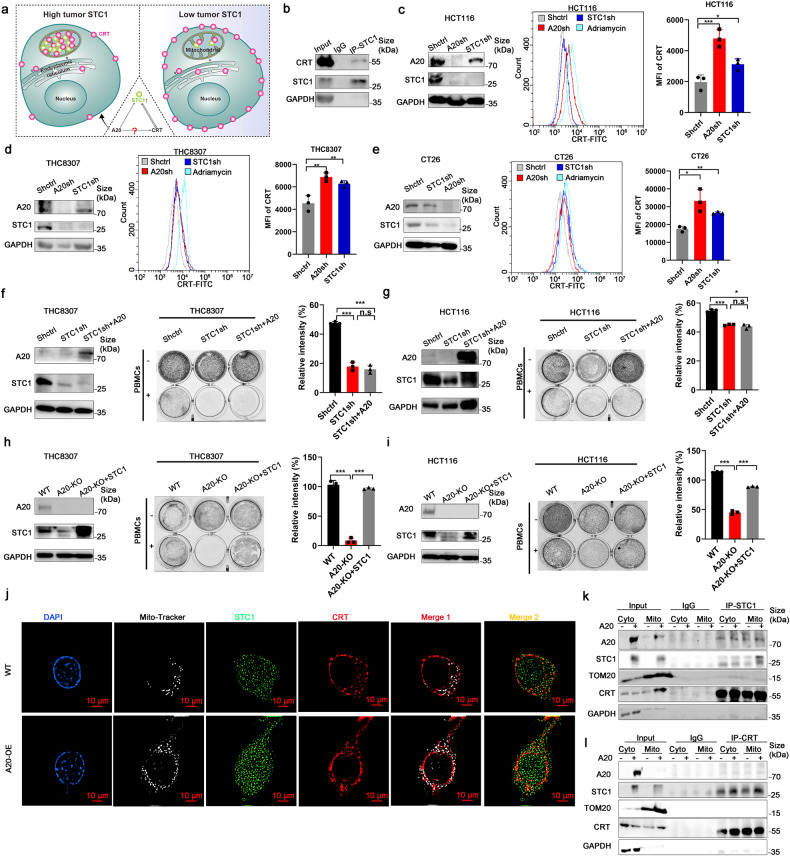
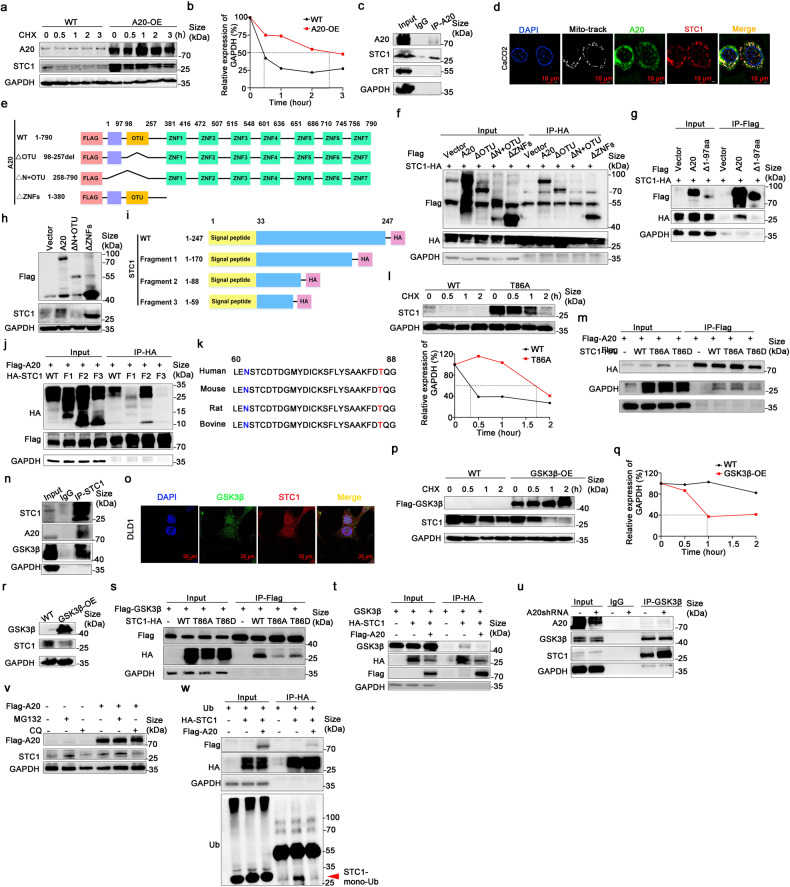
Immune checkpoint inhibitors (ICIs) have induced durable clinical responses in a subset of patients with colorectal cancer (CRC). However, the dis-satisfactory response rate and the lack of appropriate biomarkers for selecting suitable patients to be treated with ICIs pose a major challenge to current immunotherapies. Inflammation-related molecule A20 is closely related to cancer immune response, but the effect of A20 on "eat-me" signal and immunotherapy efficacy remains elusive. We found that A20 downregulation prominently improved the antitumor immune response and the efficacy of PD-1 inhibitor in CRC in vitro and in vivo. Higher A20 expression was associated with less infiltration of immune cells including CD3 (+), CD8 (+) T cells and macrophages in CRC tissues and also poorer prognosis. Gain- and loss-A20 functional studies proved that A20 could decrease the "eat-me" signal calreticulin (CRT) protein on cell membrane translocation via upregulating stanniocalcin 1 (STC1), binding to CRT and detaining in mitochondria. Mechanistically, A20 inhibited GSK3β phosphorylating STC1 at Thr86 to slow down the degradation of STC1 protein. Our findings reveal a new crosstalk between inflammatory molecule A20 and "eat-me" signal in CRC, which may represent a novel predictive biomarker for selecting CRC patients most likely to benefit from ICI therapy.


Conflict of interest statement

The authors declare no competing interests.

Figures

Fig. 1
Fig. 1
A20 expression is associated with poor immune cell infiltration. a A20 expression in normal tissue and colon tumor analyzed by Oncomine database. b The representative images of different intensity of tumorous A20 expression from human CRC tissue samples with A20 immunohistochemical staining (×200). The four representative pictures are not from CRC patient at different stage, just with different A20 intensity. c The survival analysis of 118 CRC patients. H-score ≤ 6, low; >6, high. di The representative pictures showing the extent of immune cell infiltration in tumor microenvironment in CRC specimens. The numbers of immune cells were averaged by five different fields of views and the data were presented as mean ± SD. *p < 0.05; **p < 0.01; ***p < 0.001; n.s. not significant
Fig. 2
Fig. 2
A20 inhibited anti-tumor immune response in vitro. a The flow cytometry analysis of HLA-A2. b The lymphocytoxicity effect of PBMCs on THC8307 cells when A20 expression was manipulated by overexpression (OE) or short hairpin silencing (sh). c The ELISA analysis of T cell activation-related cytokines from the co-culture medium of THC8307 cells and PBMCs, n = 3. d, e The effect of A20 expression on lymphocytoxicity and cytokine release from the co-culture medium of CaCO2 cells and PBMCs, n = 3. fi The effect of PD-1 inhibitor on lymphocytoxicity and cytokine release from the co-culture medium of A20-knockdown CRC cells and PBMCs, n = 3. All experiments were performed in triplicate. Data was represented as the mean ± SD. *p < 0.05; **p < 0.01; ***p < 0.001; n.s not significant
Fig. 3
Fig. 3
A20 inhibited antitumor immune response in vivo. a The expression of A20 in mice CT26-luc-GFP cells. b The cell proliferation of CT26-luc-GFP cells detected by CCK8 kit, n = 4. c The experimental scheme of the animal study. d The in vivo images of mice tumors with different treatments were detected by the IVIS bioluminescence imaging system, n = 7. e Statistical analysis of total flux from the IVIS bioluminescence images. f The representative images of the metastatic nodes in lung from BALB/C mice. g The survival curve of mice, n = 7. h The experimental scheme of the animal study. i The images of tumors excised from BALB/C mice at the end of experiments, n = 6. j Tumor weights of the four treatment groups, n = 6. k Tumor growth curves of the four treatment groups, n = 6. l The images of tumors excised from BALB/C mice at the end of experiments, n = 8. m Tumor weights of the four treatment groups, n = 8. n Tumor growth curves of the four treatment groups, n = 8. ov The infiltration of CD3 (+) (X400), CD8 (+) (X400), CD4 (+) (X200), and Granzyme B(+) (X400) T cells detected by immunohistochemical staining. p-value was calculated by one-way ANOVA analysis. Shctrl+IgG, n = 7, Shctrl+αPD-1, n = 5, A20sh4+IgG, n = 7, A20sh4+αPD-1, n = 3. wy Flow cytometry analysis of CD8 (+) and CD4 ( + ) T cells of mice spleens (n = 4 per group). Data was represented as the mean ± SD. *p < 0.05; **p < 0.01; ***p < 0.001; n.s. not significant
Fig. 4
Fig. 4
A20 impaired the phagocytosis function of macrophages to mediate tumor immune evasion. a The experimental scheme of the animal study. b The images of tumors excised from NSG mice at the end of experiments. c Tumor weights of the two treatment groups, n = 5. d Tumor growth curves of the two treatment groups, n = 5. e The experimental scheme of the animal experiment using BALB/C mice. f The images of tumors excised from BALB/C mice at the end of experiments. g Tumor weights of different groups, n = 6. h, i Tumor growth curves, n = 6. j, k The infiltration of macrophages (F4/80+) in mice tumor tissues (X400), n = 6
Fig. 5
Fig. 5
A20 regulated STC1 expression. a A20 expression level in A20-knockout (KO) and A20-KO-rescue (RE) cells. RNA-sequencing was conducted to investigate the gene profiles from HCT116 cells after manipulation of A20 expression (WT: wild type; KO: A20-knockout; RE: A20-rescue). b The Venn diagram of the genes altered by A20 with the p-value < 0.05. c Heat map of 13 genes (n = 3 samples of each group). Blue, downregulation; red, upregulation. d The expression of 10 genes were detected by q-PCR, n = 4. e The expression of STC detected by immunoblotting. f Representative immunohistochemical staining images of different intensity of STC1 expression in tumor specimens. g Representative images of STC1 and A20 staining in tumor specimens from CRC patients. h Statistical analysis of STC1 expression in CRC tissues with high or low A20 expression, n = 118. i Correlation analysis of STC1 and A20 expression in CRC tissues, n = 118. j Immunoblotting analysis of A20 and STC1 expression in CRC cell lines (n = 8). k, l Correlation analysis of A20 and STC1 expression in CRC cell lines and TCGA database. m, n Survival analysis of CRC patients (H-score≤6, low; >6, high). o Survival analysis of CRC patients in TCGA dataset
Fig. 6
Fig. 6
A20 inhibited antitumor immune response via STC1/ CRT signaling pathway. a Working model showing the crosstalk between A20 and CRT in CRC cells. b Co-immunoprecipitation analysis of STC1 and CRT. ce The effect of STC1 or A20 downregulation on the translocation of CRT to cell membrane detected by flow cytometry. Adriamycin was used as a positive control. f, g The lymphocytoxity to THC8307 or HCT116 cells with A20 overexpression but STC1 downregulation, n = 3. h, i Co-culture experiment of PBMCs and A20-KO THC8307 or HCT116 cells rescued with STC1 overexpression, n = 3. Data was presented as the mean ± SD. *p < 0.05; **p < 0.01; ***p < 0.001; ****; p < 0.0001; n.s, not significant. j CaCO2 cells transfected with A20 overexpression vector were detected by immunofluorescence assay to show the interactions of CRT (red) and STC1 (green), co-localization with MitoTracker (white) (×1000). k, l The interactions of STC1 and CRT protein in cytoplasm and mitochondria of CaCO2 cells with A20 overexpression
Fig. 7
Fig. 7
A20 upregulated STC1 by inhibiting STC1 degradation. a, b Degradation of STC1 protein over time in cells with or without A20 overexpression (OE). Cycloheximide was used at 20 μM. c The interaction between A20 and STC1 detected by Co-IP. d The co-localization of STC1 (green) and A20 (red) (×1000) detected by immunofluorescence assay. Blue dye, DAPI indicates the nucleus, MitoTracker (white). e Schematic diagram of A20 domains in the various constructs. f, g The interaction between STC1 and A20 with different domain-deletions. h The effect of A20 with different domain-deletions on STC1 expression. i Schematic diagram showing 4 STC1 expression vectors with different C-terminal deletions. j The interaction between A20 and STC1 (having different C-terminal deletions). k The amino acid sequence of STC1 from 60 to 88aa among different species. l Degradation profile of wild-type STC1 protein and STC1 with T86A mutant (0, 0.5, 1, and 2 h). m The effect of STC1 T86A or T86D mutant on its binding to A20. n The interaction between STC1 and GSK3β. o The co-localization of GSK3β (green) and STC1 (red) (×630) detected by immunofluorescence assay. Blue dye, DAPI indicates the nucleus. pr The effect of GSK3β on STC1 protein degradation and expression. s The effect of STC1 T86A or T86D mutant on the binding to GSK3β. t, u The effect of A20 on the interaction between STC1 and GSK3β. v The effect of MG132 (20 μM) and chloroquine (40 μM) on STC1 expression. w The effect of A20 on ubquitination of STC1 protein in 293T cells. Whole cell lysates were harvested after incubation with MG132 (30 μM for 12 h)

Similar articles

Cited by

References

    1. Siegel RL, Miller KD, Jemal A. Cancer Statistics, 2017. CA Cancer J. Clin. 2017;67:7–30. doi: 10.3322/caac.21387. - DOI - PubMed
    1. Sharma P, Allison JP. The future of immune checkpoint therapy. Science. 2015;348:56–61. doi: 10.1126/science.aaa8172. - DOI - PubMed
    1. Zappasodi R, Merghoub T, Wolchok JD. Emerging concepts for immune checkpoint blockade-based combination therapies. Cancer Cell. 2018;33:581–598. doi: 10.1016/j.ccell.2018.03.005. - DOI - PMC - PubMed
    1. Alexander PG, McMillan DC, Park JH. The local inflammatory response in colorectal cancer - Type, location or density? A systematic review and meta-analysis. Cancer Treat. Rev. 2020;83:1–28. doi: 10.1016/j.ctrv.2019.101949. - DOI - PubMed
    1. O’Donnell JS, Teng MWL, Smyth MJ. Cancer immunoediting and resistance to T cell-based immunotherapy. Nat. Rev. Clin. Oncol. 2019;16:151–167. doi: 10.1038/s41571-018-0142-8. - DOI - PubMed

Publication types