. 2023 Aug 22;6(1):866.
doi: 10.1038/s42003-023-05216-z.

Induction of open-form bile canaliculus formation by hepatocytes for evaluation of biliary drug excretion

Affiliations

Induction of open-form bile canaliculus formation by hepatocytes for evaluation of biliary drug excretion

Hiroshi Arakawa et al. Commun Biol. .

Abstract

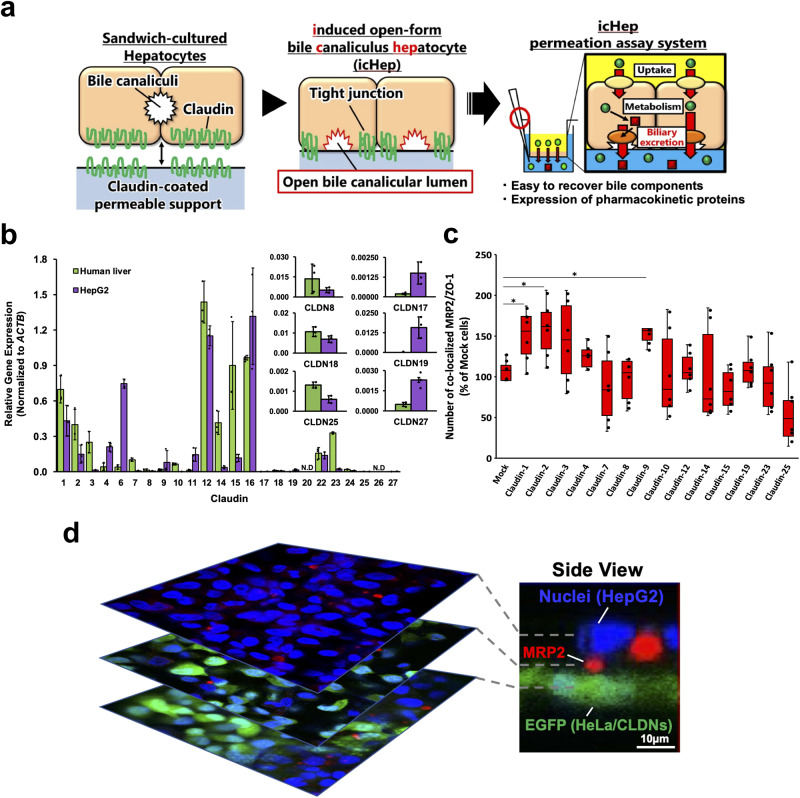
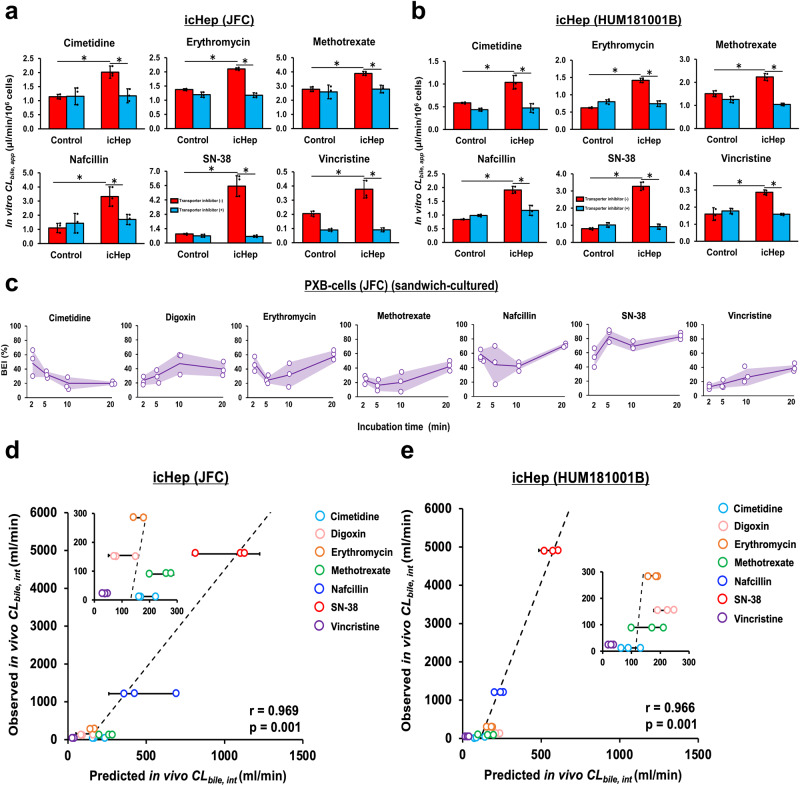
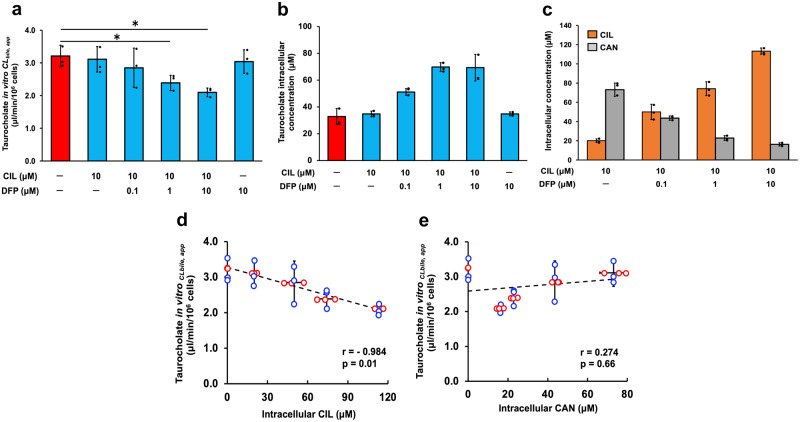
Biliary excretion is a major drug elimination pathway that affects their efficacy and safety. The currently available in vitro sandwich-cultured hepatocyte method is cumbersome because drugs accumulate in the closed bile canalicular lumen formed between hepatocytes and their amounts cannot be mealsured directly. This study proposes a hepatocyte culture model for the rapid evaluation of drug biliary excretion using permeation assays. When hepatocytes are cultured on a permeable support coated with the cell adhesion protein claudins, an open-form bile canalicular lumen is formed at the surface of the permeable support. Upon application to the basolateral (blood) side, drugs appear on the bile canalicular side. The biliary excretion clearance of several drugs, as estimated from the obtained permeabilities, correlates well with the reported in vivo biliary excretion clearance in humans. Thus, the established model is useful for applications in the efficient evaluation of biliary excretion during drug discovery and development.


Conflict of interest statement

The authors declare no competing interests.

Figures

Fig. 1
Fig. 1. Identification of human claudin molecules involved in the formation of bile canaliculi.
a The outline of this study is shown. Claudin molecules sufficient to form bile canaliculi were identified and adhered to a permeable support to mimic the surface of hepatocytes. By culturing hepatocytes on this support, we established a hepatocyte culture system (icHep) that formed canalicular hemi-lumens between the hepatocytes and the permeable support surface. This system can be applied to the evaluation of hepatobiliary disposition using a transcellular permeation assay. b Gene expression of the claudin family in human liver tissue and HepG2 cells. The green and purple bars show the expression levels of claudins in the human liver and HepG2 cells, respectively. The bars represent the means of the corresponding group, and the error bars represent the S.D. (n = 3 biological replicate wells). Claudin gene expression was normalized to ACTB. c Effect of claudin on the formation of bile canaliculi in HepG2 cells. MRP2 and ZO-1 colocalizations were counted as mature bile canaliculi in both HepG2 cells overexpressing human claudins and mock cells. The box plots are represented as follows: the center line of the box indicates the median, the box indicates the upper and lower quartiles, and the whiskers show the maximum and minimum values (n = 6 biological replicate wells). Statistical significance was determined using Student’s t-test; *P < 0.05. d Effect of co-culture with HeLa/CLDNs cells on the localization of the bile canaliculus marker MRP2 in HepG2 cells. Immunofluorescence staining of MRP2 (red) was observed upon co-staining for DRAQ5 (blue, nuclei), and EGFP (green, HeLa/CLDNs cells) in HepG2 cells co-cultured with HeLa/CLDNs cells. Scale bar = 10 μm.
Fig. 2
Fig. 2. Claudin regulates the formation of bile canaliculi.
a Claudin-1 coating on the culture equipment. Immunofluorescence staining was observed for human claudin-1 (green) in each coated well; (left) collagen + claudin-1, (center) claudin-1, (right) collagen. Scale bar = 1.0 mm. b Manipulation of bile canalicular localization in primary human hepatocytes cultured on claudin-coated plates. Hepatocytes were cultured on a plate coated with (upper) human claudin-1, -2, -3, and -9 and (lower) collagen alone as a control. Immunofluorescence staining of MRP2 (red) was observed upon co-staining of the cell membrane marker WGA (green) and the nuclear marker DRAQ5 (blue). The white arrow indicates the bile canaliculi opened on the side of the culture equipment. Scale bar = 10 μm. c Number of localized bile canaliculi lumen face to culture plate (%) in primary human hepatocytes cultured on control (green) and claudin-coated (red) plates, respectively (n = 4 biological replicate wells). Data are represented as the means ± S.D. Statistical significance was determined using Student’s t-test; *P < 0.05.
Fig. 3
Fig. 3. Pharmacokinetic functional evaluation of icHep.
PXB-cells were cultured on the permeable support coated with collagen and claudin-1, -2, -3, and -9. a Morphological change of icHep over time on the permeable support. Monolayer of primary human hepatocytes for 3 days culture and icHep for 1-, 3-, 8-, and 14-days culture were observed by bright field microscope. The red arrows show the cavities of the hepatocyte monolayer. Bar = 20 μm. b, c (b) Albumin secretion and (c) urea synthesis in icHep (red) and PXB-cells (blue) sandwich cultured on the collagen-coated permeable support were measured on day 3, 5, 7 and 14. The dot plots represent the means of the groups and the shaded error bars represent the S.D. (n = 4 biological replicate wells). d, e The gene expression of (d) drug transporters and (e) drug-metabolizing enzymes in icHep (red) and PXB-cells (blue) sandwich cultured on the collagen-coated permeable support cultured for 0, 3, 5, 7, and 14 days was measured via quantitative PCR. The dot plots represent the means of the groups and the shaded error bars represent the S.D. (n = 4 biological replicate wells). Gene expressions were normalized to ACTB and were shown relative to day 0. f Localization of hepatic drug transporters in icHep. Immunofluorescence staining was performed for canalicular [BSEP, MRP2, and P-gp: green)] and sinusoidal transporters (NTCP, OATP1B1, OATP1B3, and OCT1; green), and the nuclear marker DRAQ5 (blue). Scale bar = 20 μm. g Drug metabolic activity in icHep. Drug metabolic activity on day 7 in icHep (JFC: red bars, HUM181001B: green bars) and PXB-cells (JFC: blue bars) sandwich cultured on the collagen-coated permeable support. Bars show the amount of metabolite produced after exposure of cells to the substrate cocktail of each drug-metabolizing enzyme (n = 4 biological replicate wells). h Uptake activity of drugs in icHep. Drug uptake activity in icHep was investigated on day 7 using PXB-cells derived from two human liver donors (JFC and HUM181001B). Bars represent the uptake of typical substrates (1 μCi/ml) of the uptake transporters (OATP1B1: E217βG, OCT1: metformin, NTCP: taurocholate) in the absence (red bars) or presence (green bars) of their respective transporter inhibitors [OATP1B1: rifampicin (10 μM), OCT1: quinidine (100 μM), NTCP: cyclosporine A (10 μM)]. (n = 4 biological replicate wells). Data are presented as the means ± S.D. Statistical significance was determined using Student’s t-test; *P < 0.05.
Fig. 4
Fig. 4. Evaluation of drug biliary excretion using permeation assays with icHep.
a, b, Formation of tight junctions in icHep and PXB-cells. (a) The Papp values of the paracellular marker TD4 and (b) the TEER (Trans-epithelial electrical resistance) were measured in icHep (red) and PXB-cells (blue) cultured on the permeable support for 3, 5, and 8 days. The dot plots represent the means of the groups and the shaded error bars represent the S.D. (n = 3 biological replicate wells). Statistical significance compared with control PXB-cells cultured on the collagen-coated permeable support at the same time points was determined using Student’s t-test; *P < 0.05. c MRP2-mediated biliary transport of CDF in icHep. icHep were cultured for 7 days on the permeable support and the biliary export of CDF across the cells was measured from the sinusoidal side to the bile side. (Upper panel) Schematic diagram of the permeation assay of the MRP2 substrate CDF using icHep. (Lower panel) icHep were incubated with CDFDA (5 μM) on the sinusoidal side for 120 min in the absence (red) or presence (green) of the MRP2 inhibitor benzbromarone (100 μM). d Biliary transporter-mediated transport of each substrate in icHep (JFC). Briefly, icHep were cultured on a permeable support for 7 days. The biliary transport of digoxin, E217βG, and taurocholate across the cells was measured from the sinusoidal side to the bile side. icHep were incubated with (left) [3H]digoxin (1 μCi/ml), (center) [3H]E217βG (1 μCi/ml), or (right) [3H]taurocholate (1 μCi/ml) on the sinusoidal side for 120 min in the absence (red bars) or presence (green bars) of (left) the P-gp inhibitor zosuquidar (5 μM), (center) MRP2 inhibitor benzbromarone (100 μM), or (right) BSEP inhibitor chlorpromazine (30 μM), respectively. Data are presented as the means ± S.D. (n = 3 biological replicate wells). Statistical significance was determined using the Tukey-Kramer test; *P < 0.05.
Fig. 5
Fig. 5. Comparison of biliary excretion clearance between icHep in vitro in those reported in humans in vivo.
a, b The biliary transport of MRP2 and P-gp substrates across the icHep [(a) JFC, (b) HUM181001B] was measured from the sinusoidal side to the bile side. icHep were incubated with 1 μM each of a mixture of substrates (cimetidine, erythromycin, methotrexate, nafcillin, SN-38, and vincristine) on the sinusoidal side for 120 min in the absence (red bars) or presence (green bars) of a mixture of the MRP2 inhibitor benzbromarone (100 μM) or the P-gp inhibitor zosuquidar (5 μM). c Time-dependent BEI variation of substrates with known human in vivo biliary clearance in sandwich-cultured PXB-cells. PXB-cells (JFC) were incubated with 1 μM each of a mixture of substrates (cimetidine, digoxin, erythromycin, methotrexate, nafcillin, SN-38, and vincristine) for 2, 5, 10, and 20 min. The BEI for each substrate was calculated using Eq. (8). The dot plots represent the means of the groups and the shaded error bars represent the S.D. (n = 3 biological replicate wells). d, e The correlation between in vitro [(d) icHep (JFC) and (e) icHep (HUM181001B)] and in vivo biliary clearance of test substrates was evaluated. Data are presented as the means ± S.D. (n = 3 biological replicate wells). Statistical significance was determined using the Tukey-Kramer test and Pearson’s correlation analysis; *P < 0.05.
Fig. 6
Fig. 6. Drug-bile acid interactions involving drug metabolism and BSEP using icHep.
a The biliary transport of taurocholate across the icHep was measured from the sinusoidal side to the bile side. icHep were incubated with 1 μM taurocholate on the sinusoidal side for 120 min in the absence (red bar) or presence (green bars) of CIL (10 μM) and/or DFP (0.1, 1, and 10 μM). b Intracellular accumulation of taurocholate after 120 min of substrate permeation in the absence (red bar) or presence (green bars) of CIL (10 μM) and/or DFP (0.1, 1, and 10 μM). c Intracellular accumulation of CIL (orange bars), and CAN (silver bars) after 120 min of substrate permeation in the absence or presence of DFP (0.1, 1, and 10 μM). d, e The correlation between the biliary transport of taurocholate across the icHep and intracellular accumulation of (d) CIL or (e) CAN was evaluated. Data are presented as the means ± S.D. (n = 3 biological replicate wells). Statistical significance was determined using the Tukey-Kramer test and Pearson’s correlation analysis; *P < 0.05.

Similar articles

References

    1. Tetsuka K, Ohbuchi M, Tabata K. Recent Progress in Hepatocyte Culture Models and Their Application to the Assessment of Drug Metabolism, Transport, and Toxicity in Drug Discovery: The Value of Tissue Engineering for the Successful Development of a Microphysiological System. J. Pharm. Sci. 2017;106:2302–2311. - PubMed
    1. Ohkura T, et al. Evaluation of human hepatocytes cultured by three-dimensional spheroid systems for drug metabolism. Drug Metabol. Pharmacokinet. 2014;29:373–378. - PubMed
    1. Arakawa H, et al. Kinetic analysis of sequential metabolism of triazolam and its extrapolation to humans using an entero-hepatic two-organ microphysiological system. Lab. Chip. 2020;20:537–547. - PubMed
    1. Scott DE, Bayly AR, Abell C, Skidmore J. Small molecules, big targets: drug discovery faces the protein-protein interaction challenge. Nat. Rev. Drug Discov. 2016;15:533–550. - PubMed
    1. Lu H, et al. Recent advances in the development of protein-protein interactions modulators: mechanisms and clinical trials. Signal. Transduct. Target Ther. 2020;5:213. - PMC - PubMed

Publication types