

Spatial distribution and ecological niche modeling of geographical spread of Anopheles gambiae complex in Nigeria using real time data
- PMID: 37608210
- PMCID: PMC10444803
- DOI: 10.1038/s41598-023-40929-5
Spatial distribution and ecological niche modeling of geographical spread of Anopheles gambiae complex in Nigeria using real time data
Abstract
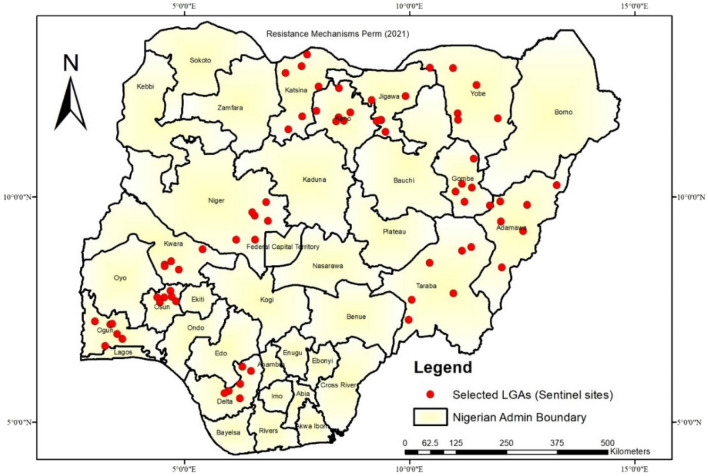
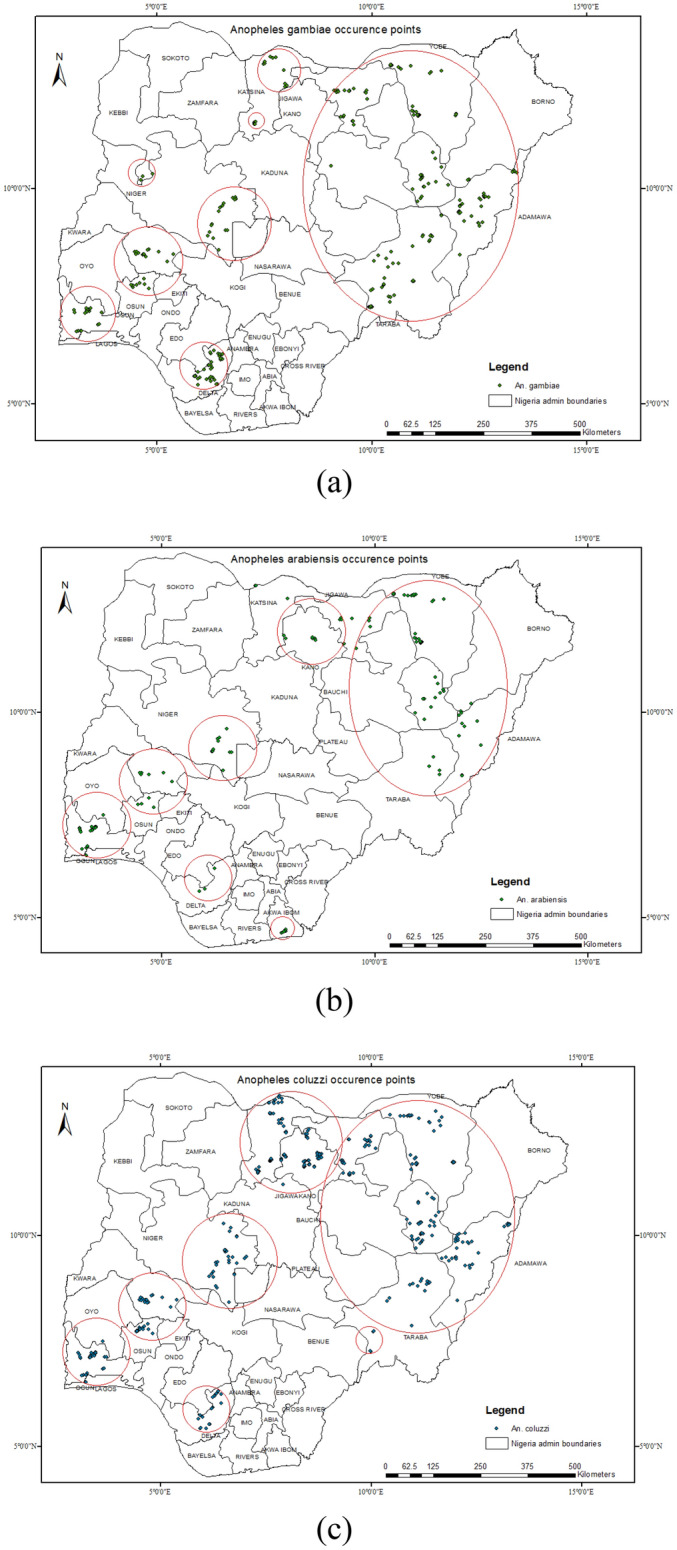
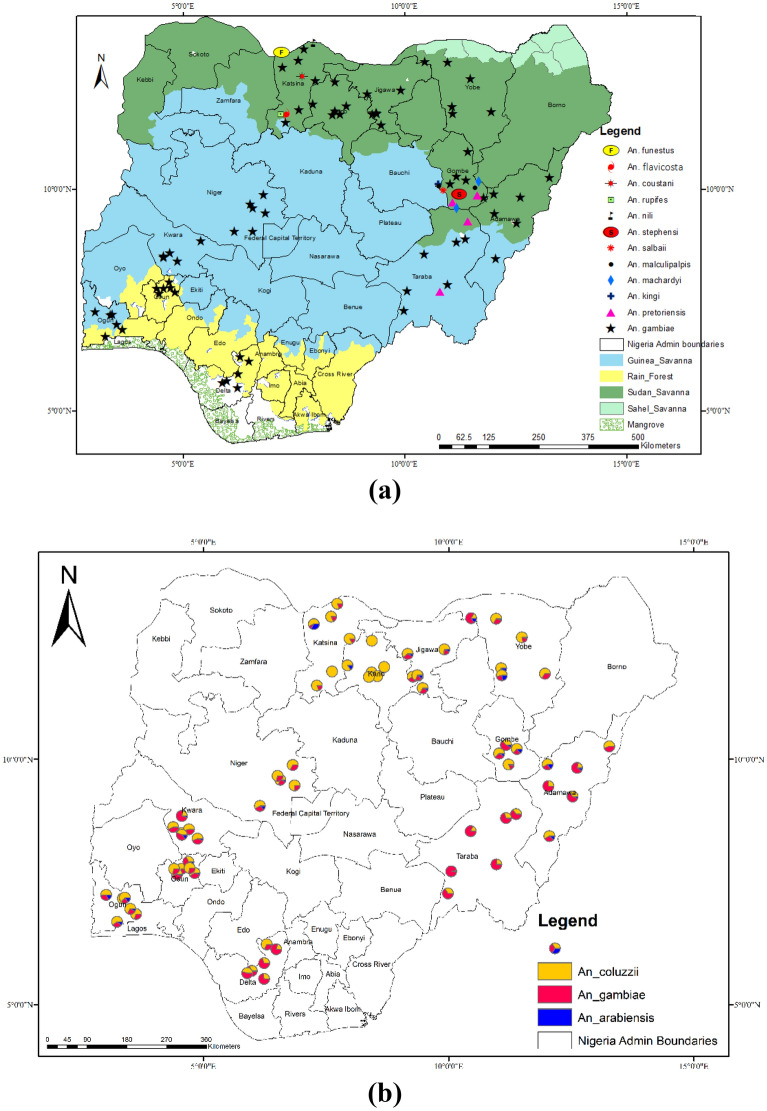
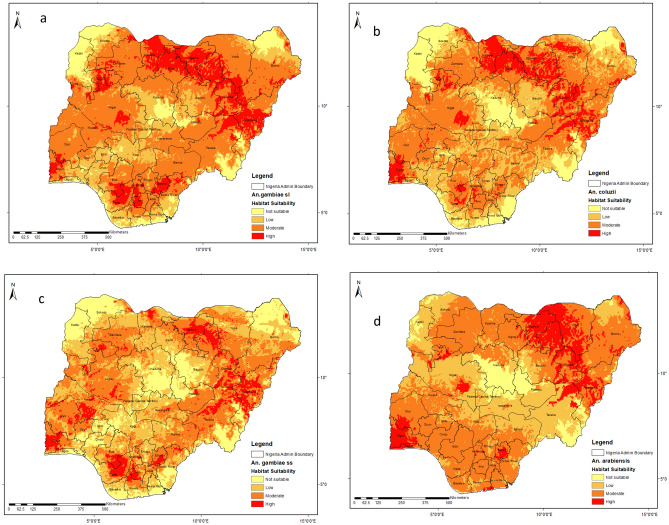
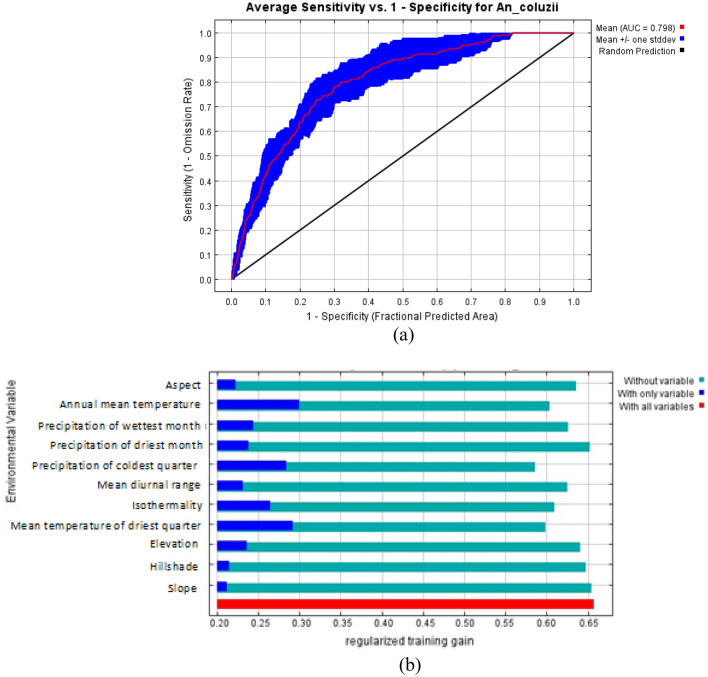
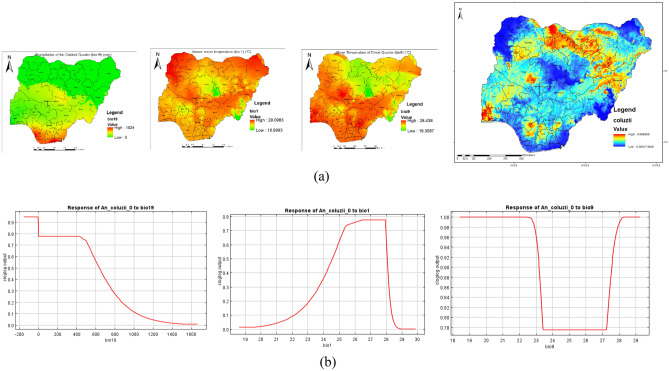
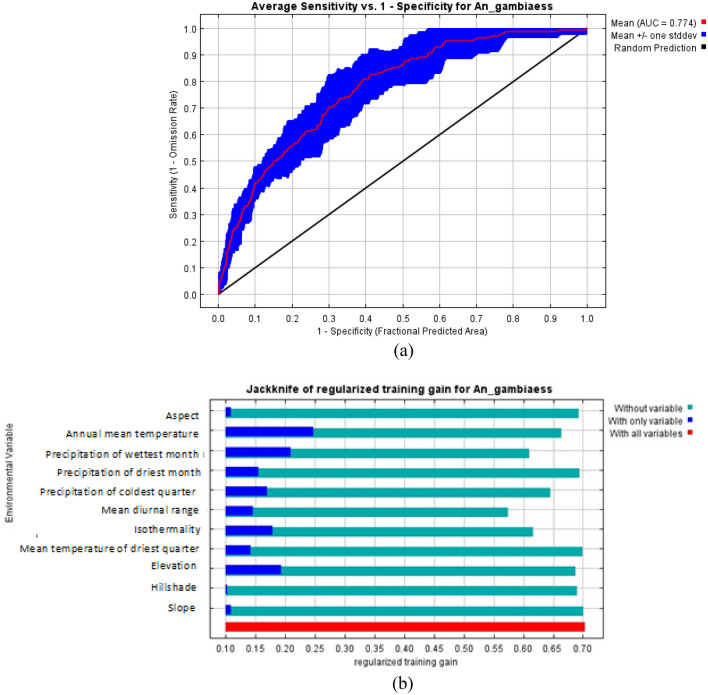
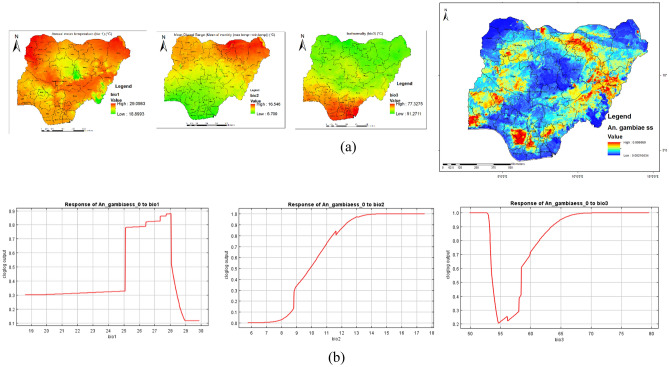
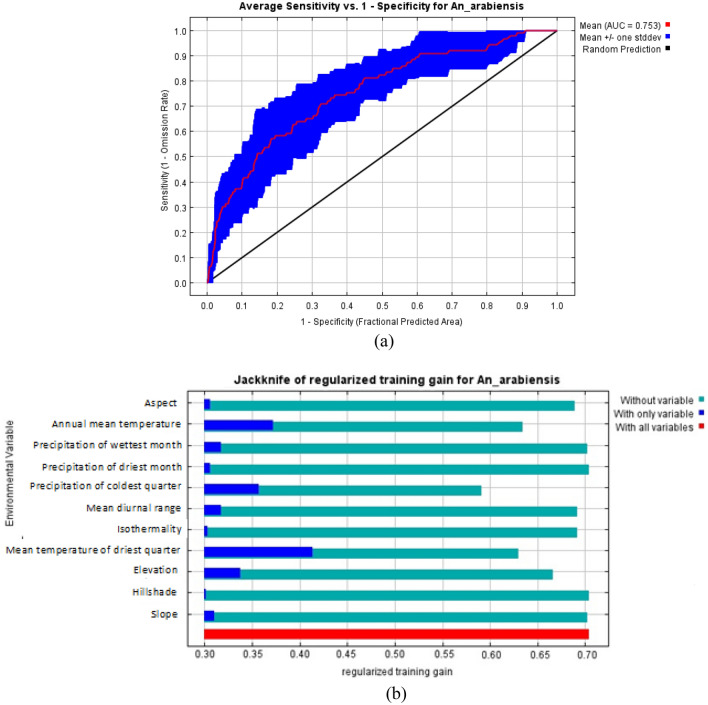
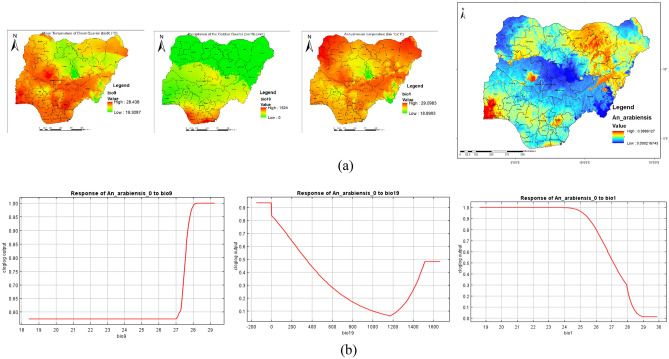
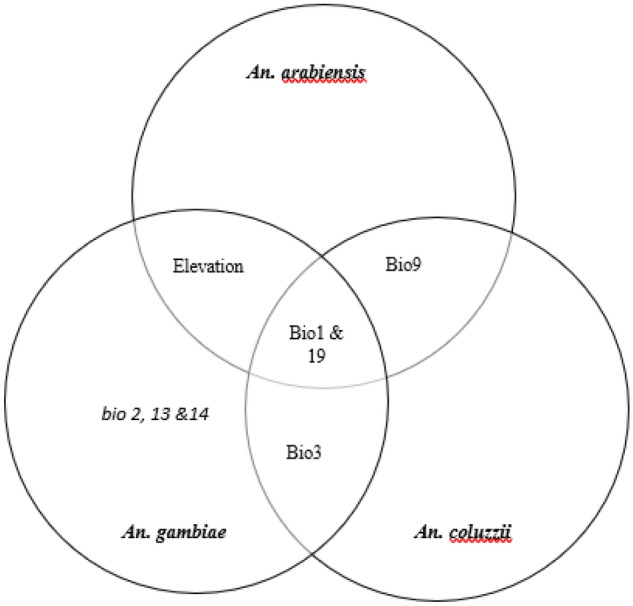
The need for evidence-based data, to inform policy decisions on malaria vector control interventions in Nigeria, necessitated the establishment of mosquito surveillance sites in a few States in Nigeria. In order to make evidence-based-decisions, predictive studies using available data becomes imperative. We therefore predict the distribution of the major members of the Anopheles gambiae s.l. in Nigeria. Immature stages of Anopheles were collected from 72 study locations which span throughout the year 2020 resulted in the identification of over 60,000 Anopheline mosquitoes. Of these, 716 breeding sites were identified with the presence of one or more vector species from the An. gambiae complex and were subsequently used for modelling the potential geographical distribution of these important malaria vectors. Maximum Entropy (MaxEnt) distribution modeling was used to predict their potentially suitable vector habitats across Nigeria. A total of 23 environmental variables (19 bioclimatic and four topographic) were used in the model resulting in maps of the potential geographical distribution of three dominant vector species under current climatic conditions. Members of the An. gambiae complex dominated the collections (98%) with Anopheles stephensi, Anopheles coustani, Anopheles funestus, Anopheles moucheti, Anopheles nilli also present. An almost equal distribution of the two efficient vectors of malaria, An. gambiae and Anopheles coluzzii, were observed across the 12 states included in the survey. Anopheles gambiae and Anopheles coluzzii had almost equal, well distributed habitat suitability patterns with the latter having a slight range expansion. However, the central part of Nigeria (Abuja) and some highly elevated areas (Jos) in the savannah appear not suitable for the proliferation of these species. The most suitable habitat for Anopheles arabiensis was mainly in the South-west and North-east. The results of this study provide a baseline allowing decision makers to monitor the distribution of these species and establish a management plan for future national mosquito surveillance and control programs in Nigeria.
© 2023. Springer Nature Limited.
Conflict of interest statement
The authors declare no competing interests.
Figures
Similar articles
-
Modelling species distribution of Anopheles gambiae s.l. in Osun state using random forest modeling approach.Sci Rep. 2025 May 13;15(1):16524. doi: 10.1038/s41598-025-95001-1. Sci Rep. 2025. PMID: 40360721 Free PMC article.
-
Sibling species of the major malaria vector Anopheles gambiae display divergent preferences for aquatic breeding sites in southern Nigeria.Malar J. 2024 Feb 27;23(1):60. doi: 10.1186/s12936-024-04871-9. Malar J. 2024. PMID: 38413961 Free PMC article.
-
Habitat suitability and ecological niche profile of major malaria vectors in Cameroon.Malar J. 2009 Dec 23;8:307. doi: 10.1186/1475-2875-8-307. Malar J. 2009. PMID: 20028559 Free PMC article.
-
Changes in contributions of different Anopheles vector species to malaria transmission in east and southern Africa from 2000 to 2022.Parasit Vectors. 2023 Nov 7;16(1):408. doi: 10.1186/s13071-023-06019-1. Parasit Vectors. 2023. PMID: 37936155 Free PMC article. Review.
-
Highlights on Anopheles nili and Anopheles moucheti, Malaria Vectors in Africa.In: Manguin S, editor. Anopheles Mosquitoes: New Insights into Malaria Vectors [Internet]. Rijeka (HR): InTech; 2013 Jul 24. Chapter 8. In: Manguin S, editor. Anopheles Mosquitoes: New Insights into Malaria Vectors [Internet]. Rijeka (HR): InTech; 2013 Jul 24. Chapter 8. PMID: 28045480 Free Books & Documents. Review.
Cited by
-
Future Climate Change and Anthropogenic Disturbance Promote the Invasions of the World's Worst Invasive Insect Pests.Insects. 2024 Apr 16;15(4):280. doi: 10.3390/insects15040280. Insects. 2024. PMID: 38667410 Free PMC article.
-
Modelling species distribution of Anopheles gambiae s.l. in Osun state using random forest modeling approach.Sci Rep. 2025 May 13;15(1):16524. doi: 10.1038/s41598-025-95001-1. Sci Rep. 2025. PMID: 40360721 Free PMC article.
-
Vector Abundance and Genetic Diversity of Anopheles Mosquitoes Collected in a Laboratory-Office Complex in Vom, Nigeria: Implications for Vector Control.Public Health Chall. 2025 Jul 22;4(3):e70079. doi: 10.1002/puh2.70079. eCollection 2025 Sep. Public Health Chall. 2025. PMID: 40698045 Free PMC article.
-
Range dynamics of Anopheles mosquitoes in Africa suggest a significant increase in the malaria transmission risk.Ecol Evol. 2024 Jul 31;14(8):e70059. doi: 10.1002/ece3.70059. eCollection 2024 Aug. Ecol Evol. 2024. PMID: 39091337 Free PMC article.
-
Geospatial modeling of geographical spread of Aedes species, in relation to climatic and topographical factors in Lagos State, Nigeria.PLoS Negl Trop Dis. 2025 Feb 6;19(2):e0012860. doi: 10.1371/journal.pntd.0012860. eCollection 2025 Feb. PLoS Negl Trop Dis. 2025. PMID: 39913605 Free PMC article.
References
-
- Coluzzii M. The clay feet of the malaria giant and its African roots: Hypotheses and inferences about origin, spread and control of Plasmodium falciparum. Parassitologia. 1999;41(1–3):277–283. - PubMed
-
- Coetzee M. Distribution of the African malaria vectors of the An. gambiae complex. Am. J. Trop. Med. Hyg. 2004;70(2):103–104. - PubMed
-
- WHO. World malaria report, 2022. WHO Geneva Switzerland. https://www.google.com/url?sa=t&rct=j&q=&esrc=s&source=web&cd=&cad=rja&u.... Accessed 15 February 2023 (2022)
Publication types
MeSH terms
LinkOut - more resources
Full Text Sources
Medical
