

Influence of ultrasound machine settings on quantitative measures derived from spatial frequency analysis of muscle tissue
- PMID: 37608370
- PMCID: PMC10463672
- DOI: 10.1186/s12891-023-06790-3
Influence of ultrasound machine settings on quantitative measures derived from spatial frequency analysis of muscle tissue
Abstract
Background: Ultrasound is a powerful tool for diagnostic purposes and provides insight into both normal and pathologic tissue structure. Spatial frequency analysis (SFA) methods characterize musculoskeletal tissue organization from ultrasound images. Both sonographers in clinical imaging and researchers may alter a minimized range of ultrasound settings to optimize image quality, and it is important to know how these small adjustments of these settings affect SFA parameters. The purpose of this study was to investigate the effects of making small adjustments in a typical default ultrasound machine setting on extracted spatial frequency parameters (peak spatial frequency radius (PSFR), Mmax, Mmax%, and Sum) in the biceps femoris muscle.
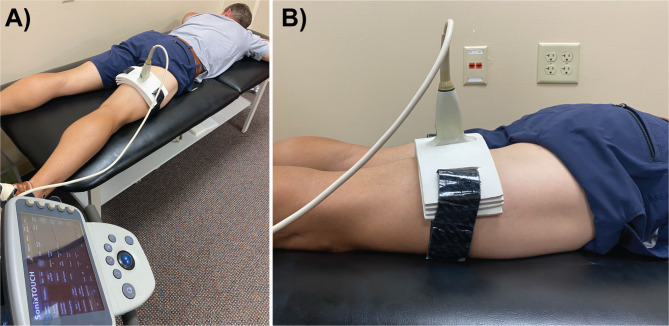
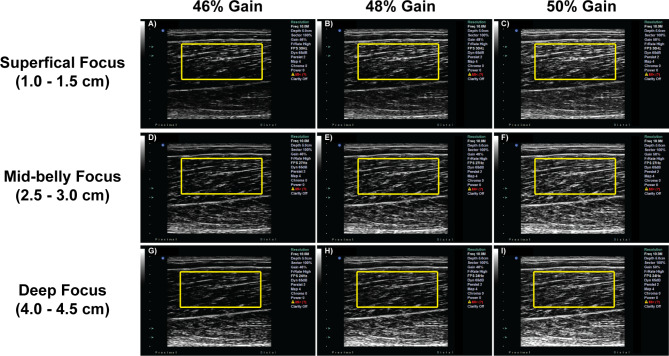
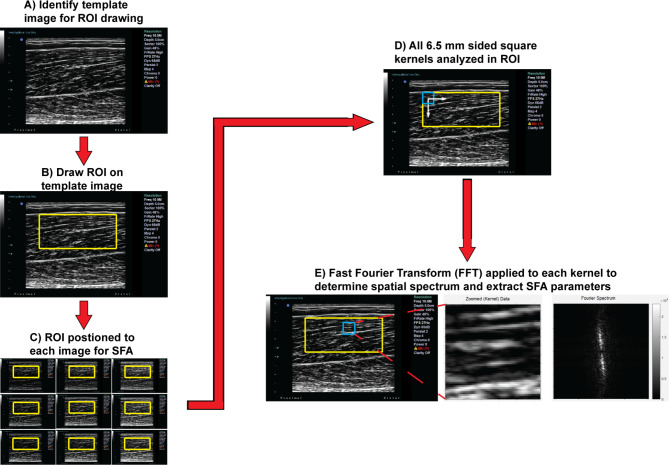
Methods: Longitudinal B-mode images were collected from the biceps femoris muscle in 36 participants. The window depth, foci locations, and gain were systematically adjusted consistent with clinical imaging procedures for a total of 27 images per participant. Images were analyzed by identifying a region of interest (ROI) in the middle portion of the muscle belly in a template image and using a normalized two-dimensional cross-correlation technique between the template image and subsequent images. The ROI was analyzed in the frequency domain using conventional SFA methods. Separate linear mixed effects models were run for each extracted parameter.
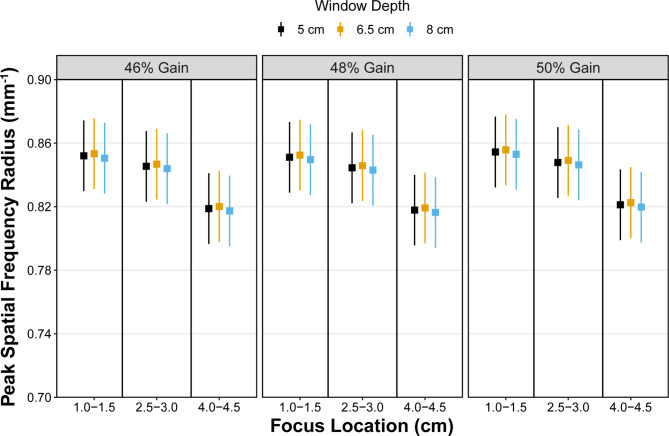
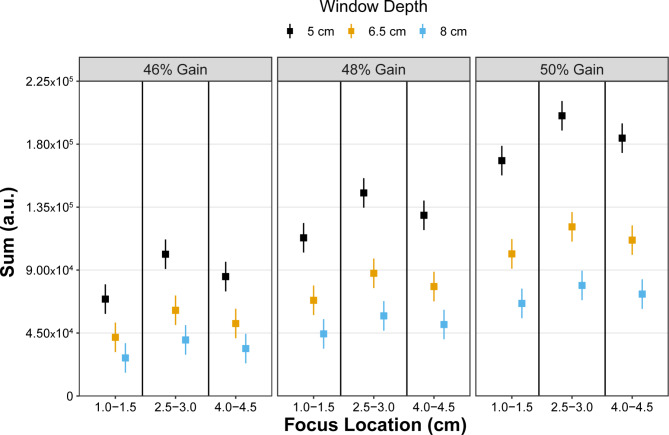
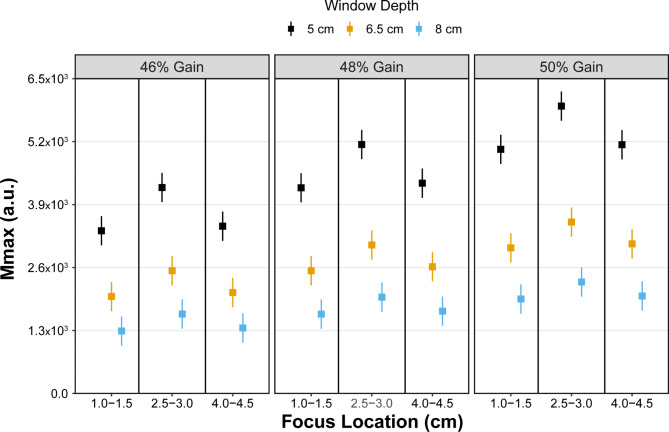
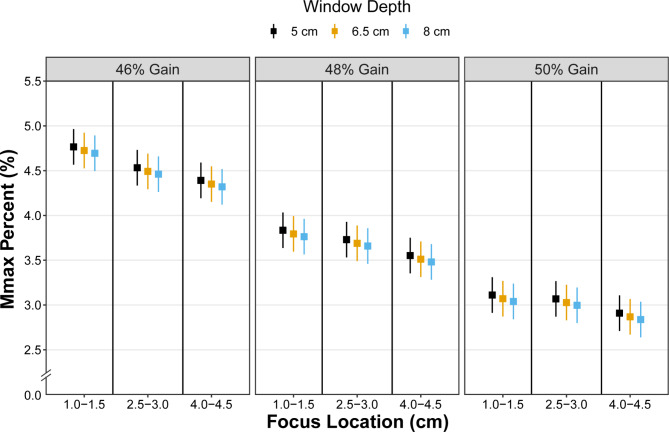
Results: PSFR was affected by modifications in focus location only (p < 0.001) with differences noted between all locations. Mmax% was influenced by the interaction of gain and focus location (p < 0.001) but was also independently affected by increasing window depth (p < 0.001). Both Mmax and Sum parameters were sensitive to small changes in machine settings with the interaction of focus location and window depth (p < 0.001 for both parameters) as well as window depth and gain (p < 0.001 for both) influencing the extracted values.
Conclusions: Frequently adjusted imaging settings influence some SFA statistics. PSFR and Mmax% appear to be most robust to small changes in image settings, making them best suited for comparison across individuals and between studies, which is appealing for the clinical utility of the SFA method.
Keywords: Hamstring muscles; Imaging; Musculoskeletal; Spatial frequency; Ultrasonography.
© 2023. BioMed Central Ltd., part of Springer Nature.
Conflict of interest statement
The authors declare no competing interests.
Figures
Similar articles
-
Spatial-frequency Analysis of the Anatomical Differences in Hamstring Muscles.Ultrason Imaging. 2021 Mar;43(2):100-108. doi: 10.1177/0161734621990707. Ultrason Imaging. 2021. PMID: 33563139 Free PMC article.
-
Spatial frequency analysis detects altered tissue organization following hamstring strain injury at time of injury but not return to sport.BMC Med Imaging. 2021 Dec 10;21(1):190. doi: 10.1186/s12880-021-00721-1. BMC Med Imaging. 2021. PMID: 34886796 Free PMC article.
-
Intra-session and inter-rater reliability of spatial frequency analysis methods in skeletal muscle.PLoS One. 2020 Jul 10;15(7):e0235924. doi: 10.1371/journal.pone.0235924. eCollection 2020. PLoS One. 2020. PMID: 32649705 Free PMC article.
-
Sonographic landmarks in hamstring muscles.Skeletal Radiol. 2019 Nov;48(11):1675-1683. doi: 10.1007/s00256-019-03208-x. Epub 2019 Apr 17. Skeletal Radiol. 2019. PMID: 30997529 Free PMC article. Review.
-
Ultrasound Features of the Proximal Hamstring Muscle-Tendon-Bone Unit.J Ultrasound Med. 2019 May;38(5):1367-1382. doi: 10.1002/jum.14804. Epub 2018 Sep 27. J Ultrasound Med. 2019. PMID: 30260012 Review.
References
-
- Arts IMP, Pillen S, Schelhaas HJ, Overeem S, Zwarts MJ. Normal values for quantitative muscle ultrasonography in adults. 2010;41:32–41. - PubMed
MeSH terms
Grants and funding
LinkOut - more resources
Full Text Sources
