

Ultrasonographic measurements of fascicle length overestimate adaptations in serial sarcomere number
- PMID: 37608723
- PMCID: PMC10988429
- DOI: 10.1113/EP091334
Ultrasonographic measurements of fascicle length overestimate adaptations in serial sarcomere number
Abstract
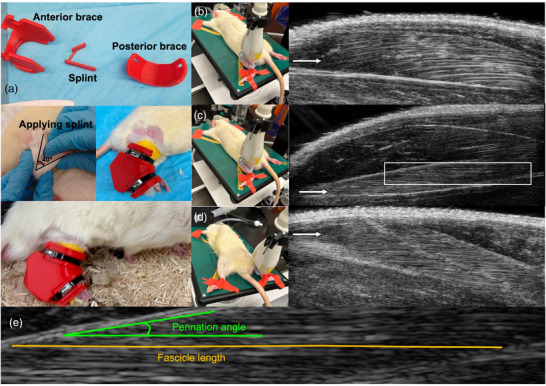
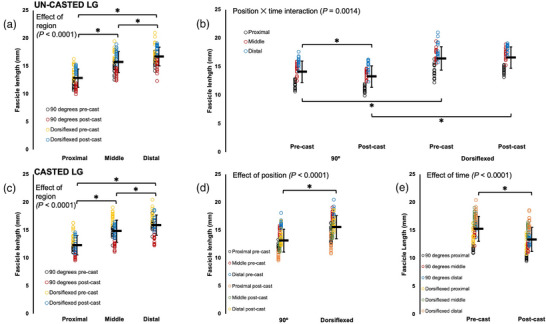
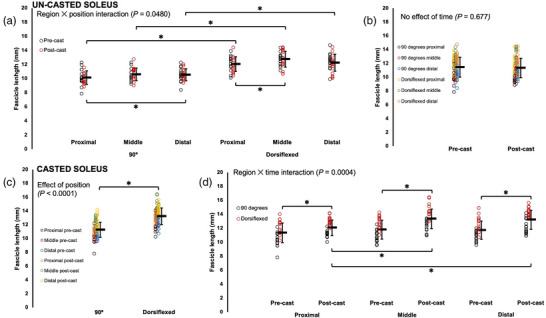
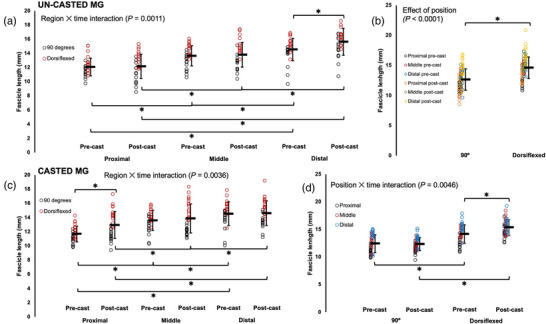
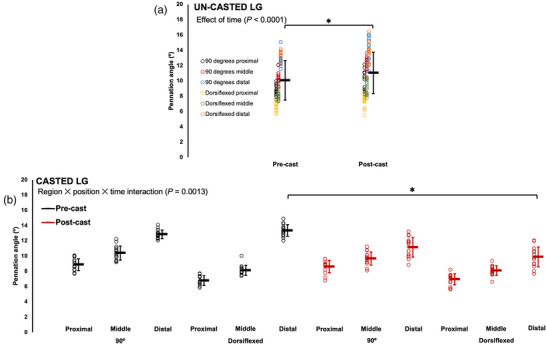
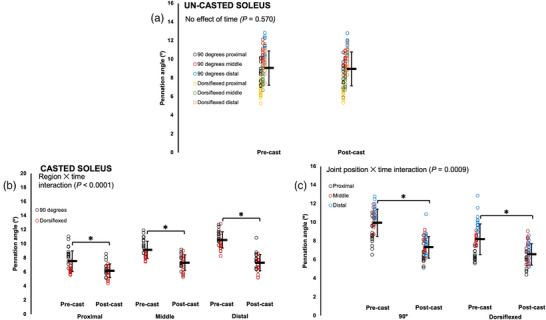
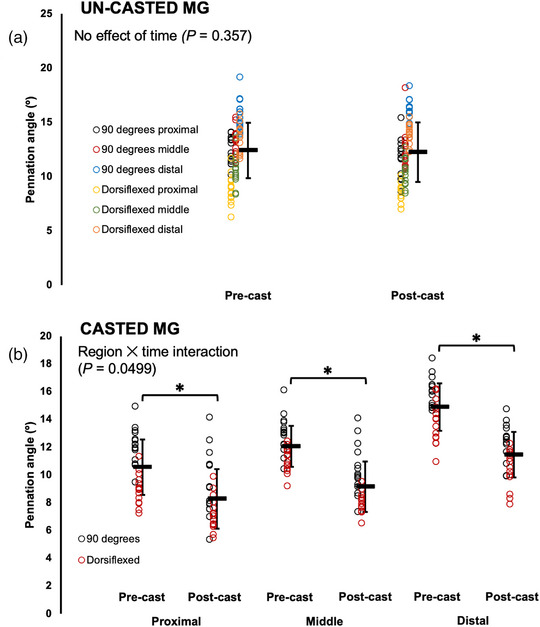
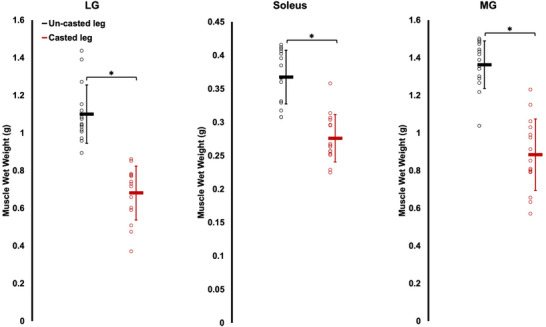
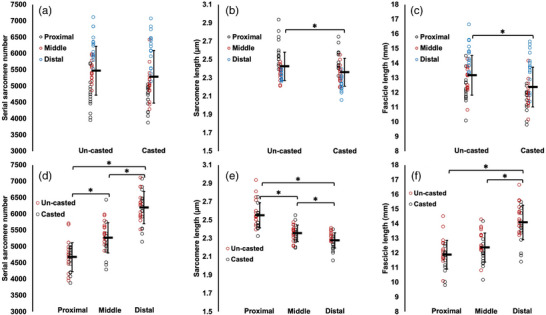
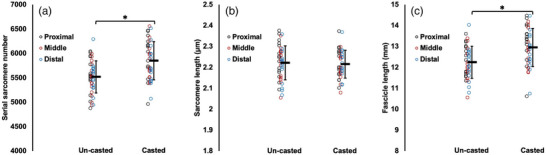
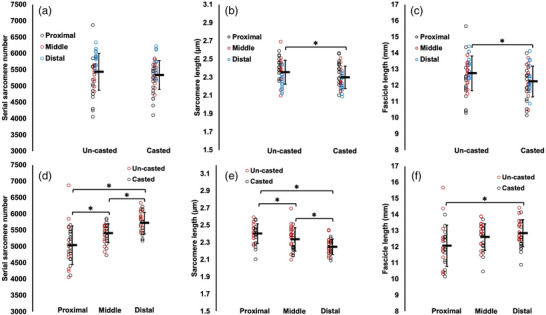
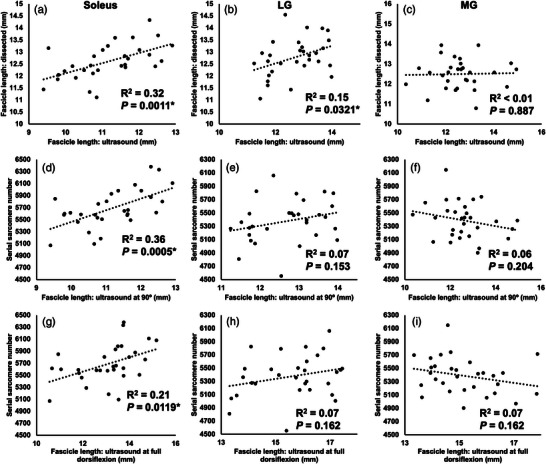
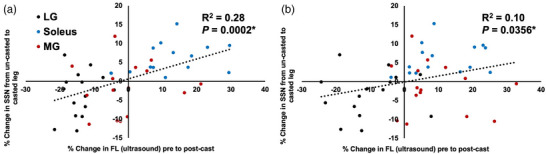
Ultrasound-derived measurements of muscle fascicle length (FL) are often used to infer increases (chronic stretch or training) or decreases (muscle disuse or aging) in serial sarcomere number (SSN). Whether FL adaptations measured via ultrasound can truly approximate SSN adaptations has not been investigated. We casted the right hindlimb of 15 male Sprague-Dawley rats in a dorsiflexed position (i.e., stretched the plantar flexors) for 2 weeks, with the left hindlimb serving as a control. Ultrasound images of the soleus, lateral gastrocnemius (LG), and medial gastrocnemius (MG) were obtained with the ankle at 90° and full dorsiflexion for both hindlimbs pre and post-cast. Following post-cast ultrasound measurements, legs were fixed in formalin with the ankle at 90°, then muscles were dissected and fascicles were teased out for measurement of sarcomere lengths via laser diffraction and calculation of SSN. Ultrasound detected an 11% increase in soleus FL, a 12% decrease in LG FL, and an 8-11% increase in MG FL for proximal fascicles and at full dorsiflexion. These adaptations were partly reflected by SSN adaptations, with a 6% greater soleus SSN in the casted leg than the un-casted leg, but no SSN differences for the gastrocnemii. Weak relationships were observed between ultrasonographic measurements of FL and measurements of FL and SSN from dissected fascicles. Our results showed that ultrasound-derived FL measurements can overestimate an increase in SSN by ∼5%. Future studies should be cautious when concluding a large magnitude of sarcomerogenesis from ultrasound-derived FL measurements, and may consider applying a correction factor. NEW FINDINGS: What is the central question of this study? Measurements of muscle fascicle length via ultrasound are often used to infer changes in serial sarcomere number, such as increases following chronic stretch or resistance training, and decreases with ageing: does ultrasound-derived fascicle length accurately depict adaptations in serial sarcomere number? What is the main finding and its importance? Ultrasound detected an ∼11% increase in soleus fascicle length, but measurements on dissected fascicles showed the actual serial sarcomere number increase was only ∼6%; therefore, measurements of ultrasound-derived fascicle length can overestimate serial sarcomere number adaptations by as much as 5%.
Keywords: casting; fascicle; immobilization; pennation angle; sarcomere; sarcomerogenesis; ultrasound.
© 2023 The Authors. Experimental Physiology published by John Wiley & Sons Ltd on behalf of The Physiological Society.
Conflict of interest statement
No conflicts of interest, financial or otherwise, are declared by the authors.
Figures
Similar articles
-
Submaximal Eccentric Training During Immobilization Does Not Prevent Serial Sarcomere Loss or Impairments in Mechanical Function in Old or Young Rats.J Gerontol A Biol Sci Med Sci. 2025 Jun 10;80(7):glaf082. doi: 10.1093/gerona/glaf082. J Gerontol A Biol Sci Med Sci. 2025. PMID: 40237382 Free PMC article.
-
Age-related differences in the loss and recovery of serial sarcomere number following disuse atrophy in rats.Skelet Muscle. 2024 Aug 2;14(1):18. doi: 10.1186/s13395-024-00351-5. Skelet Muscle. 2024. PMID: 39095894 Free PMC article.
-
Age-related blunting of serial sarcomerogenesis and mechanical adaptations following 4 wk of maximal eccentric resistance training.J Appl Physiol (1985). 2024 May 1;136(5):1209-1225. doi: 10.1152/japplphysiol.00041.2024. Epub 2024 Mar 21. J Appl Physiol (1985). 2024. PMID: 38511212
-
The importance of serial sarcomere addition for muscle function and the impact of aging.J Appl Physiol (1985). 2023 Aug 1;135(2):375-393. doi: 10.1152/japplphysiol.00205.2023. Epub 2023 Jul 6. J Appl Physiol (1985). 2023. PMID: 37410905 Review.
-
The mechanisms of adaptation for muscle fascicle length changes with exercise: Implications for spastic muscle.Med Hypotheses. 2020 Nov;144:110199. doi: 10.1016/j.mehy.2020.110199. Epub 2020 Aug 18. Med Hypotheses. 2020. PMID: 33254508 Review.
Cited by
-
Commentary on "Multiscale hamstring muscle adaptations following 9 weeks of eccentric training".J Sport Health Sci. 2024 Oct 26;14:101002. doi: 10.1016/j.jshs.2024.101002. Online ahead of print. J Sport Health Sci. 2024. PMID: 39490653 Free PMC article. No abstract available.
-
A retrospective comparison of the biceps femoris long head muscle structure in athletes with and without hamstring strain injury history.PLoS One. 2024 Feb 26;19(2):e0298146. doi: 10.1371/journal.pone.0298146. eCollection 2024. PLoS One. 2024. PMID: 38408057 Free PMC article.
-
Optimizing Resistance Training for Sprint and Endurance Athletes: Balancing Positive and Negative Adaptations.Sports Med. 2024 Dec;54(12):3019-3050. doi: 10.1007/s40279-024-02110-4. Epub 2024 Oct 7. Sports Med. 2024. PMID: 39373864 Free PMC article. Review.
-
Submaximal eccentric resistance training increases serial sarcomere number and improves dynamic muscle performance in old rats.Physiol Rep. 2024 Oct;12(19):e70036. doi: 10.14814/phy2.70036. Physiol Rep. 2024. PMID: 39362825 Free PMC article.
-
Submaximal Eccentric Training During Immobilization Does Not Prevent Serial Sarcomere Loss or Impairments in Mechanical Function in Old or Young Rats.J Gerontol A Biol Sci Med Sci. 2025 Jun 10;80(7):glaf082. doi: 10.1093/gerona/glaf082. J Gerontol A Biol Sci Med Sci. 2025. PMID: 40237382 Free PMC article.
References
-
- Adkins, A. N. , Dewald, J. P. A. , Garmirian, L. P. , Nelson, C. M. , & Murray, W. M. (2021). Serial sarcomere number is substantially decreased within the paretic biceps brachii in individuals with chronic hemiparetic stroke. Proceedings of the National Academy of Sciences, USA, 118(26), e2008597118. - PMC - PubMed
-
- Ahtikoski, A. M. , Koskinen, S. O. A. , Virtanen, P. , Kovanen, V. , & Takala, T. E. S. (2001). Regulation of synthesis of fibrillar collagens in rat skeletal muscle during immobilization in shortened and lengthened positions. Acta Physiologica Scandinavica, 172(2), 131–140. - PubMed
-
- Aoki, M. S. , Soares, A. G. , & Miyabara, E. H. , Baptista, I. L. , & Moriscot, A. S. (2009). Expression of genes related to myostatin signaling during rat skeletal muscle longitudinal growth: Myostatin and Longitudinal Growth. Muscle & Nerve, 40(6), 992–999. - PubMed
-
- Blazevich, A. J. , Cannavan, D. , Coleman, D. R. , & Horne, S. (2007). Influence of concentric and eccentric resistance training on architectural adaptation in human quadriceps muscles. Journal of Applied Physiology, 103(5), 1565–1575. - PubMed
-
- Boakes, J. L. , Foran, J. , Ward, S. R. , & Lieber, R. L. (2007). Muscle adaptation by serial sarcomere addition 1 year after femoral lengthening. Clinical Orthopaedics and Related Research, 456, 250–253. - PubMed
MeSH terms
Grants and funding
LinkOut - more resources
Full Text Sources
Miscellaneous