. 2023 Oct;10(10):1863-1872.
doi: 10.1002/acn3.51880. Epub 2023 Aug 23.

Cyclical underreporting of seizures in patient-based seizure documentation

Affiliations

Cyclical underreporting of seizures in patient-based seizure documentation

Andreas Schulze-Bonhage et al. Ann Clin Transl Neurol. 2023 Oct.

Abstract

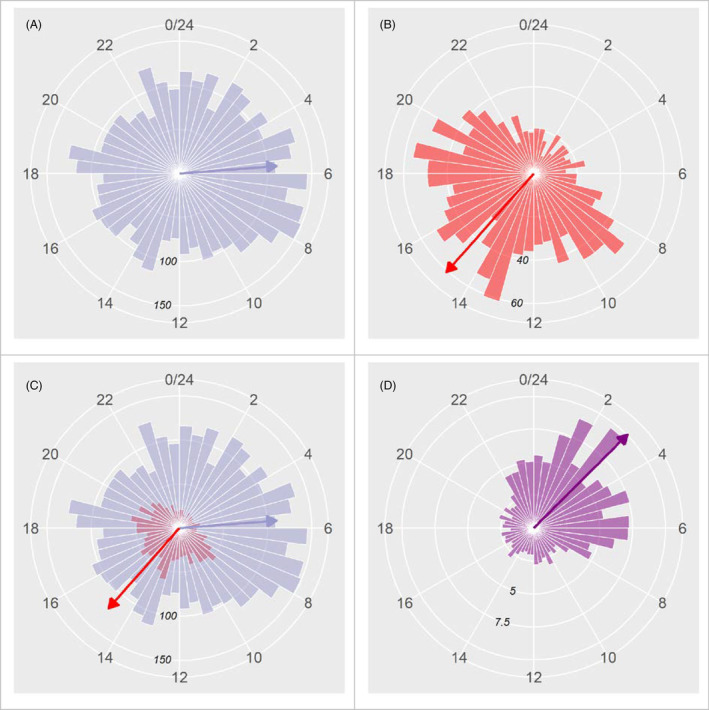
Objective: Circadian and multidien cycles of seizure occurrence are increasingly discussed as to their biological underpinnings and in the context of seizure forecasting. This study analyzes if patient reported seizures provide valid data on such cyclical occurrence.

Methods: We retrospectively studied if circadian cycles derived from patient-based reporting reflect the objective seizure documentation in 2003 patients undergoing in-patient video-EEG monitoring.

Results: Only 24.1% of more than 29000 seizures documented were accompanied by patient notifications. There was cyclical underreporting of seizures with a maximum during nighttime, leading to significant deviations in the circadian distribution of seizures. Significant cyclical deviations were found for focal epilepsies originating from both, frontal and temporal lobes, and for different seizure types (in particular, focal unaware and focal to bilateral tonic-clonic seizures).

Interpretation: Patient seizure diaries may reflect a cyclical reporting bias rather than the true circadian seizure distributions. Cyclical underreporting of seizures derived from patient-based reports alone may lead to suboptimal treatment schemes, to an underestimation of seizure-associated risks, and may pose problems for valid seizure forecasting. This finding strongly supports the use of objective measures to monitor cyclical distributions of seizures and for studies and treatment decisions based thereon.


Conflict of interest statement

ASB has received research funding from EU and American Epilepsy Foundation for the assessment of seizure occurrence using wearables and EEG recordings, and receives research funding from the company UNEEG for an ongoing clinical multicenter trial on subcutaneous ultralong‐term EEG recordings. MR has received research funding from EU and American Epilepsy Foundation for the assessment of seizure occurrence using wearables and EEG recordings. The other authors have nothing to report.

Figures

Figure 1
Figure 1
Rose plots showing the circadian distribution of objectively documented seizures (blue) and patient alarms (red). (A) Circadian distribution of objectively documented seizures as occurring during time bins of 30 min. (B) Circadian distribution of patient‐alarms. (C) Superposition of patient reporting and video‐EEG‐based seizure documentation. (D) Ratio of the number of documented seizures and patient‐reported seizures for every time bin. The time of day (0–24 h) is indicated by the numbers on the outermost circle. The numbers on the concentric inner circles indicate the event counts associated with bars of the same length as the radius of the respective circle. The arrows are resultant vectors scaled down to 1/3 (A and C) or 1/6 (B and D) of their real length to make them fit into the plots. Note that not only is the number of seizures objectively documented considerably higher at all times of the day and night, but also that the circadian distributions differ, with a maximum of patient‐reported events during the afternoon, and maximum objectively documented seizures during the night and the early morning hours. There is a cyclical underreporting of seizures by patients with maximum underreporting during nighttime.
Figure 2
Figure 2
Circadian distributions of video‐EEG and patient‐based seizure documentation for bilateral tonic–clonic seizures (A and B), all focal seizures (C and D), focal seizures unclassified to the state of awareness (E and F). The left column of plots (A, C, and E) represents seizure times (blue) and button press times (red) separately whereas the right column (B, D, and F) shows the quotient of the number of seizures and the number of button presses for every time bin, using the same data as the plot to its left. The time of day (24 h) is indicated by the numbers on the outermost circle. The bin size is 30 min in A, C, and E, and 60 min in B, D, and F. The numbers on the concentric inner circles indicate the event counts associated with bars of the same length as the radius of the respective circle. The arrows are resultant vectors scaled down to 1/3 (B–F), 1/5 (A) of their real length to make them fit into the plots.
Figure 3
Figure 3
Circadian distributions of video‐EEG and patient‐based seizure documentation for focal aware seizures (A and B), and focal unaware seizures (C and D). The left column of plots (A and C) represents seizure times (blue) and button press times (red) separately whereas the right column (B and D) shows the quotient of the number of seizures and the number of button presses for every time bin, using the same data as the plot to its left. The time of day (24 h) is indicated by the numbers on the outermost circle. The bin size is 30 min in A and C and 60 min in B and D. The numbers on the concentric inner circles indicate the event counts associated with bars of the same length as the radius of the respective circle. The arrows are resultant vectors scaled down to 1/3 (B–D) or 1/6 (A) of their real length to make them fit into the plots.
Figure 4
Figure 4
Circadian distributions of video‐EEG and patient‐based seizure documentation for patients with ≥80% success rate (A and B), temporal lobe epilepsy (C and D), and frontal lobe epilepsy (E and F). The left column of plots (A, C, and E) represents seizure times (blue) and button press times (red) separately, whereas each plot in the right column (B, D, and F) shows the quotient of the number of seizures and the number of button presses for every time bin, using the same data as the plot to its left. The time of day (24 h) is indicated by the numbers on the outermost circle. The bin size is 30 min in A, C, and E and 60 min in B, D, and F. The numbers on the concentric inner circles indicate the event counts associated with bars of the same length as the radius of the respective circle. The arrows are resultant vectors scaled down (except for b) to 1/3 (C, D, and F) or 1/6 (A and E) of their real length to make them fit into the plots.

Similar articles

Cited by

References

    1. Griffiths G, Fox JT. Rhythm in epilepsy. Lancet. 1938;232(5999):409‐416.
    1. Khan S, Khurana M, Vyas P, Vohora D. The role of melatonin and its analogues in epilepsy. Rev Neurosci. 2020;32:49‐67. doi: 10.1515/revneuro-2019-0088 - DOI - PubMed
    1. Kreitlow BL, Li W, Buchanan GF. Chronobiology of epilepsy and sudden unexpected death in epilepsy. Front Neurosci. 2022;16:936104. doi: 10.3389/fnins.2022.936104 - DOI - PMC - PubMed
    1. van Campen JS, Valentijn FA, Jansen FE, Joëls M, Braun KP. Seizure occurrence and the circadian rhythm of cortisol: a systematic review. Epilepsy Behav. 2015;47:132‐137. doi: 10.1016/j.yebeh.2015.04.071 - DOI - PubMed
    1. Haut SR, Hall CB, Masur J, Lipton RB. Seizure occurrence: precipitants and prediction. Neurology. 2007;69(20):1905‐1910. doi: 10.1212/01.wnl.0000278112.48285.84 - DOI - PubMed