. 2023 Aug 21;5(3):lqad075.
doi: 10.1093/nargab/lqad075. eCollection 2023 Sep.

ZENBU-Reports: a graphical web-portal builder for interactive visualization and dissemination of genome-scale data

Affiliations

ZENBU-Reports: a graphical web-portal builder for interactive visualization and dissemination of genome-scale data

Jessica Severin et al. NAR Genom Bioinform. .

Abstract

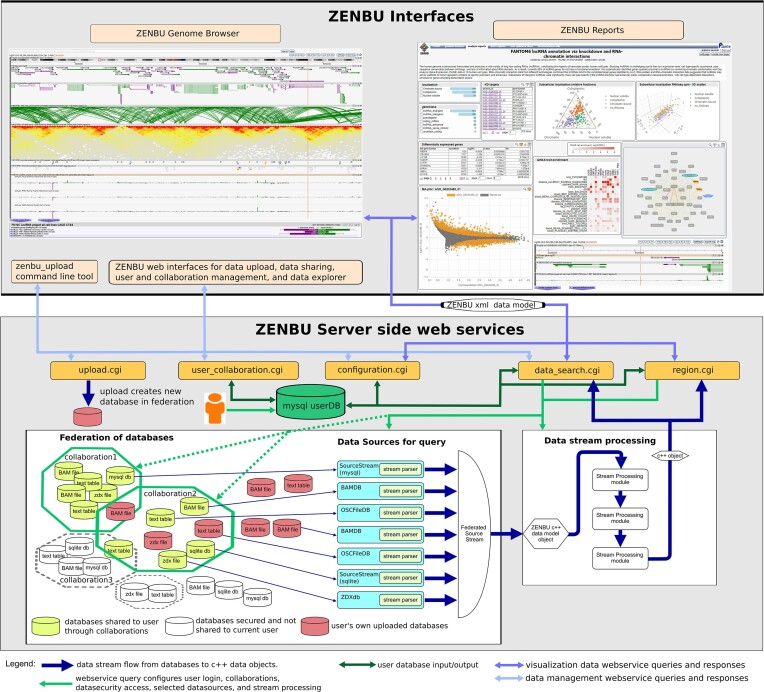
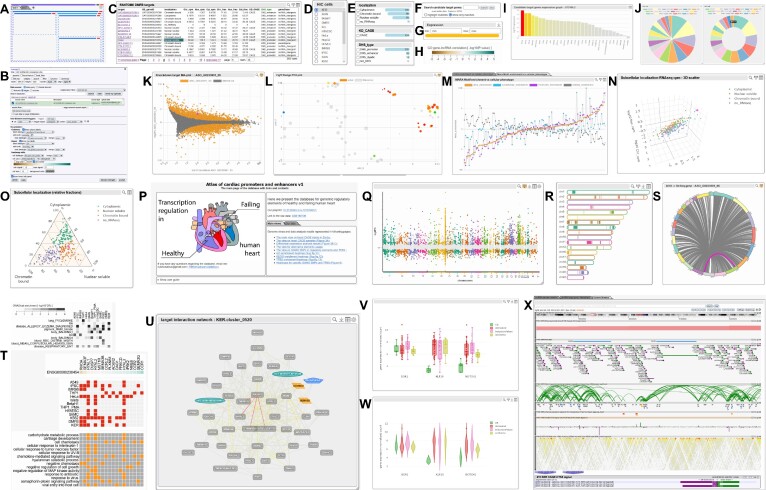
In the genomic era, data dissemination and visualization is an integral part of scientific publications and research projects involving international consortia producing massive genome-wide data sets, intra-organizational collaborations, or individual labs. However, creating custom supporting websites is oftentimes impractical due to the required programming effort, web server infrastructure, and data storage facilities, as well as the long-term maintenance burden. ZENBU-Reports (https://fantom.gsc.riken.jp/zenbu/reports) is a web application to create interactive scientific web portals by using graphical interfaces while providing storage and secured collaborative sharing for data uploaded by users. ZENBU-Reports provides the scientific visualization elements commonly used in supplementary websites, publications and presentations, presenting a complete solution for the interactive display and dissemination of data and analysis results during the full lifespan of a scientific project both during the active research phase and after publication of the results.


Figures

Figure 1.
Figure 1.
Overview of the relationship between ZENBU Reports (top right), the ZENBU genome browser (top left) and the ZENBU server side (bottom) with web services, federated database, data upload, and secured collaboration data management system.
Figure 2.
Figure 2.
ZENBU-Reports provides user-configurable Elements that are displayed on a web page using a graphical page-layout system of nested rows, columns and tabs (A). Each Element is associated with a set of dynamically loaded data sources. Elements can interact with each other via event triggers, and data sources can be shared with other Elements. Elements are configurable through a configuration panel (B). The primary Element type is a Table (C). Selecting a row in the table can trigger events to other Elements. A TreeList Element (D) is a simplified table. The Category Filter (E) allows data sets to be filtered. Search (F) and Filter (G) interfaces can be displayed or hidden. The Color Scale (H) Element shows a legend scale for a linked graphical Element of colored items. Bar graphs(I), Pie and Donut charts (J), 2D scatter plots (K), Bubble plots (L), Line graphs (M), interactive 3D scatter plots (N), and Ternary plots (O) are provided. A general purpose HTML Element (P) allows for direct input of HTML code for static text, images, hyperlinks or other page styling. Genome-wide Elements include a Manhattan Plot (Q), Chromosome view (R), and Circos-like circular graph showing connections between genomic regions (S). A Heatmap Element (T) can represent either color-scaled or binary data. An interactive Cytoscape (7) Element (U) visualizes networks. Box plots (V) and Violin plots (W) compare statistical distributions. ZENBU genome browser (X) instances can be embedded as Elements on a page and can interact with and be controlled by other Elements on the page through event triggers. The diagram in Panel (P) was modified from an image obtained from Wikimedia Commons under the Creative Commons Attribution-Share Alike 3.0 Unported license.

References

    1. FANTOM Consortium Severin J., Lizio M., Harshbarger J., Kawaji H., Daub C.O., Hayashizaki Y., Bertin N., Forrest A.R.R.. Interactive visualization and analysis of large-scale sequencing datasets using ZENBU. Nat. Biotechnol. 2014; 32:217–219. - PubMed
    1. FANTOM Consortium and the RIKEN PMI and CLST (DGT) Forrest A.R.R., Kawaji H., Rehli M., Baillie J.K., de Hoon M.J.L., Haberle V., Lassmann T., Kulakovskiy I.V., Lizio M.et al. .. A promoter-level mammalian expression atlas. Nature. 2014; 507:462–470. - PMC - PubMed
    1. Arner E., Daub C.O., Vitting-Seerup K., Andersson R., Lilje B., Drabløs F., Lennartsson A., Rönnerblad M., Hrydziuszko O., Vitezic M.et al. .. Transcribed enhancers lead waves of coordinated transcription in transitioning mammalian cells. Science. 2015; 347:1010–1014. - PMC - PubMed
    1. Ramilowski J.A., Yip C.W., Agrawal S., Chang J.-C., Ciani Y., Kulakovskiy I.V., Mendez M., Ooi J.L.C., Ouyang J.F., Parkinson N.et al. .. Functional annotation of human long noncoding rnas via molecular phenotyping. Genome Res. 2020; 30:1060–1072. - PMC - PubMed
    1. Agrawal S., Alam T., Koido M., Kulakovskiy I.V., Severin J., Abugessaisa I., Buyan A., Dostie J., Itoh M., Kondo N.et al. .. Functional annotation of human long noncoding rnas using chromatin conformation data. 2021; bioRxiv doi:14 January 2021, preprint: not peer reviewed10.1101/2021.01.13.426305. - DOI