Hemodynamic responses to handgrip and metaboreflex activation are exaggerated in individuals with metabolic syndrome independent of resting blood pressure, waist circumference, and fasting blood glucose
- PMID: 37608839
- PMCID: PMC10441127
- DOI: 10.3389/fphys.2023.1212775
Hemodynamic responses to handgrip and metaboreflex activation are exaggerated in individuals with metabolic syndrome independent of resting blood pressure, waist circumference, and fasting blood glucose
Abstract
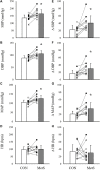
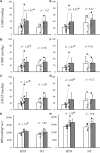
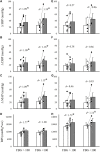
Introduction: Prior studies report conflicting evidence regarding exercise pressor and metaboreflex responses in individuals with metabolic syndrome (MetS). Purpose: To test the hypotheses that 1) exercise pressor and metaboreflex responses are exaggerated in MetS and 2) these differences may be explained by elevated resting blood pressure. Methods: Blood pressure and heart rate (HR) were evaluated in 26 participants (13 MetS) during 2 min of handgrip exercise followed by 3 min of post-exercise circulatory occlusion (PECO). Systolic (SBP), diastolic (DBP), and mean arterial pressure (MAP), along with HR and a cumulative blood pressure index (BPI), were compared between groups using independent samples t-tests, and analyses of covariance were used to adjust for differences in resting blood pressure, fasting blood glucose (FBG), and waist circumference (WC). Results: ΔSBP (∼78% and ∼54%), ΔMAP (∼67% and ∼55%), and BPI (∼16% and ∼20%) responses were significantly exaggerated in individuals with MetS during handgrip and PECO, respectively (all p ≤ 0.04). ΔDBP, ΔMAP, and BPI responses during handgrip remained significantly different between groups after independently covarying for resting blood pressure (p < 0.01), and after simultaneously covarying for resting blood pressure, FBG, and WC (p ≤ 0.03). Likewise, peak SBP, DBP, MAP, and BPI responses during PECO remained significantly different between groups after adjusting for resting blood pressure (p ≤ 0.03), with peak SBP, MAP, and BPI response remaining different between groups after adjusting for all three covariates simultaneously (p ≤ 0.04). Conclusion: These data suggest that exercise pressor and metaboreflex responses are significantly exaggerated in MetS independent of differences in resting blood pressure, FBG, or WC.
Keywords: PECO; blood pressure; cardiovascular; exercise pressor response; metabolic disease.
Copyright © 2023 Stavres, Aultman, Brandner, Newsome, Vallecillo-Bustos, Wise, Henderson, Stanfield, Mannozzi and Graybeal.
Conflict of interest statement
The authors declare that the research was conducted in the absence of any commercial or financial relationships that could be construed as a potential conflict of interest.
Figures


Similar articles
-
Exercise pressor responses are exaggerated relative to force production during, but not following, thirty-minutes of rhythmic handgrip exercise.Eur J Appl Physiol. 2024 May;124(5):1547-1559. doi: 10.1007/s00421-023-05390-2. Epub 2023 Dec 29. Eur J Appl Physiol. 2024. PMID: 38155209
-
l-Citrulline supplementation attenuates blood pressure, wave reflection and arterial stiffness responses to metaboreflex and cold stress in overweight men.Br J Nutr. 2016 Jul;116(2):279-85. doi: 10.1017/S0007114516001811. Epub 2016 May 10. Br J Nutr. 2016. PMID: 27160957 Clinical Trial.
-
Cardiorespiratory responses to muscle metaboreflex activation in fibrosing interstitial lung disease.Exp Physiol. 2022 May;107(5):527-540. doi: 10.1113/EP090252. Epub 2022 Mar 30. Exp Physiol. 2022. PMID: 35298060 Free PMC article. Clinical Trial.
-
The impact of Ramadan fasting on the metabolic syndrome severity in relation to ethnicity and sex: Results of a systematic review and meta-analysis.Nutr Metab Cardiovasc Dis. 2022 Dec;32(12):2714-2729. doi: 10.1016/j.numecd.2022.09.001. Epub 2022 Sep 12. Nutr Metab Cardiovasc Dis. 2022. PMID: 36333203
-
Effects of exercise training on metabolic syndrome risk factors in post-menopausal women - A systematic review and meta-analysis of randomised controlled trials.Clin Nutr. 2023 Mar;42(3):337-351. doi: 10.1016/j.clnu.2023.01.008. Epub 2023 Jan 10. Clin Nutr. 2023. PMID: 36736057
Cited by
-
Exercise pressor responses are exaggerated relative to force production during, but not following, thirty-minutes of rhythmic handgrip exercise.Eur J Appl Physiol. 2024 May;124(5):1547-1559. doi: 10.1007/s00421-023-05390-2. Epub 2023 Dec 29. Eur J Appl Physiol. 2024. PMID: 38155209
-
Fat-free mass is associated with exercise pressor responses, but not cold pressor responses, in humans: influence of maximal voluntary contraction.Front Sports Act Living. 2024 Mar 5;6:1352192. doi: 10.3389/fspor.2024.1352192. eCollection 2024. Front Sports Act Living. 2024. PMID: 38510524 Free PMC article.
-
Effects of Ketone Ester Supplementation on Cognition and Appetite in Individuals with and Without Metabolic syndrome: A Randomized Trial.J Diet Suppl. 2025;22(3):382-400. doi: 10.1080/19390211.2025.2473371. Epub 2025 Mar 4. J Diet Suppl. 2025. PMID: 40040390 Clinical Trial.
-
Hemodynamic responses to the cold pressor test in individuals with metabolic syndrome: a case-control study in a multiracial sample of adults.J Hum Hypertens. 2024 Sep;38(9):655-662. doi: 10.1038/s41371-024-00938-x. Epub 2024 Jul 17. J Hum Hypertens. 2024. PMID: 39020025 Free PMC article.
-
Exploring gait velocity as a predictor of cardiometabolic disease risk in young adults.Front Sports Act Living. 2024 Mar 7;6:1365717. doi: 10.3389/fspor.2024.1365717. eCollection 2024. Front Sports Act Living. 2024. PMID: 38516535 Free PMC article.
References
-
- Assoumou H. G., Pichot V., Barthelemy J. C., Dauphinot V., Celle S., Gosse P., et al. (2010). Metabolic syndrome and short-term and long-term heart rate variability in elderly free of clinical cardiovascular disease: The PROOF study. Rejuvenation Res. 13, 653–663. 10.1089/rej.2010.1019 - DOI - PubMed
-
- Bakkar N. Z., Mougharbil N., Mroueh A., Kaplan A., Eid A. H., Fares S., et al. (2020). Worsening baroreflex sensitivity on progression to type 2 diabetes: Localized vs. systemic inflammation and role of antidiabetic therapy. Am. J. Physiol. Endocrinol. Metab. 319, E835–E851. 10.1152/ajpendo.00145.2020 - DOI - PubMed
LinkOut - more resources
Full Text Sources

