[Preprint]. 2023 Aug 11:2023.08.08.552197.
doi: 10.1101/2023.08.08.552197.

Stiffness anisotropy coordinates supracellular contractility driving long-range myotube-ECM alignment

Affiliations

Stiffness anisotropy coordinates supracellular contractility driving long-range myotube-ECM alignment

Nathaniel P Skillin et al. bioRxiv. .

Update in

Abstract

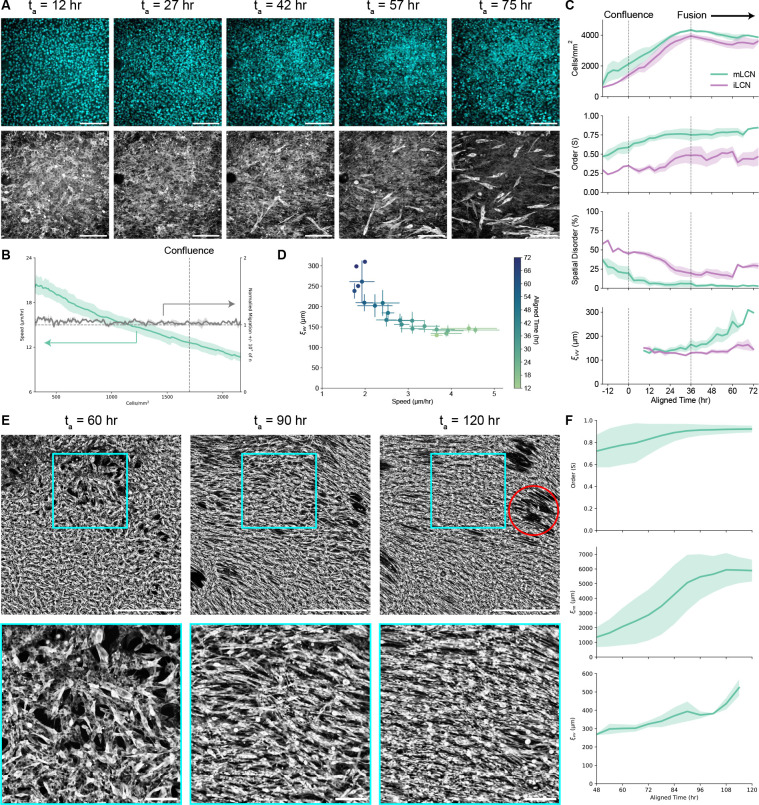
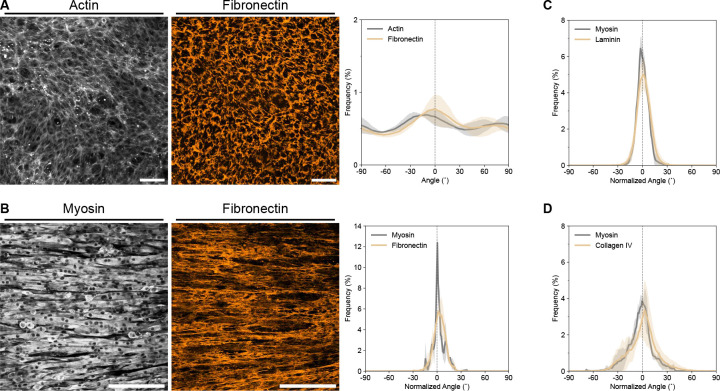
In skeletal muscle tissue, injury-related changes in stiffness activate muscle stem cells through mechanosensitive signaling pathways. Functional muscle tissue regeneration also requires the effective coordination of myoblast proliferation, migration, polarization, differentiation, and fusion across multiple length scales. Here, we demonstrate that substrate stiffness anisotropy coordinates contractility-driven collective cellular dynamics resulting in C2C12 myotube alignment over millimeter-scale distances. When cultured on mechanically anisotropic liquid crystalline polymer networks (LCNs) lacking topographic features that could confer contact guidance, C2C12 myoblasts collectively polarize in the stiffest direction of the substrate. Cellular coordination is amplified through reciprocal cell-ECM dynamics that emerge during fusion, driving global myotube-ECM ordering. Conversely, myotube alignment was restricted to small local domains with no directional preference on mechanically isotropic LCNs of same chemical formulation. These findings reveal a role for stiffness anisotropy in coordinating emergent collective cellular dynamics, with implications for understanding skeletal muscle tissue development and regeneration.

Keywords: collective cell behavior; liquid crystalline polymer networks; mechanosensing; myoblasts; myotube alignment; stiffness anisotropy.


Conflict of interest statement

Declaration of Interests The authors declare no competing interests.

Figures

Figure 1.
Figure 1.. mLCN stiffness anisotropy drives C2C12 myotube ordering.
(A) Illustration of monodomain and isotropic LCN network structure and mechanical anisotropy (n indicates nematic director of mLCN). (B) Elastic modulus parallel and orthogonal to mLCN nematic director derived from the initial linear regime of stress-strain curves. Stiffness anisotropy ratio E/E and difference EE is calculated from the mean of repeated tensile tests. Line indicates mean, all replicates shown. (C) Illustration of C2C12 growth and differentiation on mLCNs. Created with BioRender.com. (D) Representative images of myotubes stained for myosin II heavy chain (MF-20, gray) after 5 days of differentiation on monodomain (left) and isotropic (right) LCN-1.0. Scale bars = 1000 μm. (E) Myotube orientation-order parameter (S) and (F) nematic correlation length (μm) of myotubes after 5 days of differentiation on isotropic and aligned substrates (isotropic vs. monodomain for LCNs, glass coverslip vs. NanoSurface substrate for Glass). For the box plots in (E) and (F), the box limits extend from the 25th to 75th percentiles; the horizontal line indicates the median value; the whiskers extend by 1.5x the inter-quartile range; all replicates including outliers are shown. Statistical analysis was performed with one-tailed (isotropic v monodomain) or two-tailed (monodomain v monodomain) unpaired Student’s t-test with Welch’s correction with significance claimed at *p < 0.05, **p < 0.01, ***p < 0.001. ****p < 0.0001. See also Figures S1, S2, S3, and S4; Table S1.
Figure 2.
Figure 2.. Stiffness anisotropy coordinates collective cellular dynamics across multiple length scales.
(A) Representative images of C2C12 nuclei (top) and actin (bottom) on mLCNs at ta = 12, 27, 42, 57, and 75 hr (left to right). Scale bars = 200 μm. (B) Myoblast migration speed (μm/hr; left axis) and normalized migration ± 10° from nematic director (right axis) on mLCNs. Dashed line indicates approximate density at which myoblasts achieved confluence. Data are represented as mean ± SEM. (C) Top to bottom: Temporal evolution of cell density (cells/mm2), orientation-order parameter (S), spatial disorder (%), and velocity correlation length (μm) on mLCNs and iLCNs. Dashed lines indicate approximate time at which myoblasts achieved confluence (left) and initiated fusion (right). Data are represented as mean ± SEM. (D) Velocity correlation length (μm) as a function of cellular speed (μm/hr) after confluence on mLCNs. Data are represented as mean ± SEM. (E) Representative images (top) and inset (bottom) of C2C12 actin on mLCNs at ta = 60, 90, and 120 hr (left to right). Scale bars = 1000 μm (top) and 200 μm (bottom). Red circle indicates location of a contractile defect. (F) Top to bottom: Temporal evolution of orientation-order parameter (S), nematic correlation length (μm), and velocity correlation length (μm) on mLCNs. Data are represented as mean ± SEM. See also Figures S5; Videos S1 and S2.
Figure 3.
Figure 3.. Nascent ECM alignment develops in parallel with myotube alignment.
(A) Representative maximum intensity projections of actin (left) and fibronectin (middle) on mLCNs after reaching confluence. Scale bars = 100 μm. Corresponding frequency distribution plot (right) of actin and fibronectin alignment. Data are represented as mean ± SD. (B) Representative maximum intensity projections of myosin II heavy chain (left) and fibronectin (middle) on mLCNs after 5 days of differentiation. Scale bars = 200 μm. Corresponding frequency distribution plot (right) of myosin and fibronectin alignment. Data are represented as mean ± SD. (C, D) Frequency distribution plots of myosin and (C) Laminin, or (D) Collagen IV alignment after 5 days of differentiation. Data are represented as mean ± SD.
Figure 4.
Figure 4.. Reciprocal cell-ECM dynamics mediate collective cellular flows on mLCNs.
(A) Top to bottom: Temporal evolution of orientation-order parameter (S), nematic correlation length (μm), and velocity correlation length (μm) on mLCNs ± blebbistatin treatment. Dashed lines indicate timing of daily media changes, with the first addition of blebbistatin occurring at ta = 12 hr. Data are represented as mean ± SEM. (B) Velocity correlation length (μm) as a function of cellular speed (μm/hr) on mLCNs ± blebbistatin treatment. Data are represented as mean ± SEM. Arrow indicates first addition of blebbistatin. (C) Representative maximum intensity projections (left) of myosin II heavy chain (top) and fibronectin (bottom) after 3.5 days of differentiation on mLCNs ± blebbistatin treatment. Scale bars = 50 μm. Corresponding frequency distribution plot (right) of fibronectin alignment after 3.5 days of differentiation on mLCNs ± blebbistatin treatment. Data are represented as mean ± SD. See also Video S3.
Figure 5.
Figure 5.. Spatiotemporal evolution of collective cellular dynamics that drive C2C12 myoblast and myotube alignment with the nematic director of mLCNs.
Created with BioRender.com.

Similar articles

References

    1. Panciera T, Azzolin L, Cordenonsi M, Piccolo S. Mechanobiology of YAP and TAZ in physiology and disease. Nat Rev Mol Cell Biol. 2017;18(12):758–770. doi:10.1038/nrm.2017.87 - DOI - PMC - PubMed
    1. Vining KH, Mooney DJ. Mechanical forces direct stem cell behaviour in development and regeneration. Nat Rev Mol Cell Biol. 2017;18(12):728–742. doi:10.1038/nrm.2017.108 - DOI - PMC - PubMed
    1. Lo CM, Wang HB, Dembo M, Wang YL. Cell movement is guided by the rigidity of the substrate. Biophys J. 2000;79(1):144–152. doi:10.1016/S0006-3495(00)76279-5 - DOI - PMC - PubMed
    1. Sunyer R, Conte V, Escribano J, et al. Collective cell durotaxis emerges from long-range intercellular force transmission. Science (80- ). 2016;353(6304):1157–1161. doi:10.1126/science.aaf7119 - DOI - PubMed
    1. Shellard A, Mayor R. Collective durotaxis along a self-generated stiffness gradient in vivo. Nature. 2021;(November 2020). doi:10.1038/s41586-021-04210-x - DOI - PubMed

Publication types