[Preprint]. 2023 Dec 11:2023.08.06.552162.
doi: 10.1101/2023.08.06.552162.

Using deep long-read RNAseq in Alzheimer's disease brain to assess medical relevance of RNA isoform diversity

Affiliations

Using deep long-read RNAseq in Alzheimer's disease brain to assess medical relevance of RNA isoform diversity

Bernardo Aguzzoli Heberle et al. bioRxiv. .

Update in

Abstract

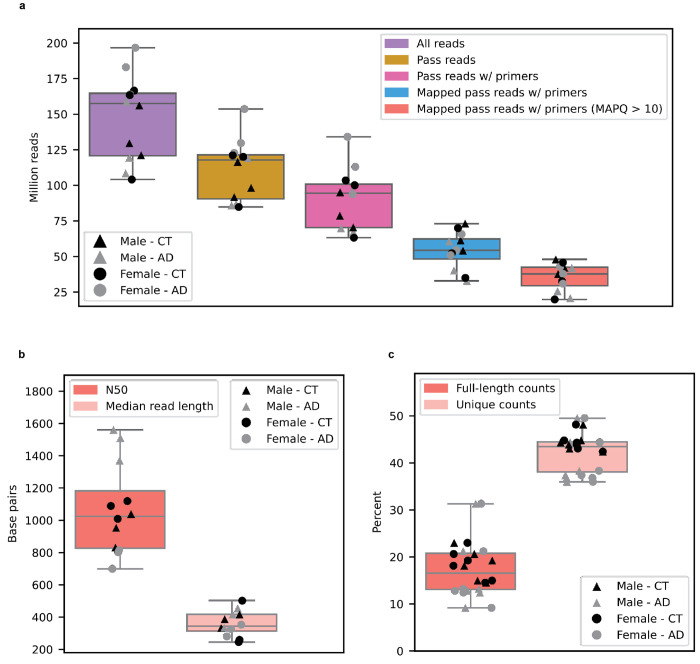
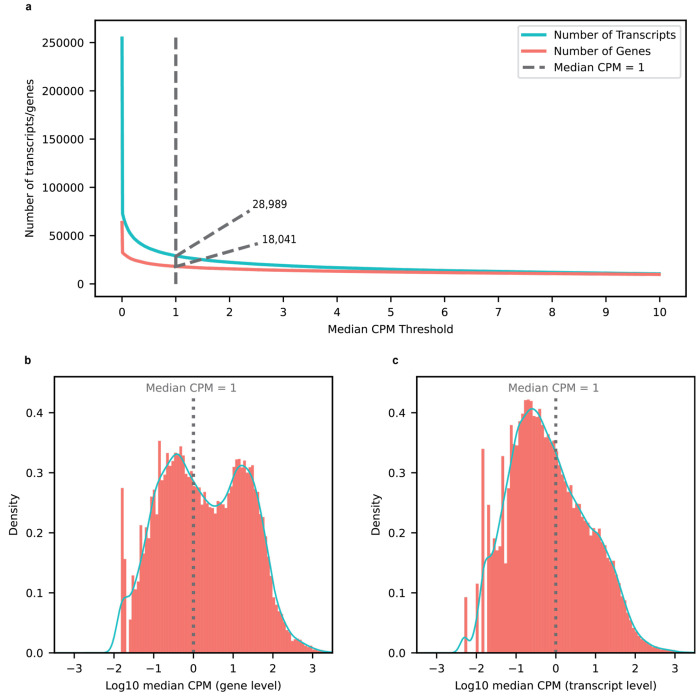
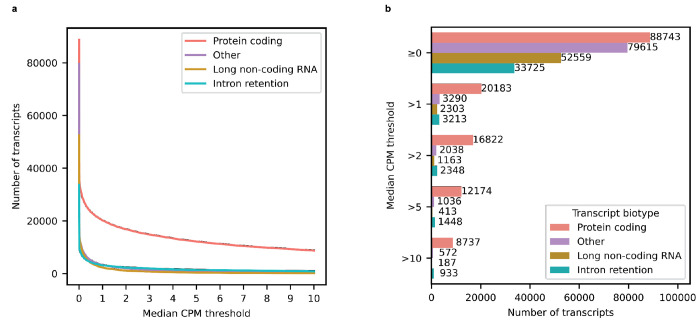
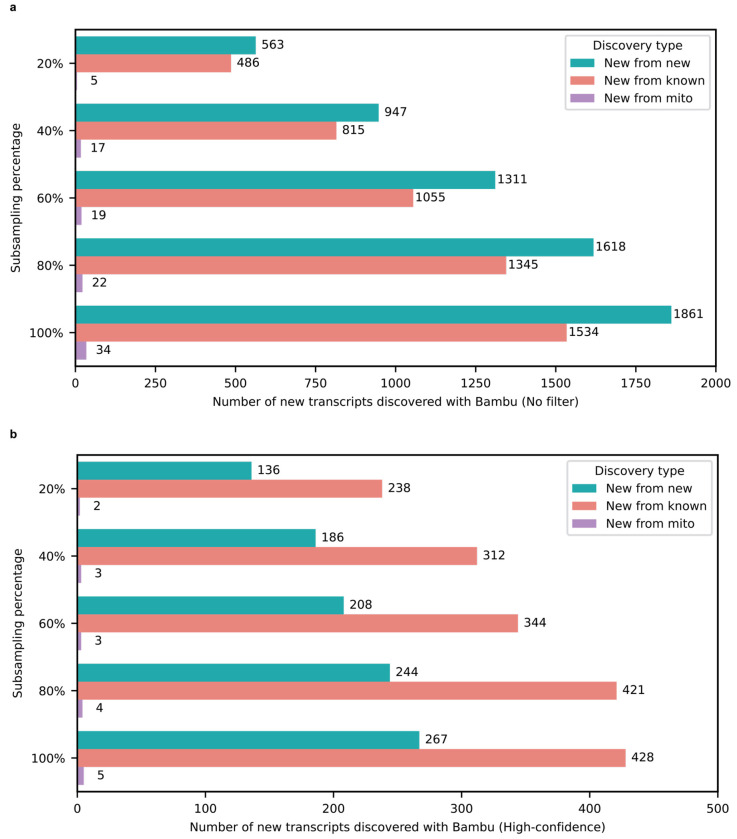
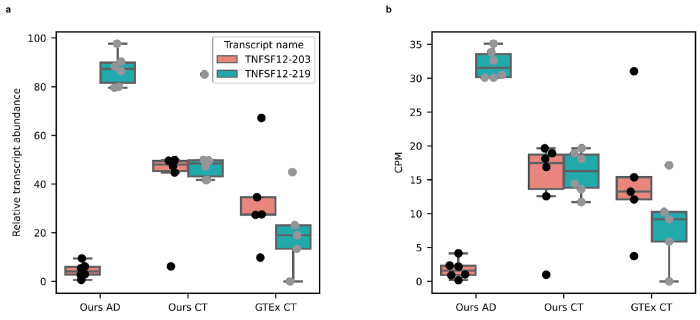
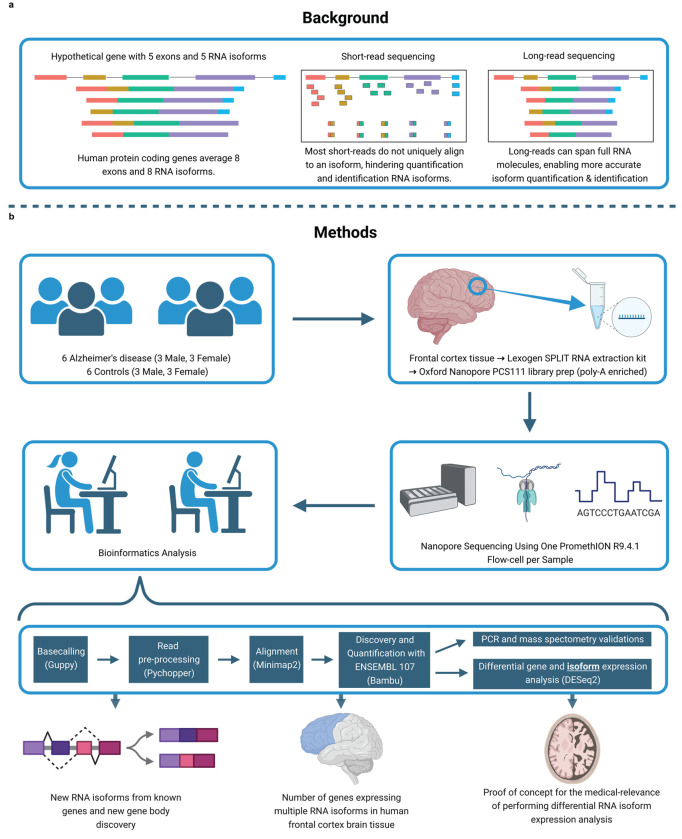
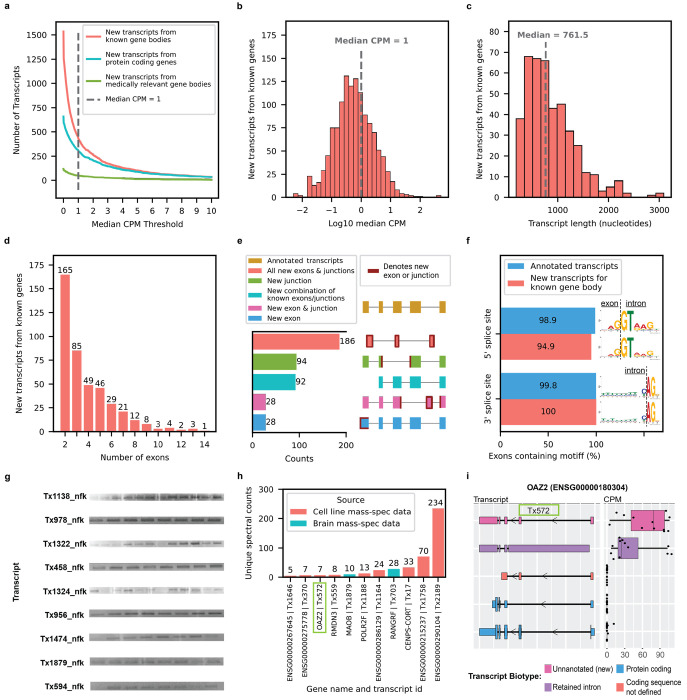
Due to alternative splicing, human protein-coding genes average over eight RNA isoforms, resulting in nearly four distinct protein coding sequences per gene. Long-read RNAseq (IsoSeq) enables more accurate quantification of isoforms, shedding light on their specific roles. To assess the medical relevance of measuring RNA isoform expression, we sequenced 12 aged human frontal cortices (6 Alzheimer's disease cases and 6 controls; 50% female) using one Oxford Nanopore PromethION flow cell per sample. Our study uncovered 53 new high-confidence RNA isoforms in medically relevant genes, including several where the new isoform was one of the most highly expressed for that gene. Specific examples include WDR4 (61%; microcephaly), MYL3 (44%; hypertrophic cardiomyopathy), and MTHFS (25%; major depression, schizophrenia, bipolar disorder). Other notable genes with new high-confidence isoforms include CPLX2 (10%; schizophrenia, epilepsy) and MAOB (9%; targeted for Parkinson's disease treatment). We identified 1,917 medically relevant genes expressing multiple isoforms in human frontal cortex, where 1,018 had multiple isoforms with different protein coding sequences, demonstrating the need to better understand how individual isoforms from a single gene body are involved in human health and disease, if at all. Exactly 98 of the 1,917 genes are implicated in brain-related diseases, including Alzheimer's disease genes such as APP (Aβ precursor protein; five), MAPT (tau protein; four), and BIN1 (eight). As proof of concept, we also found 99 differentially expressed RNA isoforms between Alzheimer's cases and controls, despite the genes themselves not exhibiting differential expression. Our findings highlight the significant knowledge gaps in RNA isoform diversity and their medical relevance. Deep long-read RNA sequencing will be necessary going forward to fully comprehend the medical relevance of individual isoforms for a "single" gene.

Keywords: Alzheimer’s disease; Human brain; Long reads; Medical relevance; Nanopore sequencing; RNA isoforms.


Conflict of interest statement

Competing interests The authors report no competing interests.

Figures

Extended Data Figure 1:
Extended Data Figure 1:. Basic sequencing metrics.
a, Number of reads per sample after each step of the analysis. All downstream analysis were done with Mapped pass reads with both primers an MAPQ > 10. b, N50 and median read length for Mapped pass reads with both primers and MAPQ > 10. c, Percentage of reads that are full-length or unique as determined by bambu. Full-length counts = reads containing all exon-exon boundaries (i.e., intron chain) from its respective transcript. Unique counts = reads that were assigned to a single transcript.
Extended Data Figure 2:
Extended Data Figure 2:. Expression distribution and diversity for genes and transcripts.
a, Number of genes and transcripts represented across median CPM threshold. Cutoff shown as the dotted line set at median CPM = 1. b, Distribution of log10 median CPM values for gene bodies, dotted line shows cutoff point of median CPM = 1. c, Distribution of log10 median CPM values for gene bodies, dotted line shows cutoff point of median CPM = 1.
Extended Data Figure 3:
Extended Data Figure 3:. Expression of different transcript biotypes on aged human frontal cortex tissue using long-read RNAseq data.
a, Lineplot showing the number of transcripts from different biotypes expressed above different median CPM threshold in long-read RNAseq data from aged human dorsolateral frontal cortex postmortem tissue. b, Barplot showing the number of transcripts from different biotypes expressed at or above different median CPM threshold in long-read RNAseq data from aged human dorsolateral frontal cortex postmortem tissue.
Extended Data Figure 4:
Extended Data Figure 4:. Number of newly discovered transcripts across subsampling range.
a, Barplot showing the subsampling percentage on the Y-axis and number of new transcripts discovered with Bambu without filtering by expression estimates (no filter) on the X-axis. b, Barplot showing the subsampling percentage on the Y-axis and number of new transcripts discovered with Bambu when filtering by expression estimates X-axis (high-confidence; median CPM > 1). Nuclear encoded transcripts were filtered by median CPM > 1 and mitochondrially encoded transcripts were filtered by median full-length counts > 40. We used a different filter for mitochondrial transcripts due to issues in read assignment due to the polycistronic nature of mitochondrial transcription.
Extended Data Figure 5:
Extended Data Figure 5:. Difference in transcript discovery overlap based on annotation and computational tool used.
a, Venn diagram showing the overlap between all our new transcripts from known gene bodies and new transcripts from known gene bodies in original GTEx long-read RNAseq article published by Glinos et al. using FLAIR for transcript discovery and ENSEMBL 88 annotation. b, Same as a but showing comparison only for new high-confidence transcripts from known gene bodies in our data. We used 70,000 as the number of new transcripts from known gene bodies in GTEx since they report just over 70,000 novel transcripts for annotated genes in their abstract. c, Venn diagram showing the overlap between all our new transcripts from known gene bodies and new transcripts from known gene bodies found when running GTEx long-read RNAseq data from article published by Glinos et al. using bambu for transcript discovery and ENSEMBL 107 annotation. d, Same as a but showing comparison only for new high-confidence transcripts from known gene bodies in our data. Venn diagrams are not to scale to improve readability.
Extended Data Figure 6.
Extended Data Figure 6.. RT-qPCR validations for new RNA isoforms from MAOB, SLC26A1, MT-RNR2 RNA isoforms match long-read sequencing data.
a, Comparison of relative abundance between long-read sequencing and RT-qPCR for RNA isoforms in MAOB. b, Same as a, but for MT-RNR2 c, Same as a, but for SLC26A1. Relative abundance was calculated as RelativeAbundance=ExpressionestimateforagivenRNAisoform(ExpressionestimatesforRNAisoformfromthegivengene)100 We used CPM (Counts Per Million) as the expression estimate for long-read sequencing and 2^(−ΔCt) for RT-qPCR. We used 2−ΔCt as the expression estimate instead of the more common 2−ΔΔCt. This is because the 2−ΔΔCt is optimized for comparisons between samples within the same gene/isoform, but does not work well for comparison between genes/isoforms. On the other hand, the 2−ΔCt expression estimate allows for comparison between different genes/isoforms. The housekeeping gene for RT-qPCR was CYC1.
Extended Data Figure 7:
Extended Data Figure 7:. External validation of new high-confidence transcripts using publicly availabla data from 5 GTEx brain samples (Brodmann area 9) sequenced with long-read RNAseq and 251 ROSMAP brain samples (Brodmann area 9/46) sequenced with Illumina 150bp paired-end RNAseq reads.
a, Histogram showing total unique counts for new high-confidence transcripts across five GTEx long-read RNAseq data from brain samples. Total unique counts are shown in a log2(total unique counts + 1) scale to avoid streching generated by outliers. b, Barplot showing the number of new high-confidence transcripts that meet different total unique counts thresholds in cross-validation using five GTEx long-read RNAseq data from brain samples. The “≥ 0” Y-axis label shows the total number of high-confidence transcripts before any filtering. Legend colors: New from known denotes new transcripts from known gene bodies, New from new denotes new transcripts from newly discovered gene bodies, and new from mito denotes new mitochondrially encoded spliced transcripts. c, Same as a but for 251 ROSMAP brain samples sequenced with 150bp paired-end Illumina RNAseq. d, Same as b but for 251 ROSMAP brain samples sequenced with 150bp paired-end Illumina RNAseq. We observed that 98.8% of the new high-confidence transcripts from known gene bodies had at least one uniquely mapped read in either GTEx or ROSMAP data and 69.6% had at least 100 uniquely mapped reads in either dataset.
Extended Data Figure 8:
Extended Data Figure 8:. Expression of 197 transcripts from extra 99 predicted protein coding genes in CHM13 reported by Nurk et al.
a, Lineplot with number of transcripts from extra 99 protein coding genes that are expressed across the total counts threshold for our 12 brain samples. The red line indicates all counts (including partial assignments), mint green line indicates full-length reads and purple line indicates unique reads. b, Barplot showing the number of transcripts from extra 99 protein coding genes expressed at or above different total counts thresholds. The top y-axis label shows all the 197 annotated RNA isoforms from the extra 99 predicted protein coding genes in CHM13 reported by Nurk et al.
Extended Data Figure 9:
Extended Data Figure 9:. Attempt at validation of TNFSF12 RNA isoform expression pattern in healthy controls.
a, Boxplot showing the relative transcript abudance (percentage) for TNFSF12 RNA isoforms that are differentially expressed between Alzheimer’s disease cases and controls in this study. On the X-axis, the “OURS AD” and “OURS CT” labels represents the six Alzheimer’s disease and six control brain samples sequenced in this study. The “GTEx CT” label represents the 5 GTEx brain samples (Brodmann area 9) sequences with PCR amplified long-read nanopore RNAseq. b, Boxplot showing the CPM for TNFSF12 RNA isoforms that are differentially expressed between Alzheimer’s disease cases and controls in this study. X-axis labels follow the same pattern as a.
Extended Data Figure 10:
Extended Data Figure 10:. Percentage of unique and full-length reads per transcript.
a, Scatterplot showing the percentage of uniquely aligned reads for each transcript with a median CPM > 1 on the X-axis and the Log10 transcript length on the Y axis. b, Scatterplot showing the percentage of full-length reads for each transcript with a median CPM > 1 on the X-axis and the Log10 transcript length on the Y axis. c, Violin plot showing the percentage of uniquely aligned reads for each transcript with median CPM > 1 on the Y-axis and the number of annotated transcript per gene on the X-axis. d, Violin plot showing the percentage of full-length reads for each transcript with median CPM > 1 on the Y-axis and the number of annotated transcript per gene on the X-axis.
Fig. 1:
Fig. 1:. Study design and rationale.
a, Background explaining the improvements long-read sequencing brings to the study of RNA isoforms. b, Details for experimental design, methods, and a summary of the topics explored in this article. Created with BioRender.com.
Fig. 2:
Fig. 2:. New high-confidence RNA isoforms and new spliced mitochondrial RNA isoforms expressed in human frontal cortex.
Figures a-f refer to new transcripts from annotated gene bodies. a, Number of newly discovered transcripts across median CPM threshold. Cutoff shown as the dotted line set at median CPM = 1. b, Distribution of log10 median CPM values for newly discovered transcripts from annotated gene bodies, dotted line shows cutoff point of median CPM = 1. Figures c-f only include data from transcripts above this expression cutoff. c, Histogram showing distribution of transcripts length for new transcripts from annotated gene bodies. d, Bar plot showing the distribution of the number of exons for newly discovered transcripts from annotated gene bodies. e, Bar plot showing the kinds of events that gave rise to new transcripts from annotated gene bodies. For context, bambu considers modified exons (e.g., significantly longer or shorter) as new exons, including lengthened UTR regions. f, Bar plot showing the prevalence of canonical splice site motifs for annotated exons from transcripts with median CPM > 1 versus new exons from new transcripts in annotated gene bodies. g, Gel electrophoresis validation using PCR amplification for a subset of new RNA isoforms from known genes. This is an aggregate figure showing bands for several different gels. Individual gel figures are available in Supplementary Figures 1–26. h, Protein level validation using publicly available mass spectrometry proteomics data. Y-axis shows number of spectral counts from uniquely matching peptides (unique spectral counts); new transcripts from known gene bodies were considered validated at the protein level if they had more than 5 unique spectral counts. BambuTx1879, BambuTx1758, BambuTx2189 are unique to our study. i, RNA isoform structure and CPM expression for isoforms from OAZ2 (cellular growth/proliferation). The new isoform Tx572 was most expressed and validated at the protein level (highlighted with the green box).
Fig. 3:
Fig. 3:. Medically relevant genes with new high-confidence RNA isoforms expressed in human frontal cortex.
a, Gene names for medically relevant genes where we discovered a new RNA isoform that was not annotated in Ensembl version 107. Only included new RNA isoforms with a median CPM > 1. The size of gene name is proportional to relative abundance of the new RNA isoform. Relative abundance values relevant to this figure can be found in Supplementary Fig. 30. b–d, RNA isoform structure and CPM expression for isoforms from TREM2, MAOB, and POLB. For TREM2 and MAOB all isoforms are shown (4 each). For POLB only the top 5 most highly expressed isoforms in human frontal cortex are shown. Figures e-g refer to new spliced mitochondrial transcripts, we only included new mitochondrial transcripts with median full-length counts > 40. e, Structure for new spliced mitochondrial transcripts in red/coral denoted by “Tx”, MT-RNR2 ribosomal RNA represented in green (overlapping 4 out of 5 spliced mitochondrial isoforms) and known protein coding transcripts in blue. f, Bar plot showing number of full-length counts (log10) for new spliced mitochondrial transcripts and known protein coding transcripts. g, Bar plot showing the prevalence of canonical splice site motifs for annotated exons from nuclear transcripts with median CPM > 1 versus new exon from spliced mitochondrial transcripts.
Fig. 4:
Fig. 4:. New high-confidence gene bodies in human frontal cortex tissue.
a, Number of newly discovered transcripts from new gene bodies represented across median CPM threshold. Cutoff shown as the dotted line set at median CPM = 1. b, Distribution of log10 median CPM values for new transcripts from new gene bodies, dotted line shows cutoff point of median CPM = 1. Figures c-g only include data from transcripts above this expression cutoff. c, Histogram showing length distribution for new transcripts from new gene bodies. d, Bar plot showing the distribution of the number of exons for new transcripts from new gene bodies. Given the large proportion transcripts containing only two exons, it is possible that we only sequenced a fragment of larger RNA molecules. e, Bar plot showing the kinds of events that gave rise to new transcripts from new gene bodies. f, Bar plot showing the prevalence of canonical splice site motifs for annotated exons from transcripts with median CPM > 1 versus new exons from new gene bodies. g, RNA isoform structure and CPM expression for isoforms from new gene body (BambuGene290099). h, Gel electrophoresis validation using PCR amplification for a subset of new isoforms from new genes. This is an aggregate figure showing bands for several different gels. Individual gel figures are available in Supplementary Figures 5–26. i, Protein level validation using publicly available mass spectrometry proteomics data. Y-axis shows number of spectral counts from uniquely matching peptides (unique spectral counts); new transcripts from new genes were considered validated at the protein level if they had more than 5 unique spectral counts.
Fig. 5:
Fig. 5:. Gene bodies expressing multiple transcripts in human frontal cortex tissue.
a, Gene bodies with multiple transcripts across median CPM threshold. Dotted line is at median CPM = 1, figures b-g2 only include gene bodies with multiple transcripts at median CPM > 1. b, Gene bodies expressing multiple transcripts. c, Medically relevant gene bodies expressing multiple transcripts. d, Brain disease relevant gene bodies expressing multiple transcripts. e1, Transcripts expressed in frontal cortex for a subset of genes implicated in Alzheimer’s disease. AD: Alzheimer’s disease. ALS/FTD: Amyotrophic lateral sclerosis and frontotemporal dementia. PD: Parkinson’s disease. e2, APP transcript expression. e3, MAPT transcript expression. e4, BIN1 transcript expression. f1, Same as e1 but for a subset of genes implicated in other neurodegenerative diseases. LATE: Limbic-predominant age-related TDP-43 encephalopathy. f2, TARDBP transcript expression. g1, Same as e1 but for a subset of genes implicated in neuropsychiatric disorders. g2, SHANK3 transcript expression.
Fig. 6:
Fig. 6:. RNA isoform analysis can reveal disease expression patterns unavailable at gene level.
a, Differential gene expression between Alzheimer’s disease cases and cognitively unimpaired controls. The horizontal line is at FDR corrected p-value (q-value) = 0.05. Vertical lines are at Log2 fold change = −1 and +1. The threshold for differential gene expression was set at q-value < 0.05 and |Log2 fold change| > 1. Names displayed represent a subset of genes that are not differentially expressed but have at least one RNA isoform that is differentially expressed. b, Same as a but for differential RNA isoform expression analysis. NEDD9-202, NAPB-203, and S100A13-205 are examples of protein coding RNA isoforms that were differentially expressed even though the gene was not. c, Expression for TNFSF12 between Alzheimer’s disease cases and controls. The TNFSF12 gene does not meet the differential expression threshold. d, TNFSF12-219 transcript expression between cases and controls; TNFSF12-219 is upregulated in cases. e, Expression for the TNFSF12-203 transcript between cases and controls; TNFSF12-203 is upregulated in controls. These differentially expressed TNFSF12 RNA isoforms are not thought to be protein coding, but understanding why cells actively transcribe non-coding RNAs remains an important question in biology. Definition of boxplot elements: center line, median; box limits, upper and lower quartiles; whiskers, 1.5x interquartile range.

References

    1. Park E., Pan Z., Zhang Z., Lin L. & Xing Y. The Expanding Landscape of Alternative Splicing Variation in Human Populations. Am. J. Hum. Genet. 102, 11–26 (2018). - PMC - PubMed
    1. Martin F. J. et al. Ensembl 2023. Nucleic Acids Res. 51, D933–D941 (2023). - PMC - PubMed
    1. Yang X. et al. Widespread Expansion of Protein Interaction Capabilities by Alternative Splicing. Cell 164, 805–817 (2016). - PMC - PubMed
    1. Oberwinkler J., Lis A., Giehl K. M., Flockerzi V. & Philipp S. E. Alternative splicing switches the divalent cation selectivity of TRPM3 channels. J. Biol. Chem. 280, 22540–22548 (2005). - PubMed
    1. Végran F. et al. Overexpression of caspase-3s splice variant in locally advanced breast carcinoma is associated with poor response to neoadjuvant chemotherapy. Clin. Cancer Res. Off. J. Am. Assoc. Cancer Res. 12, 5794–5800 (2006). - PubMed

Publication types