This is a preprint.
Gas tunnel engineering of prolyl hydroxylase reprograms hypoxia signaling in cells
- PMID: 37609209
- PMCID: PMC10441328
- DOI: 10.1101/2023.08.07.552357
Gas tunnel engineering of prolyl hydroxylase reprograms hypoxia signaling in cells
Update in
-
Gas Tunnel Engineering of Prolyl Hydroxylase Reprograms Hypoxia Signaling in Cells.Angew Chem Int Ed Engl. 2024 Nov 25;63(48):e202409234. doi: 10.1002/anie.202409234. Epub 2024 Oct 21. Angew Chem Int Ed Engl. 2024. PMID: 39168829
Abstract
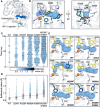
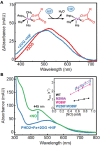
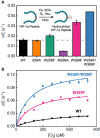
Cells have evolved intricate mechanisms for recognizing and responding to changes in oxygen (O2) concentrations. Here, we have reprogrammed cellular hypoxia (low O2) signaling via gas tunnel engineering of prolyl hydroxylase 2 (PHD2), a non-heme iron dependent O2 sensor. Using computational modeling and protein engineering techniques, we identify a gas tunnel and critical residues therein that limit the flow of O2 to PHD2's catalytic core. We show that systematic modification of these residues can open the constriction topology of PHD2's gas tunnel. Using kinetic stopped-flow measurements with NO as a surrogate diatomic gas, we demonstrate up to 3.5-fold enhancement in its association rate to the iron center of tunnel-engineered mutants. Our most effectively designed mutant displays 9-fold enhanced catalytic efficiency (kcat/KM = 830 ± 40 M-1 s-1) in hydroxylating a peptide mimic of hypoxia inducible transcription factor HIF-1α, as compared to WT PHD2 (kcat/KM = 90 ± 9 M-1 s-1). Furthermore, transfection of plasmids that express designed PHD2 mutants in HEK-293T mammalian cells reveal significant reduction of HIF-1α and downstream hypoxia response transcripts under hypoxic conditions of 1% O2. Overall, these studies highlight activation of PHD2 as a new pathway to reprogram hypoxia responses and HIF signaling in cells.
Keywords: cellular signaling; gas tunnels; non-heme iron; oxygen sensing; protein design.
Figures


Similar articles
-
Gas Tunnel Engineering of Prolyl Hydroxylase Reprograms Hypoxia Signaling in Cells.Angew Chem Int Ed Engl. 2024 Nov 25;63(48):e202409234. doi: 10.1002/anie.202409234. Epub 2024 Oct 21. Angew Chem Int Ed Engl. 2024. PMID: 39168829
-
Substrate preference of the HIF-prolyl hydroxylase-2 (PHD2) and substrate-induced conformational change.J Inorg Biochem. 2013 Sep;126:55-60. doi: 10.1016/j.jinorgbio.2013.05.006. Epub 2013 May 21. J Inorg Biochem. 2013. PMID: 23787140 Free PMC article.
-
Prolyl hydroxylase domain 2 protein suppresses hypoxia-induced endothelial cell proliferation.Hypertension. 2007 Jan;49(1):178-84. doi: 10.1161/01.HYP.0000251360.40838.0f. Epub 2006 Nov 13. Hypertension. 2007. PMID: 17101841
-
Role of prolyl hydroxylase domain proteins in bone metabolism.Osteoporos Sarcopenia. 2022 Mar;8(1):1-10. doi: 10.1016/j.afos.2022.03.001. Epub 2022 Mar 22. Osteoporos Sarcopenia. 2022. PMID: 35415275 Free PMC article. Review.
-
Application of in-vitro screening methods on hypoxia inducible factor prolyl hydroxylase inhibitors.Bioorg Med Chem. 2017 Aug 1;25(15):3891-3899. doi: 10.1016/j.bmc.2017.05.026. Epub 2017 May 13. Bioorg Med Chem. 2017. PMID: 28625716 Review.
References
-
- Hoque N. J., Weinert E. E., Curr. Opin. Microbiol. 2023, 76, 102396. - PubMed
Publication types
Grants and funding
LinkOut - more resources
Full Text Sources
Miscellaneous
