[Preprint]. 2023 Aug 9:2023.08.08.552428.
doi: 10.1101/2023.08.08.552428.

PHOSPHORYLATION-DEPENDENT ASSOCIATION OF WRN WITH RPA IS REQUIRED FOR RECOVERY OF REPLICATION FORKS STALLED AT SECONDARY DNA STRUCTURES

Affiliations

PHOSPHORYLATION-DEPENDENT ASSOCIATION OF WRN WITH RPA IS REQUIRED FOR RECOVERY OF REPLICATION FORKS STALLED AT SECONDARY DNA STRUCTURES

Alessandro Noto et al. bioRxiv. .

Update in

Abstract

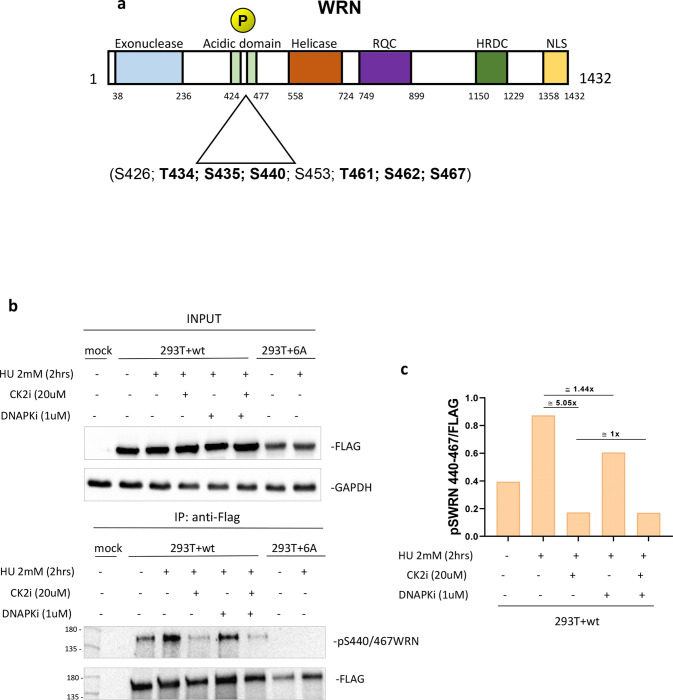
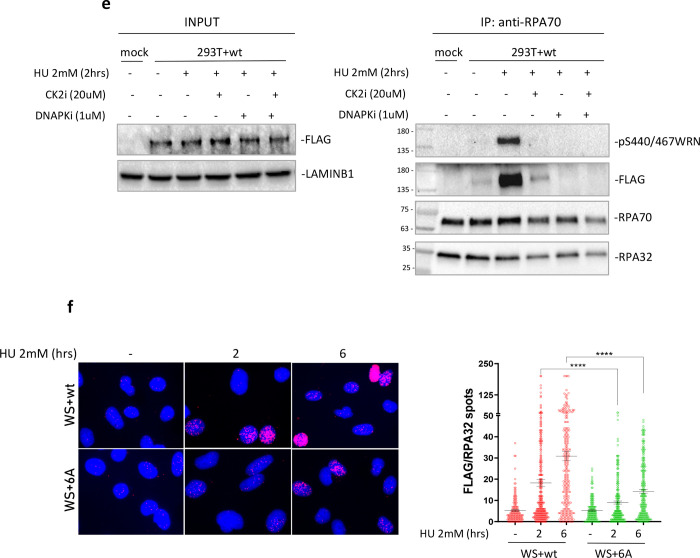
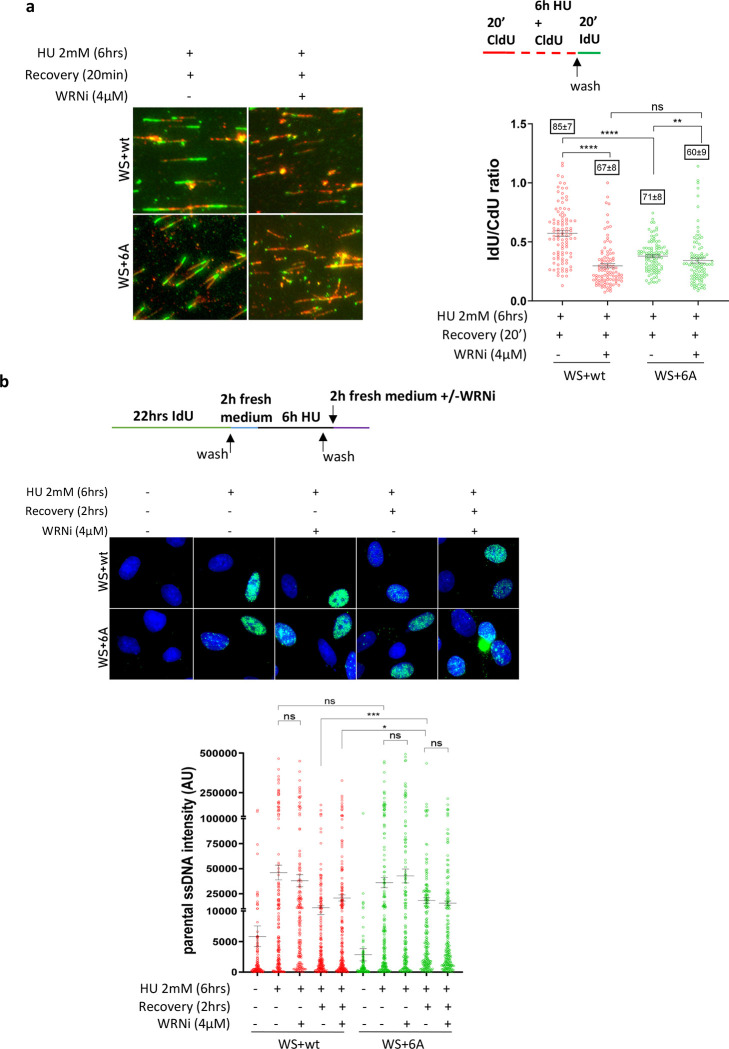
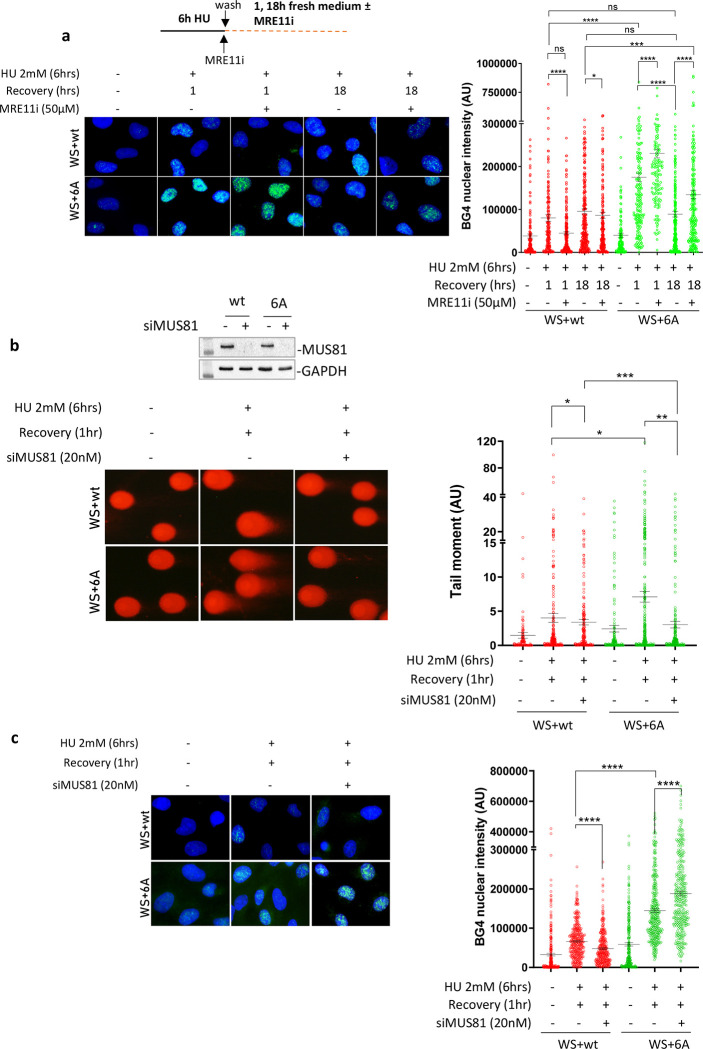
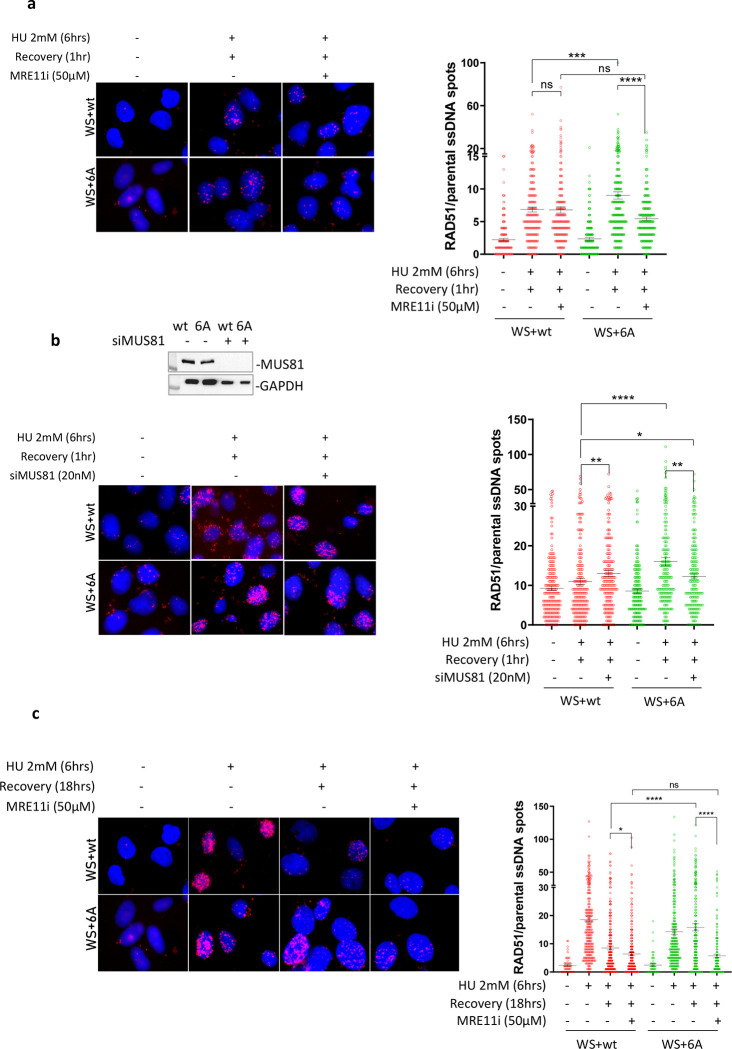
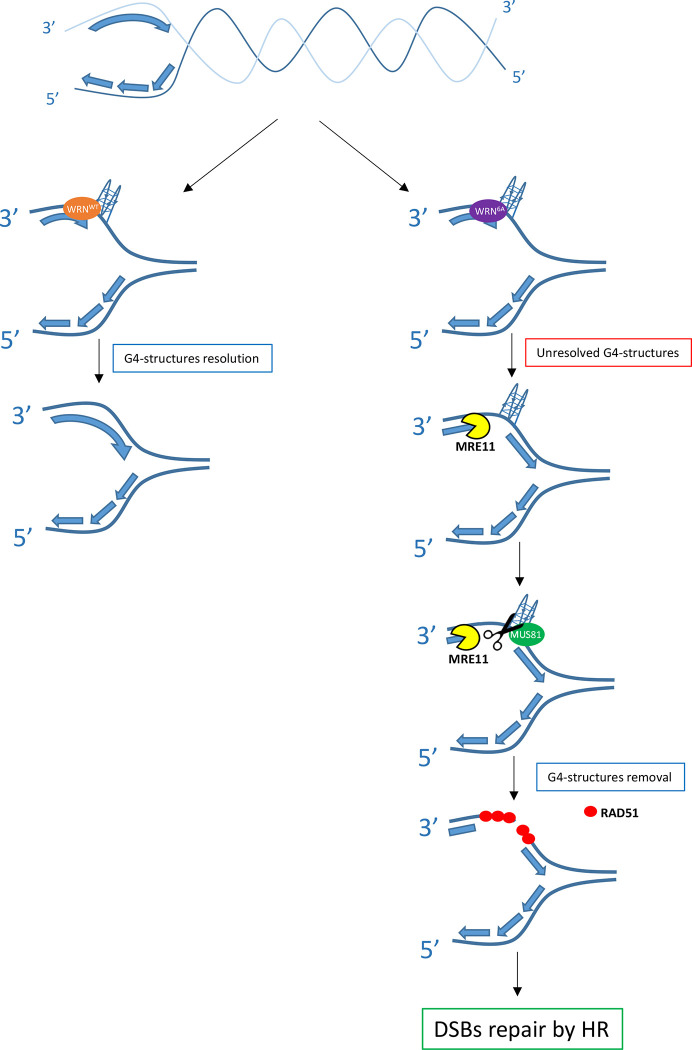
The WRN protein mutated in the hereditary premature aging disorder Werner syndrome plays a vital role in handling, processing, and restoring perturbed replication forks. One of its most abundant partners, Replication Protein A (RPA), has been shown to robustly enhance WRN helicase activity in specific cases when tested in vitro. However, the significance of RPA-binding to WRN at replication forks in vivo has remained largely unexplored. In this study, we have identified several conserved phosphorylation sites in the acidic domain of WRN that are targeted by Casein Kinase 2 (CK2). Surprisingly, these phosphorylation sites are essential for the interaction between WRN and RPA, both in vitro and in human cells. By characterizing a CK2-unphosphorylatable WRN mutant that lacks the ability to bind RPA, we have determined that the WRN-RPA complex plays a critical role in fork recovery after replication stress whereas the WRN-RPA interaction is not necessary for the processing of replication forks or preventing DNA damage when forks stall or collapse. When WRN fails to bind RPA, fork recovery is impaired, leading to the accumulation of single-stranded DNA gaps in the parental strands, which are further enlarged by the structure-specific nuclease MRE11. Notably, RPA-binding by WRN and its helicase activity are crucial for countering the persistence of G4 structures after fork stalling. Therefore, our findings reveal for the first time a novel role for the WRN-RPA interaction to facilitate fork restart, thereby minimizing G4 accumulation at single-stranded DNA gaps and suppressing accumulation of unreplicated regions that may lead to MUS81-dependent double-strand breaks requiring efficient repair by RAD51 to prevent excessive DNA damage.

Keywords: Genome Instability; RecQ helicases; Replication fork arrest; Werner syndrome.


Conflict of interest statement

CONFLICT OF INTEREST The authors declare to do not have any conflict of interest.

Figures

Fig. 1.
Fig. 1.. The acidic domain of WRN is phosphorylated by CK2.
A) Schematic representation of WRN protein and domains. Mutation of six putative CK2 phosphorylation sites in the WRN acidic domain are highlighted. B) Anti-Flag-immunoprecipitates from HEK293T cells transfected with Flag-WRN or Flag-WRN6A constructs. Cells were treated as indicated 48h after transfection. C) Quantification of WRN S440–467 phosphorylation sites and effect of CK2 or DNA-PK inhibition.
Fig. 2.
Fig. 2.. Phosphorylation of the acidic domain of WRN by CK2 drives association with RPA.
A) Ponceau staining of GST-pulldowns with HEK293T nuclear extracts and GST-tagged WRN fragment 403–503 (WRNwt and WRN6D) previously phosphorylated by CK2 in the presence or not of ATP. B) Western Blotting analysis of WRN S440/467 phosphorylation and RPA32 subunit from GST-pulldowns. The graph shows the levels of S440/467 phosphorylation and RPA32 bound to GST-tagged WRN fragments. C) Anti-Flag-immunoprecipitation from HEK293T cells transfected with Flag-WRN or Flag-WRN6A constructs. The graph shows the quantification of the WRN-normalised amount of RPA70 in the anti-Flag immunoprecipitate from the representative experiment. D) Anti-RPA70 immunoprecipitatation from HEK293T cells transfected with Flag-WRN or Flag-WRN6A constructs. The fraction of pS440/467 phosphorylated WRN associated with RPA was analysed using the anti-pS440/467WRN antibody. The graph shows the quantification of the RPA70-normalised amount of WRN in the anti-RPA70 immunoprecipitate from the representative experiment. E) Anti-RPA70 immunoprecipitation from HEK293T cells transfected with Flag-WRNwt construct. Cells were treated with HU 2mM for 2h in the presence or not of the indicated inhibitors. F) WRN/RPA32 interaction was detected in Werner Syndrome (WS) cells nucleofected with Flag-WRNwt or Flag-WRN6A by in situ Proximity Ligation Assay using anti-FLAG and RPA32 antibodies. The graphs show individual values of PLA spots. Representative images are shown. Bars represent mean ± S.E. (*P<0.05; **P< 0.01; ***P< 0.001; ****P< 0.0001. Where not indicated, values are not significant).
Fig. 3.
Fig. 3.. Interaction of WRN with RPA is not required for end-resection at blocked or collapsed replication forks or to prevent DSBs formation during replication stress.
A) Detection of nascent ssDNA by immunofluorescence in WRNwt and WRN6A nucleofected WS cells treated as in the scheme. The graph shows individual values of IdU foci intensity (n=3). Bars represent mean ± S.E. (ns = not significant). Representative images are shown in the panel. B) Analysis of IdU/CdU ratio using DNA fiber assay (experimental scheme on top). The graph shows the individual IdU/CdU ratio values from duplicate experiments. Bars represent mean ± S.E. (ns = not significant; ****P< 0.0001.) Representative images of DNA fibers from random field are shown in the panel. C) Analysis of DSBs by neutral Comet assay. WRNwt and WRN6A nucleofected WS cells were treated as indicated. The graph shows individual tail moment values from two independent experiments. Bars represent mean ± S.E. (ns = not significant). D) Analysis of recruitment in chromatin of WRN and RAD51. Chromatin fractions were analysed by Western Blot. Input represents 1/40 of the chromatin fractionated lysate. The graph shows the quantification of the RAD51 amount in chromatin, normalised against LAMINB1 from the representative experiment. E) Analysis of end-resection by native IdU/ssDNA assay. WRNwt and WRN6A nucleofected WS cells were treated as indicated. Graph shows the quantification of total IdU intensity in 300 nuclei from three-independent experiments. Bars represent mean ± S.E. (ns = not significant; *P<0.05).
Fig. 4.
Fig. 4.. RPA-binding is required for WRN to restart replication fork and recover from replication arrest.
A) Analysis of fork restart in IdU/CdU-labelled fibers from WRNwt and WRN6A expressing cells (Experimental scheme on top). The graph shows the individual IdU/CdU ratio values from duplicated experiments. Bars represent mean ± S.E. Representative images are shown. B) Analysis of parental ssDNA exposure in WRNwt and WRN6A expressing WS cells treated as indicated in the experimental scheme. The graph shows quantification of total IdU intensity for each nucleus from three independent experiments. Bars represent mean ± S.E. Representative images of native anti-IdU immunofluorescence are shown. (ns = not significant; *P<0.05; **P< 0.01; ***P< 0.001; ****P< 0.0001).
Fig. 5
Fig. 5. RPA-binding collaborates with WRN helicase activity of to promote replication recovery.
A) Analysis of replication fork recovery from IdU/CdU-labelled DNA fibers as indicated in the experimental scheme in WS cells expressing Flag-WRNwt or Flag-WRN6A. The graph shows the individual values of IdU/CdU ratio in isolated fibers from two independent replicates. Bars represent mean ± S.E. Representative images are shown. Numbers in the boxes above each dot plot are the % of restarting forks (mean ± S.E). B) Analysis of parental ssDNA exposure in WRNwt and WRN6A expressing WS cells treated as indicated. The graph shows quantification of total IdU intensity of each nucleus from three independent experiments. Bars represent mean ± S.E. Representative images are shown in the panel. C) Helicase activity of CK2-phosphorylated WRN. Helicase reactions containing 1.25, 2.5, 5 nM of untreated, LPP dephosphorylated, and LPP dephosphorylated-CK2 phosphorylated WRN were incubated with 25 bp forked DNA duplex substrate. D) Helicase activity of CK2-phosphorylated WRN in the presence of purified RPA heterotrimer. Fork substrate (15 nt arms, 34 bp duplex). ▲ denotes heat-denatured substrates. E) Analysis of G4 detection by an anti-DNA G-quadruplex structures antibody (clone BG4) in WRNwt and WRN6A expressing WS cells. The graph shows quantification of total BG4 nuclear staining for each nucleus from duplicate independent experiments. Bars represent mean ± S.E. F) Analysis of G4 detection by an anti-DNA G-quadruplex structures antibody (clone BG4) in WRNwt and WRN6A expressing cells during recovery. The graph shows quantification of total BG4 nuclear staining for each nucleus from duplicate independent experiments. Bars represent mean ± S.E. (ns = not significant; *P<0.05; **P< 0.01; ***P< 0.001;****P< 0.0001).
Fig. 6.
Fig. 6.. MRE11-dependent gaps and MUS81-dependent DSBs contribute to G4 clearance in cells that are defective for RPA binding to WRN.
A) Analysis of G4s accumulation evaluated by anti-BG4 immunofluorescence in WRNwt and WRN6A nucleofected WS cells treated with HU and recovered in the presence or absence of the MRE11 exonuclease inhibitor Mirin (MRE11i). The graph shows the individual values of BG4 nuclear intensity. Bars represent mean ± S.E. (ns = not significant; *P<0.05; ***P< 0.001; ****P< 0.0001. Where not indicated, values are not significant). B) Analysis of DSBs by neutral Comet assay. WRNwt and WRN6A nucleofected WS cells were transfected with CTRL or MUS81 siRNA and 48h after treated with HU and recovered for 1 hour. WB shows the downregulation of MUS81. The graph shows individual tail moment values from duplicated experiments. Bars represent mean ± S.E. Statistical analyses were performed by Student’s t-test (*P<0.05; **P<0.01; ***P< 0.001. Where not indicated, values are not significant). C) G4s accumulation was detected by anti-BG4 immunofluorescence. Cells expressing the wild-type and mutant WRN were transfected with CTRL or MUS81 siRNA and, 48h after, they were treated with HU and recovered for 1 hour. The graph shows the individual values of BG4 foci nuclear intensity. Bars represent mean ± S.E. (****P< 0.001. Where not indicated, values are not significant).
Fig. 7.
Fig. 7.. RAD51 suppresses DSBs formed at G4 sites in the absence of WRN-RPA binding.
A) In Situ Proximity Ligation Assay between RAD51 and parental ssDNA. WS cells nucleofected with Flag-WRNwt or Flag-WRN6A were treated with HU and recovered for 1 hour in the presence or absence of the MRE11i Mirin. The graphs show individual values of PLA spots (n=2). Representative images are shown. Bars represent mean ± S.E. (ns = not significant; ***P<0.001; ****P< 0.0001. Where not indicated, values are not significant). B) In Situ Proximity Ligation Assay between RAD51 and parental ssDNA. WS cells nucleofected with Flag-WRNwt or Flag-WRN6A were transfected with CTRL or siMUS81 siRNA and treated 48h after with HU followed by recovery for 1 hour. WB shows the downregulation of MUS81. The graphs show individual values of PLA spots (n=2). Representative images are shown. Bars represent mean ± S.E. (ns = not significant; *P<0.05; **P<0.01; ****P< 0.0001. Where not indicated, values are not significant). C) In Situ Proximity Ligation Assay between RAD51 and parental ssDNA. WS cells nucleofected with Flag-WRNwt or Flag-WRN6A were treated with HU and recovered for 18 hours in the presence or absence of the MRE11i Mirin. The graphs show individual values of PLA spots (n=2). Representative images are shown. Bars represent mean ± S.E. (ns = not significant; *P<0.05; ****P< 0.0001). D) Neutral Comet assay for DSBs evaluation in WRNwt and WRN6A nucleofected cells during recovery from HU (see experimental scheme). The graph shows individual tail moment values (n=2). Bars represent mean ± S.E. Statistical analyses were performed by Student’s t-test (*P<0.05; **P< 0.01; ****P< 0.0001. Where not indicated, values are not significant). E) Analysis of anti-γ-H2AX immunofluorescence during recovery from HU (see experimental scheme). The graph shows the individual values of γ-H2AX foci intensity (n=2). Bars represent mean ± S.E. Statistical analyses were performed by ANOVA (ns = not significant; *P<0.05; **P< 0.01; ***P< 0.001; ****P< 0.0001). F) Analysis of DSBs by neutral Comet assay. WS cells nucleofected with Flag-WRN6A were transfected with CTRL or siMUS81 oligos and treated 48h thereafter with HU as indicated in the scheme. The graph shows individual tail moment values (n=2). Bars represent mean ± S.E. Statistical analyses were performed by Student’s t-test (*P<0.05; ***P< 0.001. ****P<0.0001).
Fig. 8.
Fig. 8.. Model of G4s removal when the WRN-RPA interaction is defective.
Replication fork stalling occurring near secondary-prone DNA structures, such as guanine-rich regions, can stimulate formation of secondary DNA structures like G4, as depicted. For sake of simplicity, the G4 has been sketched only in the leading strand. These DNA structures require multiple proteins for their resolution, including WRN together with its partner RPA. When WRN cannot properly bind to RPA, these structures persist, and replication is restored downstream leaving a gap in the template. During replication recovery, these gaps are processed by MRE11-exo allowing the MUS81 endonuclease to induce a DSB followed by post-replication repair by RAD51 and “removal” of the secondary DNA structure such as G4s.

References

    1. Franchitto A., Pichierri P., Understanding the molecular basis of common fragile sites instability: Role of the proteins involved in the recovery of stalled replication forks. Cell Cycle. 10, 4039–4046 (2011). - PubMed
    1. Brosh R. M., V. a. Bohr, Human premature aging, DNA repair and RecQ helicases. Nucleic Acids Research. 35, 7527–7544 (2007). - PMC - PubMed
    1. Oshima J., Sidorova J. M., Monnat R. J., Werner syndrome: Clinical features, pathogenesis and potential therapeutic interventions. Ageing Res Rev. 33, 105–114 (2017). - PMC - PubMed
    1. Croteau D. L., Popuri V., Opresko P. L., Bohr V. A., Human RecQ helicases in DNA repair, recombination, and replication. Annu Rev Biochem. 83, 519–552 (2014). - PMC - PubMed
    1. Rossi M. L., Ghosh A. K., a Bohr V., Roles of Werner syndrome protein in protection of genome integrity. DNA repair. 9, 331–44 (2010). - PMC - PubMed

Publication types