[Preprint]. 2023 Sep 19:2023.08.07.552354.
doi: 10.1101/2023.08.07.552354.

The actin binding protein profilin 1 is critical for mitochondria function

Affiliations

The actin binding protein profilin 1 is critical for mitochondria function

Tracy-Ann Read et al. bioRxiv. .

Update in

Abstract

Profilin 1 (PFN1) is an actin binding protein that is vital for the polymerization of monomeric actin into filaments. Here we screened knockout cells for novel functions of PFN1 and discovered that mitophagy, a type of selective autophagy that removes defective or damaged mitochondria from the cell, was significantly upregulated in the absence of PFN1. Despite successful autophagosome formation and fusion with the lysosome, and activation of additional mitochondrial quality control pathways, PFN1 knockout cells still accumulate damaged, dysfunctional mitochondria. Subsequent imaging and functional assays showed that loss of PFN1 significantly affects mitochondria morphology, dynamics, and respiration. Further experiments revealed that PFN1 is located to the mitochondria matrix and is likely regulating mitochondria function from within rather than through polymerizing actin at the mitochondria surface. Finally, PFN1 mutants associated with amyotrophic lateral sclerosis (ALS) fail to rescue PFN1 knockout mitochondrial phenotypes and form aggregates within mitochondria, further perturbing them. Together, these results suggest a novel function for PFN1 in regulating mitochondria and identify a potential pathogenic mechanism of ALS-linked PFN1 variants.


Conflict of interest statement

Declaration of Interests The authors declare no competing interests.

Figures

Figure 1.
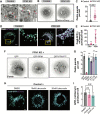
Figure 1.. Loss of PFN1 causes an upregulation of autophagy through mTOR deactivation.
A) Heat maps of RNA-seq analysis performed on PFN1 KO cells and controls, showing differential expression of genes involved in autophagy, endosome/lysosome and mTOR signaling pathways (p < 0.05). B) Representative DEPTOR Western blot for PFN1 KO and Control cells under fed and starved conditions, with and without Bafilomycin A, a specific inhibitor of autophagosome-lysosome fusion (n = 3). C) Representative Western blot of PFN1 KO and Control cells under fed/starved conditions confirming decrease in phosphorylated mTOR (n = 3). D) Representative maximum intensity projection images and quantification (graph) of control, PFN1 KO and PFN1 KO-rescued cells expressing mRuby2-LC3, showing increased LC3 puncta in PFN1-KO cells compared to control, which can be rescued with PFN1-GFP (n = 60, 3 biological replicates), scale bar = 10 μm. P-values are reported relative to Control + GFP; **** = p < 0.0001, n.s. = p > 0.05 E) Western blot and quantification of autophagic flux showing LC3I and LC3II levels compared to GAPDH in Control, PFN1 KO and PFN1 KO-rescue cells under fed and starved conditions, with and without Bafilomycin A (n = 3). P-values are listed above conditions being compared.
Figure 2.
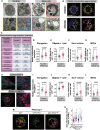
Figure 2.. Autophagy induced by the loss of PFN1 selectively targets mitochondria.
A) Representative electron micrographs of control and PFN1 KO cells. Control cells show healthy mitochondria (stars) and no obvious signs of autophagy, whereas PFN1 KO cells have abundant double membrane bound autophagic vesicles (arrows) many of which contain mitochondria (stars), scale bar = 1 μm. B-C) Representative maximum intensity projection images and quantification of control and PFN1 KO cells expressing Parkin-mCherry, showing a 10-fold increase in Parkin foci in PFN1 KO cells compared to controls (n = 60, 3 biological replicates), scale bar = 10 μm. D-E) Representative maximum intensity projection images (D) and quantification (E) of control and PFN1 KO cells expressing the mitophagy reporter Cox8-mCherry-GFP, measured at 24 and 48h post transfection. The amount of mCherry only puncta increased to approximately 10-fold after 48 hr, indicating a massive clearance of mitochondria through mitophagy in PFN1 KO cells compared to controls. P-values are relative to control; **** = p < 0.0001. F) Representative epifluorescence images of endogenous Parkin foci in PFN1 KO cells expressing either GFP, GFP-PFN1 or the non-actin binding mutant GFP-PFN1R88E. G) Quantification of Parkin foci in PFN1 cells expressing GFP, GFP-PFN1 and GFP-PFN1R88E and the ALS associated mutants M114T, E117G and G118V, showing that rescue was only possible with functional PFN1. P-values are relative to PFN1; *** = p < 0.001. H-I) Representative maximum intensity projection images (H) and quantification (I) of control CAD cells expressing Cox8-mCherry-GFP, treated with low overnight doses of Latrunculin A (10–20 nM) to depolymerize actin roughly 40–50% of total actin to approximate the F-actin loss seen in PFN1 KO cells. Quantification (I) shows no significant increase in mitophagy after overnight treatment of Latrunculin A (n = 60, 3 biological replicates). P-values are listed above conditions being compared. Scale bar = 10 μm.
Figure 3.
Figure 3.. Loss of PFN1 disrupts mitochondrial metabolism.
A-F) Seahorse Extracellular Flux Analyzer measurements of glycolysis and oxidative phosphorylation. (A-C) shows that PFN1 KO cells have deficient basal and compensatory glycolysis compared to control cells, (D-F) shows a slight reduction in basal respiration in PFN1 KO cells (n = 3). G) Representative images and quantification of control and PFN1 KO cells stained with CellROX Deep Red, a fluorogenic probe for measuring oxidative stress in live cells, scale bar = 40 μm. Quantification shows that PFN1 KO cells have a 50% reduction in ROS production compared to control cells (n = 60, 3 biological replicates). P-values are listed above conditions being compared.
Figure 4.
Figure 4.. Loss of PFN1 disrupts mitochondrial morphology.
A) Representative electron micrographs of control and PFN1 KO cells. Control cells have healthy mitochondria (yellow stars) whereas PFN1 KO cells have elongated dysmorphic mitochondria (orange stars) and numerous Mitochondria Derived Vesicles (MDV’s) (green stars), scale bar = 10 μm. B) Representative maximum intensity projection images of Tom20 labeled mitochondria from confocal z-stacks in control and PFN1 KO cells and their corresponding segmentation (each binary object is assigned a random color). Scale bar = 10 μm. C) Table with mitochondria segmentation statistics. D-G) Quantification of volume, size and elongation of Tom 20 labeled mitochondria showing PFN1 KO cells score higher than controls in all parameters measured. The number of Tom20 labeled objects that met the size criteria for mitochondria derived vesicles (MDVs), was also higher in PFN1 KO cells than controls. P-values are listed above conditions being compared. H) Representative confocal images showing maximum intensity projections of Tom20 labeled mitochondria in mouse embryonic fibroblast (MEF) control and PFN1 KO cells, scale bar = 20 μm. I-L) Quantification of volume, size and elongation of mitochondria and the presence of MVDs showing that, except for elongation, PFN1 KO MEFs have the same mitochondrial phenotypes seen in PFN1 KO CAD cells. P-values are listed above conditions being compared. M) Representative images of segmented Tom20 labeled mitochondria in PFN1 KO cells expressing GFP, GFP-PFN1 or the non-actin binding mutant GFP-PFN1R88E. Only wild-type PFN1 was able to rescue the increased sum volume phenotype. Scale bar = 10 μm. N) Quantification of sum mitochondria in PFN1 KO cells expressing either GFP-PFN1, GFP, GFP-PFN1R88E or the ALS-linked mutations GFP-PFN1M114T, GFP-PFN1E117G and GFP-PFN1G118V. Complete sum mitochondria volume rescue was only achieved with functional GFP-PFN1 and a partial rescue with the ALS-linked GFP-PFN1M114T mutant. P-values listed are relative to PFN1; *** = p < 0.001.
Figure 5.
Figure 5.. Loss of PFN1 disrupts mitochondrial dynamics.
Mitochondrial dynamics were assessed by live cell imaging of control and PFN1 KO cells expressing 4xmts-mNeonGreen to label the inner mitochondrial membrane. A) Maximum intensity projections from a single frame (top) and time projections (bottom) of entire movies from representative experiments. Time projections are color-coded according to the scale inserted in right image. Scale bar = 10 μm. B-C) Quantification of average velocity and distance traveled of mitochondria in control and PFN1 KO cells, showing no significant differences in these parameters as indicated by p-values above graphs. D-E) Quantification of mitochondria fission and fusion events in control and PFN1 KO cells, show significant reductions in both in the absence of PFN1. P-values are listed above the conditions being compared in B-E. F) Scatter plots depicting the number of fission or fission events from each experiment plotted against sum mitochondria volume. Linear fitting and calculation of the Pearson’s correlation coefficient (r) reveal that PFN1 KO cells have a high correlation between the number of fission and fusion events with the amount of mitochondria present in the cells, while there is no correlation between these parameters in control cells. Linear fit, Pearson’s correlation coefficient and p-value are reported for each condition; Red for fission and blue for fusion events. G-H) Representative images of maximum intensity projections of Tom20 labeled mitochondria colocalized and DRP1 in control and PFN1 KO cells (G), and quantification of the Pearson’s correlation coefficient (H). Colocalization between Tom20 and DRP1 is reduced in the absence of PFN1. P-values are listed above the conditions being compared. Scale bar = 10 μm.
Figure 6.
Figure 6.. PFN1 is inside the mitochondrial matrix.
A) Representative images showing maximum intensity projections of Tom20 labeled mitochondria and GFP-PFN1 in PFN1 KO cells after overextraction, showing localization of PFN1 to mitochondria. Scale bar = 10μm. B) Representative images showing maximum intensity projections of Tom20 labeled mitochondria colocalized with the aggregating ALS mutant GFP-PFN1M114T in PFN1 KO cells, scale bar = 10 μm. C) Schematic protocol and western blot showing the localization of endogenous PFN1 inside the IMM in WT CAD cells. Proteinase K treatment alone removes the outer mitochondria membrane (OMM) protein Tom20 but not the IMM protein COXIV nor PFN1, whereas pretreatment with TritonX-100 removes both the IMM protein COXIV and PFN1. D) 4X expansion microscopy of PFN1 KO cells expressing 4Xmts-scarlet to label the inner mitochondria membrane (IMM) and GFP-PFN1, showing that GFP-PFN1 can be visualized inside the IMM.

References

    1. Pollard T.D., and Borisy G.G. (2003). Cellular motility driven by assembly and disassembly of actin filaments. Cell 112, 453–465. - PubMed
    1. Blanchoin L., Boujemaa-Paterski R., Sykes C., and Plastino J. (2014). Actin dynamics, architecture, and mechanics in cell motility. Physiol Rev 94, 235–263. 10.1152/physrev.00018.2013. - DOI - PubMed
    1. Skruber K., Read T.A., and Vitriol E.A. (2018). Reconsidering an active role for G-actin in cytoskeletal regulation. J Cell Sci 131. 10.1242/jcs.203760. - DOI - PMC - PubMed
    1. Fung T.S., Ji W.K., Higgs H.N., and Chakrabarti R. (2019). Two distinct actin filament populations have effects on mitochondria, with differences in stimuli and assembly factors. J Cell Sci 132. 10.1242/jcs.234435. - DOI - PMC - PubMed
    1. Manor U., Bartholomew S., Golani G., Christenson E., Kozlov M., Higgs H., Spudich J., and Lippincott-Schwartz J. (2015). A mitochondria-anchored isoform of the actin-nucleating spire protein regulates mitochondrial division. Elife 4. 10.7554/eLife.08828. - DOI - PMC - PubMed

Publication types