[Preprint]. 2023 Aug 9:2023.08.08.552077.
doi: 10.1101/2023.08.08.552077.

Machine-guided design of synthetic cell type-specific cis-regulatory elements

Affiliations

Machine-guided design of synthetic cell type-specific cis-regulatory elements

S J Gosai et al. bioRxiv. .

Update in

  • Machine-guided design of cell-type-targeting cis-regulatory elements.
    Gosai SJ, Castro RI, Fuentes N, Butts JC, Mouri K, Alasoadura M, Kales S, Nguyen TTL, Noche RR, Rao AS, Joy MT, Sabeti PC, Reilly SK, Tewhey R. Gosai SJ, et al. Nature. 2024 Oct;634(8036):1211-1220. doi: 10.1038/s41586-024-08070-z. Epub 2024 Oct 23. Nature. 2024. PMID: 39443793 Free PMC article.

Abstract

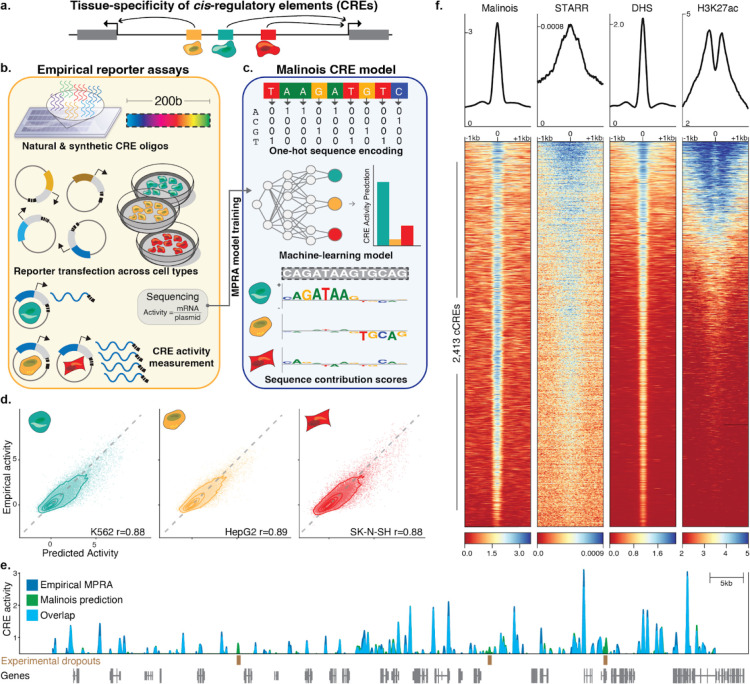
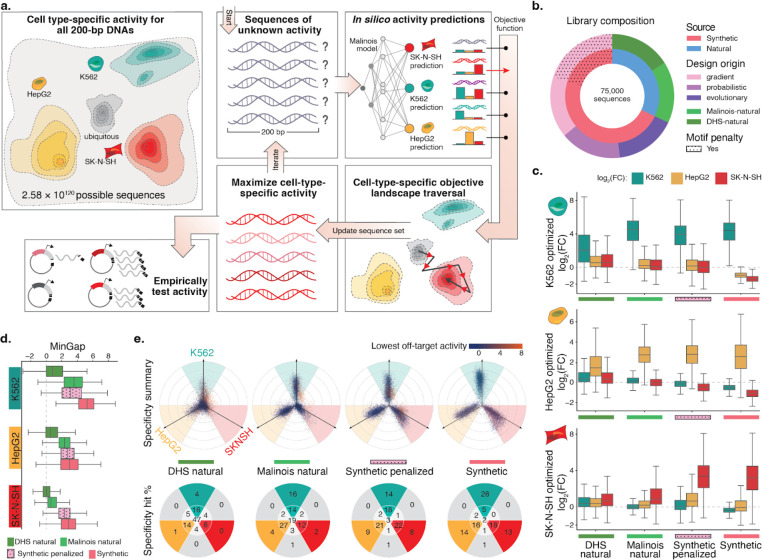
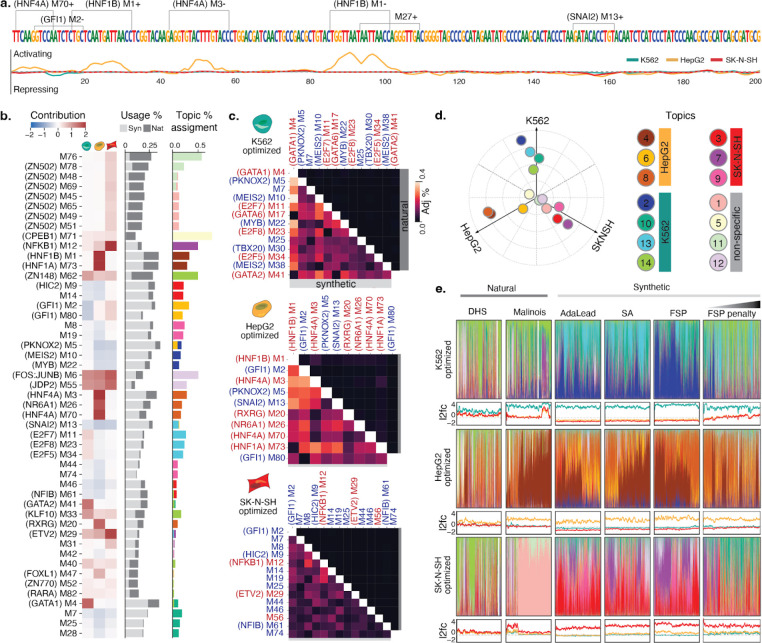
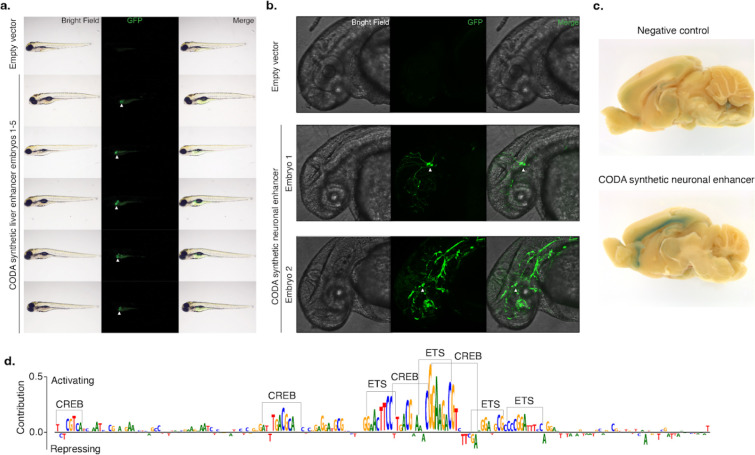
Cis-regulatory elements (CREs) control gene expression, orchestrating tissue identity, developmental timing, and stimulus responses, which collectively define the thousands of unique cell types in the body. While there is great potential for strategically incorporating CREs in therapeutic or biotechnology applications that require tissue specificity, there is no guarantee that an optimal CRE for an intended purpose has arisen naturally through evolution. Here, we present a platform to engineer and validate synthetic CREs capable of driving gene expression with programmed cell type specificity. We leverage innovations in deep neural network modeling of CRE activity across three cell types, efficient in silico optimization, and massively parallel reporter assays (MPRAs) to design and empirically test thousands of CREs. Through in vitro and in vivo validation, we show that synthetic sequences outperform natural sequences from the human genome in driving cell type-specific expression. Synthetic sequences leverage unique sequence syntax to promote activity in the on-target cell type and simultaneously reduce activity in off-target cells. Together, we provide a generalizable framework to prospectively engineer CREs and demonstrate the required literacy to write regulatory code that is fit-for-purpose in vivo across vertebrates.


Conflict of interest statement

Competing Interests PCS is a co-founder of and consultant to Sherlock Biosciences and Board Member of Danaher Corporation. PCS and RT have filed intellectual property related to MPRA. SJG, RIC, SKR, PCS, and RT have filed a provisional patent application related to work described here.

Figures

Figure 1.
Figure 1.. Malinois accurately predicts transcriptional activation by CREs in episomal reporters.
(a) Schematic showing non-coding cis-regulatory elements (CREs) in the genome drive gene expression and contribute to cell type specific expression. (b) Overview of how MPRAs enable targeted functional characterization of hundreds of thousands of CREs on transcription in episomal reporters, and can quantify the impact of programmable 200-bp oligonucleotide sequences. MPRAs across multiple cell types enables discovery of cell type-specific activity of CREs. (c) Schematic showing how deep learning enables modeling of cell type-specific CRE effects directly from nucleotide sequence. Malinois, a deep convolutional neural network, predicts CRE activity in K562 (teal), HepG2 (yellow), and SK-N-SH (red). Contribution scores can be extracted from the model to determine how subsequences drive predicted function in each cell type. (d) Malinois predictions are highly correlated with empirically measured MPRA activity across K562 (teal), HepG2 (yellow), and SK-N-SH (red). Performance for each cell type was measured using Pearson correlation (r) on a test set of sequences withheld from training. Each point corresponds to empirical and predicted activity of a single CRE in the corresponding cell type, and topological lines indicate point density (16.7%, 33.3%, 50%, 66.7%, 83.3%) in the scatter plots. Train/test splits were defined by chromosomes. (e) Malinois activity predictions for sequences centered on K562-specific DHS peaks activate transcription in K562. This pattern of activation is concordant with quantitative signals measured using STARR-seq, DHS-seq, and H3K27ac seq. (f) Malinois predictions recapitulate an MPRA screen of overlapping fragments derived from a 2.1Mb window centered on the GATA1 gene (Pearson’s r = 0.91; Supplementary Fig. 4). Light blue signal indicates overlapping signal while dark blue and green regions indicate either higher activity measurements or predictions by MPRA or Malinois, respectively, in the window chrX:48,000,000–49,000,000.
Figure 2.
Figure 2.. CODA effectively designs novel cell type-specific CREs using Malinois predictions.
(a) CODA designs synthetic elements by iteratively updating sequences to improve predicted function. Cell type-specific CRE activity of all 200 bp DNA oligos induces a topology over a massive sample space. CODA initializes sequences in this space and uses Malinois to predict local topology. An objective function is used by CODA to direct updates of sequences to move as desired through predicted topology. Updated sequences can be further modified in silico until a stopping criteria is reached and final candidates are proposed for experimental validation. (b) Composition of the MPRA library designed to empirically evaluate candidate cell type-specific CREs. A total of 75,000 sequences were selected from the human genome (green hues) or designed ab initio using CODA (purple hues) to maximize the MinGap score for a target cell type. Aggregated natural and synthetic sequences are indicated by blue and coral coloring, respectively. Sequences generated using motif-penalization are delineated by the dotted overlay. (c) Computationally-designed CREs maintain high transcriptional activity in target cells while improving silencing in off-target cells. The three rows of box plots correspond to candidate CREs intended to drive cell type-specific expression in K562, HepG2, and SK-N-SH. Each group of three boxes indicate the distribution of MPRA log2 fold change (log2FC) measurements in K562 (teal), HepG2 (yellow), and SK-N-SH (red) for a set of sequences nominated by the indicated design strategy on the x-axis. Boxes demarcate the 25th, 50th, and 75th percentile values, while whiskers indicate the outermost point with 1.5 times the interquartile range from the edges of the boxes. Sequences with a replicate log2FC standard error greater than 1 in any cell type were not included. (d) CODA-designed synthetic sequences achieve higher overall cell type-specific activity than natural sequences. Box plots display distribution of MinGap scores to quantify cell-specific CRE function and color indicates intended target cell type (K562: teal; HepG2: yellow; SK-N-SH: red). Boxes demarcate the 25th, 50th, and 75th percentile values, while whiskers indicate the outermost point with 1.5 times the interquartile range from the edges of the boxes. Sequences with a replicate log2FC standard error greater than 1 in any cell type were not included. (e) Top row: propeller plots for each sequence group. The radial distance corresponds to the distance between the maximum and minimum cell type activity values, while the angle of deviation from an axis quantifies the relative activity of the highest off-target cell type (Methods). Teal, yellow, and red areas represent sequences in which the MinGap:MaxGap ratio is greater than 0.5. Dot colors are associated with the activity in the minimum off-target cell type. Bottom row: percentages of points in each delimited area rounded to the nearest integer. The point count in the center represents sequences with quasi-uniform activity across cell types, while the gray wedges count sequences with a low MinGap. The groups synthetic and synthetic-penalized were randomly sub-sampled to match the size of the two natural groups (see Supplementary Fig 13 for full plots).
Figure 3.
Figure 3.. Interpreting CRE syntax in engineered elements.
(a) Malinois contribution scores enable nucleotide resolution interpretation of sequence activity. Shown is a representative synthetic CRE designed to drive HepG2-specific reporter expression. Enriched motifs, demarcated on the upper sequence track, can be combined with model prediction contribution scores, plotted for each cell type on the lower track (K562: teal, HepG2: yellow, SK-N-SH: red), to interrogate and assign functional subunits. Positive and negative values indicate sequences contribute to transcriptional activation or silencing, respectively, in the corresponding cell type. Motifs are labeled with an “M” followed by their STREME output index. Motifs with a strong known-motif match (Methods) have the name of the match in parenthesis preceding their label. “+” and “−” denote forward and reverse orientations respectively. (b) Left heatmap: average contributions of enriched motifs in K562, HepG2, SK-N-SH (left to right columns). Center bar plot: motif enrichment in synthetic (light gray) and natural (dark gray) sequences. The x-axis represents the percentage of sequences in each group that contain at least one instance of that motif denoted on the y-axis. Right bar plot: motif program association derived from the NMF features matrix. Colors correspond to programs listed in Fig 3e. Only motifs with the top-4 assignments for each topic were included in the figure (see Supplementary Fig. 14 for full figure). (c) Cooccurrences of enriched motifs are more prevalent in synthetic CREs. Adjusted co-occurrence percentage is calculated by multiplying (i) the percentage of sequences in each group containing a pair of motifs and (ii) the similarity divergence of the motifs (1 minus the Pearson correlation coefficient of the motif logos in their optimal alignment) (Methods; see Supplementary Fig. 16 for raw percentages.). Upper and lower triangular percentages correspond to natural and synthetic sequences respectively. Red and blue motif labels denote motifs with mostly positive or negative contribution, respectively. (d) Specific functional programs drive cell type-specific transcription. Empirical program function calculated using a weighted average of MPRA log2FC scores based on topic mixture displayed in panel c. Ten cell type specificity-driving programs were identified using the same criteria applied to identify cell type-specific sequences (bright colored points; 4 for K562, 3 for HepG2, 3 for SK-N-SH). Four programs are not associated with cell type-specific transcription (pastel points). (e) Synthetic and natural sequences show distinct patterns of higher order arrangements of TF binding motifs. Colored bar plots generated from NMF decomposition of synthetic and natural sequences based on enriched motif content reveal the functional programs used in each sequence. For each sequence, programs colored based on the key in d and are plotted as a fraction of total program content. Note, in a few cases, sequences were not assigned to any program with any frequency yielding a blank bar. Line plots display MPRA log2FC scores for the above sequences in K562 (teal), HepG2 (yellow), and SK-N-SH (red). Sub-panels are organized into rows by expected target cell type and columns by method used to nominate candidate sequences. Sequences in each panel are sorted by hierarchical clustering based on program content.
Figure 4.
Figure 4.. In vivo validation of synthetic elements using zebrafish and mouse.
(a) A synthetic liver-specific CRE drives transgene expression in the larval zebrafish liver. Brightfield, GFP, and merged whole animal imaging 96 hours post-fertilization indicates that the synthetic CRE reproducibly drives transgene expression in zebrafish liver (white arrows). Lateral view, anterior to the left, dorsal up. (b) CODA-designed SK-N-SH-specific CRE drives GFP expression in embryonic zebrafish neurons (white arrows). Brightfield, GFP, and merged imaging of the brain and anterior spinal region of animals 48 hours post-fertilization show transgene expression in the developing brain and spinal cord. Embryo 2 shows additional incidental off-target expression in vascular tissue. Lateral view, anterior to the left, dorsal up. (c) Synthetic SK-N-SH-specific CRE drives transgene expression in 5-week-old postnatal mice. X-Gal staining for LacZ of the medial section of the brain reveals specific transgene expression at layer 6 of the neocortex. (d) Malinois contribution scores reveal the role of ETS and CREB-like binding domains in mediating synthetic CRE activity in neurons. Subsequences of high predicted contribution to SK-N-SH activity overlap with ETS- and CREB-like binding motifs based on visual inspection.

References

    1. Wittkopp P. J. & Kalay G. Cis-regulatory elements: molecular mechanisms and evolutionary processes underlying divergence. Nat. Rev. Genet. 13, 59–69 (2011). - PubMed
    1. Gasperini M., Tome J. M. & Shendure J. Towards a comprehensive catalogue of validated and target-linked human enhancers. Nat. Rev. Genet. 21, 292–310 (2020). - PMC - PubMed
    1. de Boer C. G. & Taipale J. Hold out the genome: A roadmap to solving the cis-regulatory code. bioRxiv 2023.04.20.537701 (2023) doi:10.1101/2023.04.20.537701. - DOI - PubMed
    1. Heinz S., Romanoski C. E., Benner C. & Glass C. K. The selection and function of cell type-specific enhancers. Nat. Rev. Mol. Cell Biol. 16, 144–154 (2015). - PMC - PubMed
    1. ENCODE Project Consortium et al. Expanded encyclopaedias of DNA elements in the human and mouse genomes. Nature 583, 699–710 (2020). - PMC - PubMed

Publication types