

Impact of Noise Level on the Accuracy of Automated Measurement of CT Number Linearity on ACR CT and Computational Phantoms
- PMID: 37609515
- PMCID: PMC10440409
- DOI: 10.31661/jbpe.v0i0.2302-1599
Impact of Noise Level on the Accuracy of Automated Measurement of CT Number Linearity on ACR CT and Computational Phantoms
Abstract
Background: Methods for segmentation, i.e., Full-segmentation (FS) and Segmentation-rotation (SR), are proposed for maintaining Computed Tomography (CT) number linearity. However, their effectiveness has not yet been tested against noise.
Objective: This study aimed to evaluate the influence of noise on the accuracy of CT number linearity of the FS and SR methods on American College of Radiology (ACR) CT and computational phantoms.
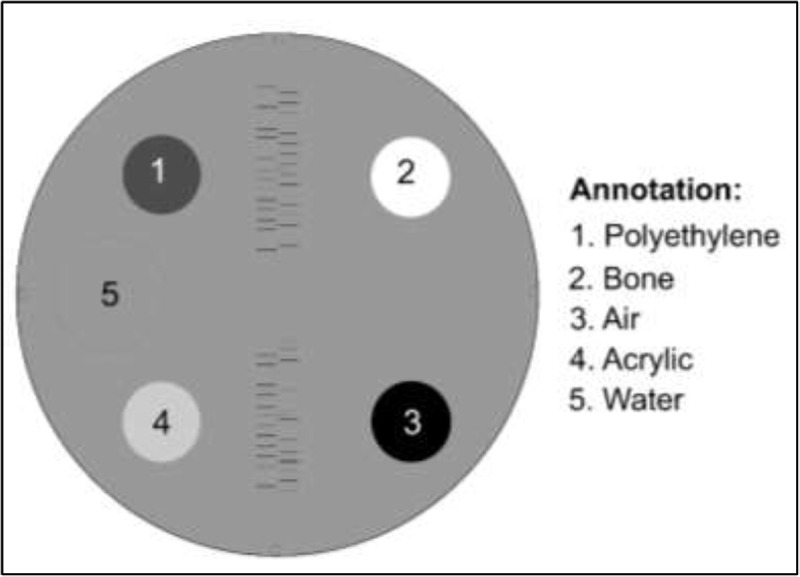
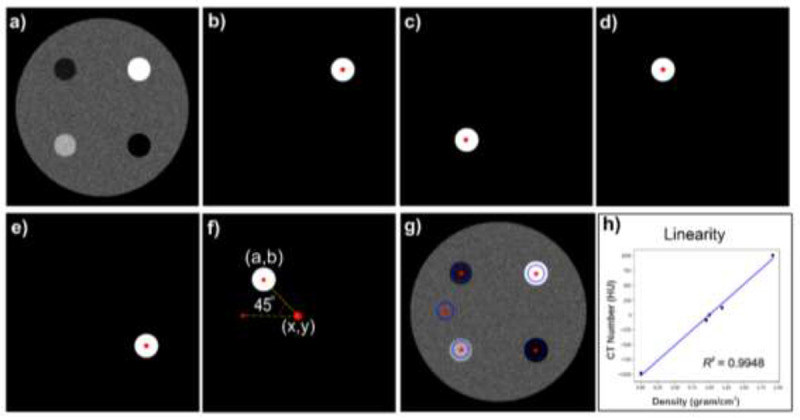
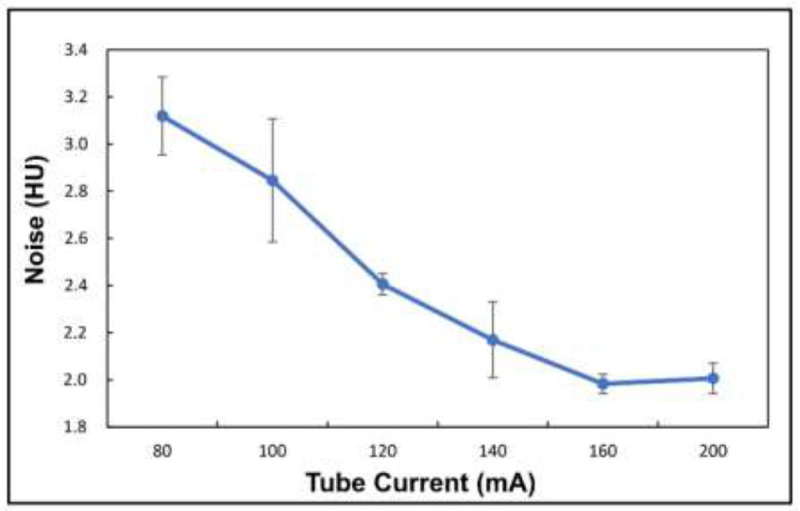
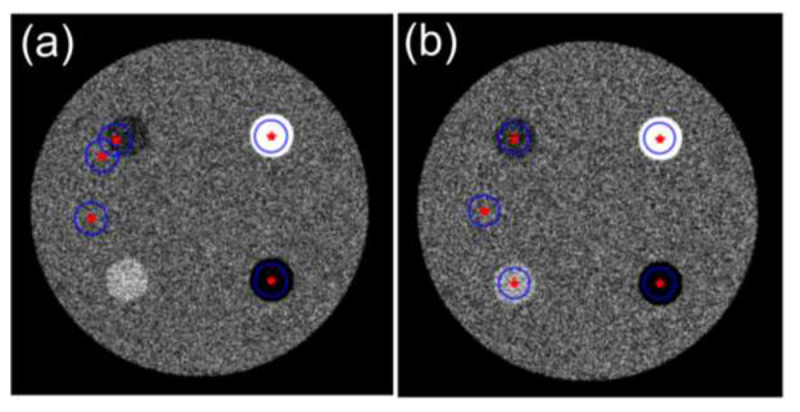
Material and methods: This experimental study utilized two phantoms, ACR CT and computational phantoms. An ACR CT phantom was scanned by a 128-slice CT scanner with various tube currents from 80 to 200 mA to acquire various noises, with other constant parameters. The computational phantom was added by different Gaussian noises between 20 and 120 Hounsfield Units (HU). The CT number linearity was measured by the FS and SR methods, and the accuracy of CT number linearity was computed on two phantoms.
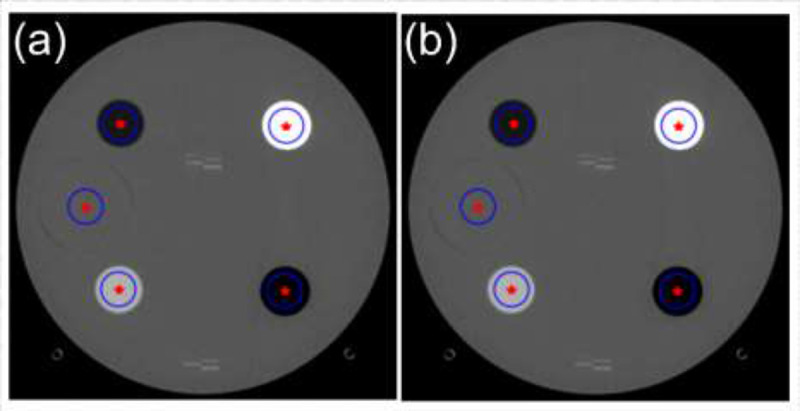
Results: The two methods successfully segmented both phantoms at low noise, i.e., less than 60 HU. However, segmentation and measurement of CT number linearity are not accurate on a computational phantom using the FS method for more than 60-HU noise. The SR method is still accurate up to 120 HU of noise.
Conclusion: The SR method outperformed the FS method to measure the CT number linearity due to its endurance in extreme noise.
Keywords: ACR CT Phantom; CT Number Linearity; Computational Phantom; Computed Tomography Scanner; Diagnostic Imaging; Image Quality Enhancement; Noise; Quality of Health Care.
Copyright: © Journal of Biomedical Physics and Engineering.
Conflict of interest statement
None
Figures
Similar articles
-
Impact of ROI Size on the Accuracy of Noise Measurement in CT on Computational and ACR Phantoms.J Biomed Phys Eng. 2022 Aug 1;12(4):359-368. doi: 10.31661/jbpe.v0i0.2202-1457. eCollection 2022 Aug. J Biomed Phys Eng. 2022. PMID: 36059282 Free PMC article.
-
Technical Note: Evaluation of a 160-mm/256-row CT scanner for whole-heart quantitative myocardial perfusion imaging.Med Phys. 2016 Aug;43(8):4821. doi: 10.1118/1.4957389. Med Phys. 2016. PMID: 27487900
-
Evaluation of commercial extension plates for the ACR CT accreditation phantom.J Appl Clin Med Phys. 2016 Jan 8;17(1):416-420. doi: 10.1120/jacmp.v17i1.5785. J Appl Clin Med Phys. 2016. PMID: 26894348 Free PMC article.
-
The automated measurement of CT number linearity using an ACR accreditation phantom.Biomed Phys Eng Express. 2022 Dec 16;9(1). doi: 10.1088/2057-1976/aca9d5. Biomed Phys Eng Express. 2022. PMID: 36541467
-
Radiation dose and image quality in pediatric CT: effect of technical factors and phantom size and shape.Radiology. 2004 Nov;233(2):515-22. doi: 10.1148/radiol.2332032107. Epub 2004 Sep 9. Radiology. 2004. PMID: 15358847
Cited by
-
The Dose Optimization and Evaluation of Image Quality in the Adult Brain Protocols of Multi-Slice Computed Tomography: A Phantom Study.J Imaging. 2023 Nov 28;9(12):264. doi: 10.3390/jimaging9120264. J Imaging. 2023. PMID: 38132682 Free PMC article.
References
-
- Li Y, Jiang Y, Yu X, Ren B, Wang C, Chen S, et al. Deep-learning image reconstruction for image quality evaluation and accurate bone mineral density measurement on quantitative CT: A phantom-patient study. Front Endocrinol. 2022;13:884306. doi: 10.3389/fendo.2022.884306. [ PMC Free Article ] - DOI - PMC - PubMed
-
- Barros MC, Altmayer S, Carvalho AR, Rodrigues R, Zanon M, Mohammed TL, et al. Quantitative computed tomography: What clinical questions can it answer in chronic lung disease? Lung. 2022;200(4):447–55. doi: 10.1007/s00408-022-00550-1. [ PMC Free Article ] - DOI - PMC - PubMed
-
- Shin SY, Hong IK, Jo YS. Quantitative computed tomography texture analysis: can it improve diagnostic accuracy to differentiate malignant lymph nodes? Cancer Imaging. 2019;19(1):25. doi: 10.1186/s40644-019-0214-8. [ PMC Free Article ] - DOI - PMC - PubMed
-
- Yoo JS, Chung SH, Lim MC, Kim YJ, Kim KG, Hwang JH, Kim YH. Computed tomography-based quantitative assessment of lower extremity lymphedema following treatment for gynecologic cancer. J Gynecol Oncol. 2017;28(2):18. doi: 10.3802/jgo.2017.28.e18. [ PMC Free Article ] - DOI - PMC - PubMed
LinkOut - more resources
Full Text Sources
Research Materials