Queuosine-tRNA promotes sex-dependent learning and memory formation by maintaining codon-biased translation elongation speed
- PMID: 37609797
- PMCID: PMC10548180
- DOI: 10.15252/embj.2022112507
Queuosine-tRNA promotes sex-dependent learning and memory formation by maintaining codon-biased translation elongation speed
Abstract
Queuosine (Q) is a modified nucleoside at the wobble position of specific tRNAs. In mammals, queuosinylation is facilitated by queuine uptake from the gut microbiota and is introduced into tRNA by the QTRT1-QTRT2 enzyme complex. By establishing a Qtrt1 knockout mouse model, we discovered that the loss of Q-tRNA leads to learning and memory deficits. Ribo-Seq analysis in the hippocampus of Qtrt1-deficient mice revealed not only stalling of ribosomes on Q-decoded codons, but also a global imbalance in translation elongation speed between codons that engage in weak and strong interactions with their cognate anticodons. While Q-dependent molecular and behavioral phenotypes were identified in both sexes, female mice were affected more severely than males. Proteomics analysis confirmed deregulation of synaptogenesis and neuronal morphology. Together, our findings provide a link between tRNA modification and brain functions and reveal an unexpected role of protein synthesis in sex-dependent cognitive performance.
Keywords: learning and memory; protein translation; queuosine; sex bias; tRNA modifications.
© 2023 The Authors. Published under the terms of the CC BY NC ND 4.0 license.
Conflict of interest statement
The authors declare that they have no conflict of interest.
Figures

Representative APB Northern blot analysis showing differences in the levels of Q‐tRNAHis modification between 19 tissues isolated from a 3‐month‐old female (dot) and male (triangle) mouse; bars represent the mean. 5S rRNA is shown as a loading control. The percentage of Q‐tRNA was obtained by dividing the Q signal by the overall signal of Q and G. Data are represented as mean; (n = 2).
Scheme of tissue‐specific Q modification pattern in total RNA based on LC–MS/MS measurements. The highest Q modification containing tissue and heart was considered as 100%. The color scale indicates the relative level of Q modification in total RNA.
C38 methylation of tRNAAsp GUC (m5C38) was measured by amplicon‐based RNA bisulfite sequencing on the same tissue of (A).

PCR amplicon‐based sequencing chromatogram covering the mutated (Q1) site shows the insertion of a T nucleotide in the third exon of the Qtrt1 gene. The chromatograms are shown in the 5′–3′ orientation. (+1) Indicates insertion of one nucleotide, T. PAM: proto adjacent motif.
The mutation causes loss of QTRT1 protein. 100 μg of total protein isolated from a 7‐month‐old hippocampus was analyzed by Western blotting using anti‐QTRT1 antibody. β‐Actin was used as a loading control.
Insertion of T nucleotide in the Qtrt1 gene results in complete loss of Q‐tRNAHis modification in the Q1 brain. 5 μg of RNA was separated on an APB gel and hybridized with tRNAHis oligonucleotide probe.
Mass spectrometry quantification of Q, galactosyl‐Q or mannosyl‐Q levels in total RNA isolated from the brain tissue. Data are represented as mean ± SD; (n = 3 technical replicates).
Reduced DNMT2‐dependent methylation levels were determined by RNA bisulfite sequencing in the Q1 hippocampus. Each dot represents an individual. Error bars represent ±SD; (n = 5). ****P‐value < 0.0001, two‐tailed unpaired t‐test.

Mice were tested for place learning and reversal place learning using IntelliCage. During the 5 days of place learning sessions, each animal has free access to water at only one specific corner in the cage and visits to any other corner are registered as an “error”. During the 3 days of place reversal sessions, the water access corner is switched to the diagonally opposing site. Heatmap showing the medium number of visits for each animal group during the place preference and reversal sessions in the IntelliCage test.
Percentage of erroneous visits in the max activity time (first 8 h of the night) for each session is presented as a measure of learning performance. Error bars are represented as ±SEM. Statistical significance was analyzed by beta regression. Effect of sex on overall genotypes has P‐value = 0.01827. Significant P‐values for genotype effect (Q1 versus wt) for the entire session and at time points are indicated.
Heatmap showing the number of erroneous visits for each animal group during the place preference and reversal sessions.
Percentage of the number of visits to the correct corner with nose poke and a minimum of one lick in the same session period of (C). Error bars are represented as ±SEM. Statistical significance was analyzed by beta regression. Effect of sex on overall genotypes has P‐value = 0.0000249. Significant P‐values for genotype effect (Q1 versus wt) for the entire session and at time points are indicated. For (A) to (D) Female n = 8 wt and n = 10 Q1; male n = 8 wt and n = 8 Q1.
wt and Q1 mice were subjected to fear‐conditioning test. Percentage of freezing behavior is shown minute by minute during conditioning, contextual, and cued tests. Error bars are represented as ±SEM. Statistical significance was analyzed by beta regression. Effect of sex on overall genotypes has P‐value = 0.06461 for conditioning, P‐value = 0.001254 for contextual, and P‐value = 0.0951 for cued tests. Significant P‐value for genotype effect (Q1 versus wt) for the entire session and at discrete time points are indicated in the graphs. Female n = 14 wt and n = 16 Q1; male n = 14 wt and n = 14 Q1.
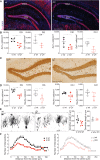
Representative Syt1 staining in the 7‐ to 8‐month‐old female mice. Syt1 mRNA expression colocalizes with nuclei of post‐mitotic neurons. Red: Syt1 mRNA, blue: DAPI. Scale bar 500 μm.
The number of Syt1+ cells was counted in the dentate gyrus (DG) and CA1 using ImageJ. Error bars represent ±SD (n ≥ 3). Statistical significance was analyzed by two‐tailed unpaired t‐test.
Representative images of IHC staining for NeuN in the DG of 8‐month‐old female mice. Scale bar 250 μm.
Quantification of NeuN+ cells in the DG and CA1 using ImageJ. Error bars represent ±SD; (n = 5). Statistical significance was analyzed by two‐tailed unpaired t‐test.
Representative images and dendrite lengths of Golgi‐Cox‐stained pyramidal neurons in the DG area of 8‐month‐old female wild‐type and Q1 mice. Red asterisks indicate pyramidal neurons with short dendrites in the Q1 mice. Scale bar: 10 μm. Error bars represent ±SD; (n = 5; 20 dendrites per replicate). Statistical significance was analyzed by two‐tailed unpaired t‐test.
Sholl analysis of the complexity of neuronal dendritic arbors in the DG. Error bars represent ±SEM; (n = 15; 3 neurons per animal and 5 animals per genotype/sex).
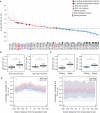
Changes in bulk codon enrichment (CE) at ribosome A site in the 6‐ to 7‐month‐old Q1 hippocampi compared to wild‐type. The overall composition of codons is highlighted in the indicated colors. A/U‐ or G/C‐rich indicates that a codon contains at least two A and/or U or G and/or C bases, respectively. Error bars represent ±SE; (n = 5).
Boxplots depict the difference in codon enrichment (CE) between G/C‐rich codons versus A/U‐rich codons at the ribosome A site. Boxplots display the median as central band, and first and third quartiles as box limits; whiskers correspond to the box limits ± 0.75 interquartile range. The sample size is n = 32 for G/C‐rich codons and n = 29 for A/U‐rich codons. Replicates correspond to CE for different codon identities. CE of each codon is averaged over three biological replicates for female and two for male mice. Wilcoxon rank‐sum test ***P‐value < 0.001.
Quantification of CE of strong and weak codons at the ribosome A site. The codons were classified according to Turner energies of the codon/anticodon pairs (Grosjean & Westhof, 2016). The strong group (average − 3.1 kcal/mole): Ala (GCU, GCC, GCA, GCG), Arg (CGU, CGC, CGA, CGG), Gly (GGU, GGC, GGA, GGG), and Pro (CCU, CCC, CCA, CCG). The weak group (average − 1.0 kcal/mole): Asn (AAU, AAC), Ile (AUU, AUC, AUA), Leu (UUA, UUG), Lys (AAA, AAG), Met (AUG), Phe (UUU, UUC), and Tyr (UAU, UAC). Boxplots display the median as central band, and first and third quartiles as box limits; whiskers correspond to the box limits ± 0.75 interquartile range. The sample size is n = 16 for strong codons, and n = 14 for weak codons. Replicates correspond to CE for different codon identities. CE is averaged over three biological replicates for female and two for male mice. Wilcoxon rank‐sum test ***P‐value < 0.001.
Metagene plot of footprint coverage in the ribosome queue of Q‐decoded codons. The coverage of A/U‐ or G/C‐ rich codons at each position is normalized to their respective coverage at the A site. The plots show the raw mean, the smoothed mean, and the confidence band corresponding to ±SEM (female n = 3, male n = 2).
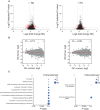
Volcano plots showing ribosome density (RD) of 6‐ to 7‐month‐old Q1 and wild‐type hippocampi (n = 5, 2 male and 3 female). Red dots represent differentially translated genes defined as at least one fold change (0.5 ≤ log2(FC) ≤ −0.5) and adjusted P‐value < 0.1.
Relationship between GC content and the RD. Pearson's correlation coefficient (R) and linear regression line (red) are indicated (male n = 2 and female n = 3).
PANTHER reactome overrepresentation test of differentially translated genes in male and female Q1 hippocampi identifies the canonical pathways (0.5 ≤ log2(FC) ≤ −0.5 and adjusted P‐value < 0.1). The top 10 pathways are shown. P‐value by Fischer's exact test followed by false discovery rate correction (FDR < 0.05).

Western blot analysis showing increased levels of phosphorylated eIF2α upon loss of Q in the 8‐month‐old female Q1 hippocampi. β‐Actin and global eIF2α levels were used as loading controls. Loss of QTRT1 confirms the genotypes. For the quantification of the level of eIF2α phosphorylation, the signal was normalized to total eIF2α. Error bars: ±SD; (n = 6, 3 male and 3 female). *P‐value < 0.05, two‐tailed unpaired t‐test.
Dimethyl‐labeling analysis of 8‐months‐old hippocampi. The red dots represent 243 deregulated proteins for male and 188 proteins for female mice. The adjusted P‐value < 0.05 is indicated by the horizontal line. n = 6, 3 males and 3 females in 2 technical replicates.
Gene ontology analysis of the deregulated proteins. The top 10 biological processes are presented. Adjusted P‐value was calculated using Benjamini–Hochberg method.
- A
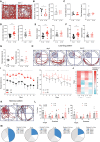
Representative track record of wt and Q1 mice subjected to open‐field test.
- B, C
Total distance traveled (B) and distance traveled in the center (C) are shown. Statistical significance was analyzed by two‐tailed unpaired t‐test. Data points are shown as ±SEM; (n = 6).
- D–F
The graphs show the locomotion duration, distance, and speed measured in home cage observation test. Statistical significance was analyzed by two‐tailed unpaired t‐test. Data points are shown as ±SEM; (n ≥ 14).
- G
Visual navigation capacities were measured before the MWM training. The animals were directed to the escape platform with the help of visual cues around the maze and a flagged platform. Each dot represents an individual. Error bars demonstrate ±SEM (n = 6; 4 trials per each replicate).
- H
Representative swimming paths on day 2 and day 10 of MWM test. Spatial learning was tested in 5‐ to 6‐month‐old mice by the MWM test. The mice were left for 90 s in a water‐filled alley with an invisible platform as a motivation to escape. The swimming was recorded and tracked with Sygnis tracker. Red lines indicate the swimming path.
- I
The escape latency was determined as the time spent until an animal finds the platform within 90 s and plotted as the learning curve over 10 consecutive days. Data points represent ±SEM; (n = 6; 4 trials within each biological replicate per day). Statistical significance was analyzed by two‐way ANOVA followed by Benjamini and Hochberg post hoc test. P‐values for genotype effect and at individual time points are indicated in the curves.
- J
The number of success refers to the number of times an animal finds the platform within 90 s trial. Statistical significance was analyzed by beta regression. The effect of sex on overall genotypes; P‐value = 0.0000344. Significant P‐values for genotype effect (Q1 versus wt) for both male and female are indicated. (n = 6; 4 trials within each biological replicate per day).
- K
Representative swimming paths on day 12 (probe trial) of the MWM test. Red lines indicate the swimming path.
- L
Percentage of time each animal spent in each quadrat during the probe trial (day 12) in the MWM test. The statistical effect of the genotype on the time in quadrant 1 (which had the platform) was calculated using the Wilcoxon rank‐sum test (two‐sided). Data points are shown as ±SEM; (n = 6).
- M
Percentage of time that each animal group spent in each quadrat during the probe trial (day 12) in the MWM test. The target quadrant 1 is indicated in blue.
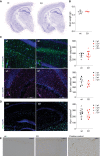
Nissl staining of brain coronal sections from 6‐ to 7‐month‐old mice. Neurons are stained in violet–blue.
Brain weight of 6‐ to 7‐month‐old mice. Error bars indicate ±SD (n = 6, 3 males and 3 females).
Immunostainings and quantification of astrocyte (GFAP) and microglia (IBA1) in the 7‐month‐old hippocampi. Green cells: GFAP, violet cells: IBA1, and blue: DAPI. Scale bar 100 μm. The number of positive cells was counted manually using ImageJ. Error bars indicate ±SD; (n ≥ 6).
RNA in situ hybridization identifying oligodendrocytes (Plp1) in the 7‐month‐old hippocampi. Green: Plp1, and blue: DAPI. Scale bar 100 μm. The number of positive cells was counted manually using ImageJ. Error bars indicate ±SD (n ≥ 8).
TUNEL assay showing similar cell death in the wt and Q1 hippocampus.

- A
Representative images of NeuN staining of hippocampal neurons from 8‐month‐old wt and Q1 mice. Red rectangles indicate magnified pictures shown in Fig 4C. Scale bar 500 μm.
- B
Representative images of Golgi‐Cox‐stained brain sections of hippocampal neurons from 8‐month‐old wt and Q1 mice. Red rectangles show the area considered for the measurements of dendritic spine density in (D and E) and of the dendrite length and Sholl analysis (main Fig 4E and F). Scale bar 2 mm.
- C
Examples of dendritic spine counting window. Scale bar 500 μm. The spines were counted manually in ImageJ.
- D, E
Density of dentate gyrus spines in wt and Q1 mouse hippocampi. Error bars represent ±SD; (n = 5). The spines of at least five dendrites were quantified for each replicate.

The steady‐state levels of tRNAHis and tRNAAsp are not affected in the Q1 mice and between female and male hippocampi. 5S rRNA was used as a loading control. Data are represented as mean ± SD; n = 3 female and 3 male biological replicates.
Representative polysome profiling tracks and quantification of polysomal fractions (wt: n = 2 male and 1 female, Q1: n = 2 male and 2 female) from hippocampi lysates of the 7‐ to 8‐month‐old mice. Data are represented as mean ± SD.
Metagene plot of 27–30 mer ribosome footprints in all biological replicates.
Periodicity bar plot. 27–30 nt footprints from female mouse (WT.f.2) are given as an example.
Venn diagram showing the overlap between Q1 and wild‐type mRNA‐matching footprints in male (n = 2) and female (n = 3) mice.
The Q‐tRNAHis level is similar between male and female mice. HeLa cell culture system was used for comparison. ‐q: serum‐free medium, +q: serum‐free medium supplemented with 20 nM queuine. 5S rRNA is shown as a loading control. Q‐tRNA content was quantified by dividing the amount of Q‐tRNA by total amount of detected tRNA. Data are represented as mean ± SD; n = 3 female and 3 male biological replicates.
Venn diagram showing the overlap between RD dysregulated transcripts in males (n = 2) and females (n = 3).

Western blot analysis showing increased levels of ubiquitinylated RPS10 and RPS20 upon loss of Q in the 8‐month‐old hippocampi. RPS3 shows no detectable modifications. β‐Actin was used as a loading control. The level of bands corresponding to ubiquitinylated RPS10 and RPS20 was quantified and the signal was normalized to β‐Actin. Error bars represent ±SD (n = 6, 3 males and 3 females). *P‐value < 0.05, two‐tailed unpaired t‐test.
Western blot analysis showing increased levels of phosphorylated eIF2α upon loss of Q in the 8‐month‐old female Q1 liver. β‐Actin and global eIF2α levels were used as loading controls. For the quantification of the level of eIF2α phosphorylation, the signal was normalized to total eIF2α. Error bars represent ±SD; (n = 6, 3 males and 3 females). **P‐value < 0.01, two‐tailed unpaired t‐test.
Gene ontology analysis of the deregulated proteins. The top 10 molecular functions are presented. Adjusted P‐value was calculated using Benjamini–Hochberg method.
References
-
- Benavides‐Piccione R, Regalado‐Reyes M, Fernaud‐Espinosa I, Kastanauskaite A, Tapia‐Gonzalez S, Leon‐Espinosa G, Rojo C, Insausti R, Segev I, DeFelipe J (2020) Differential structure of hippocampal CA1 pyramidal neurons in the human and mouse. Cereb Cortex 30: 730–752 - PubMed
Publication types
MeSH terms
Substances
Associated data
- Actions
LinkOut - more resources
Full Text Sources
Molecular Biology Databases

