. 2023 Oct 17;148(16):1231-1249.
doi: 10.1161/CIRCULATIONAHA.123.064181. Epub 2023 Aug 23.

Abnormal Lymphatic Sphingosine-1-Phosphate Signaling Aggravates Lymphatic Dysfunction and Tissue Inflammation

Affiliations

Abnormal Lymphatic Sphingosine-1-Phosphate Signaling Aggravates Lymphatic Dysfunction and Tissue Inflammation

Dongeon Kim et al. Circulation. .

Abstract

Background: Lymphedema is a global health problem with no effective drug treatment. Enhanced T-cell immunity and abnormal lymphatic endothelial cell (LEC) signaling are promising therapeutic targets for this condition. Sphingosine-1-phosphate (S1P) mediates a key signaling pathway required for normal LEC function, and altered S1P signaling in LECs could lead to lymphatic disease and pathogenic T-cell activation. Characterizing this biology is relevant for developing much needed therapies.

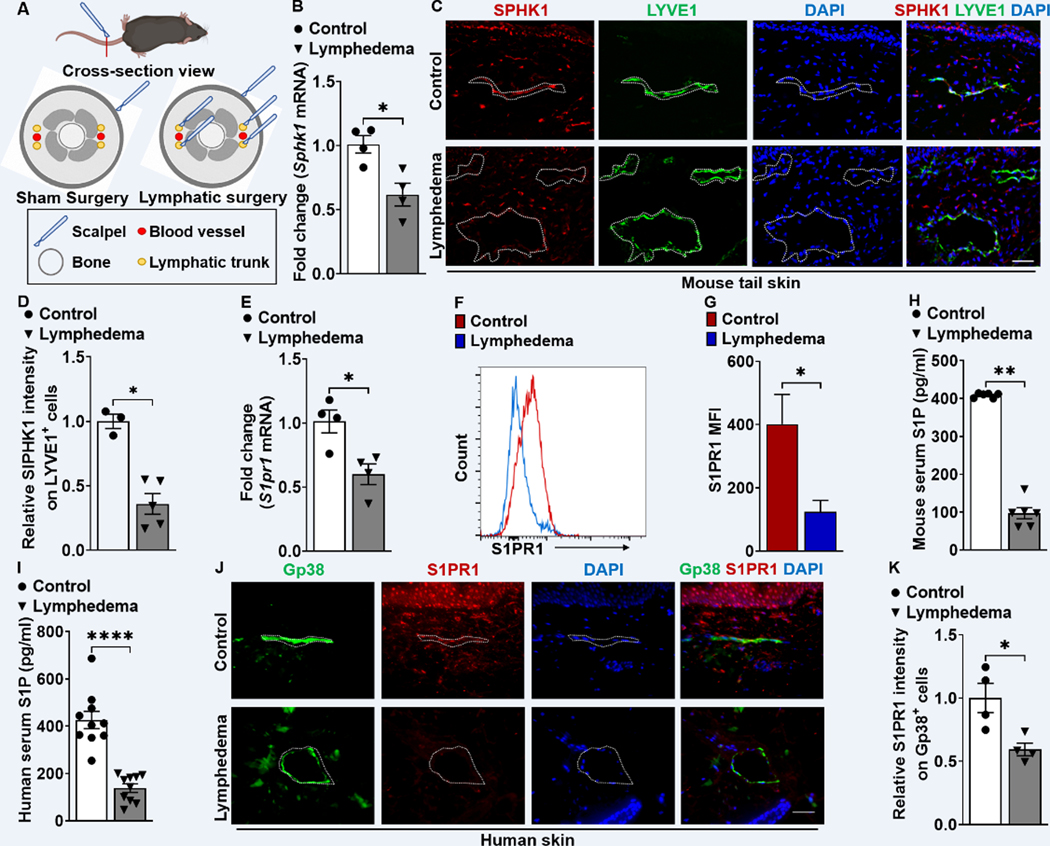
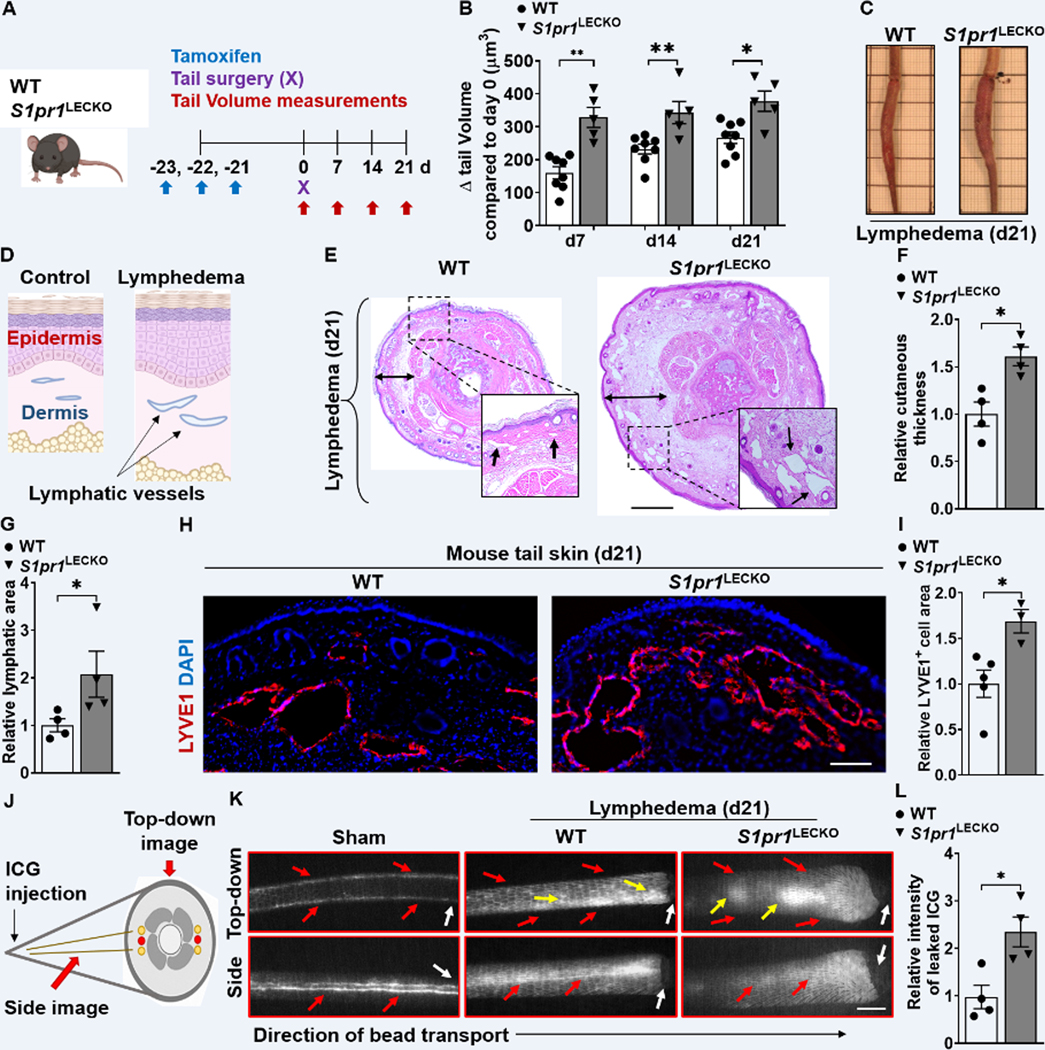
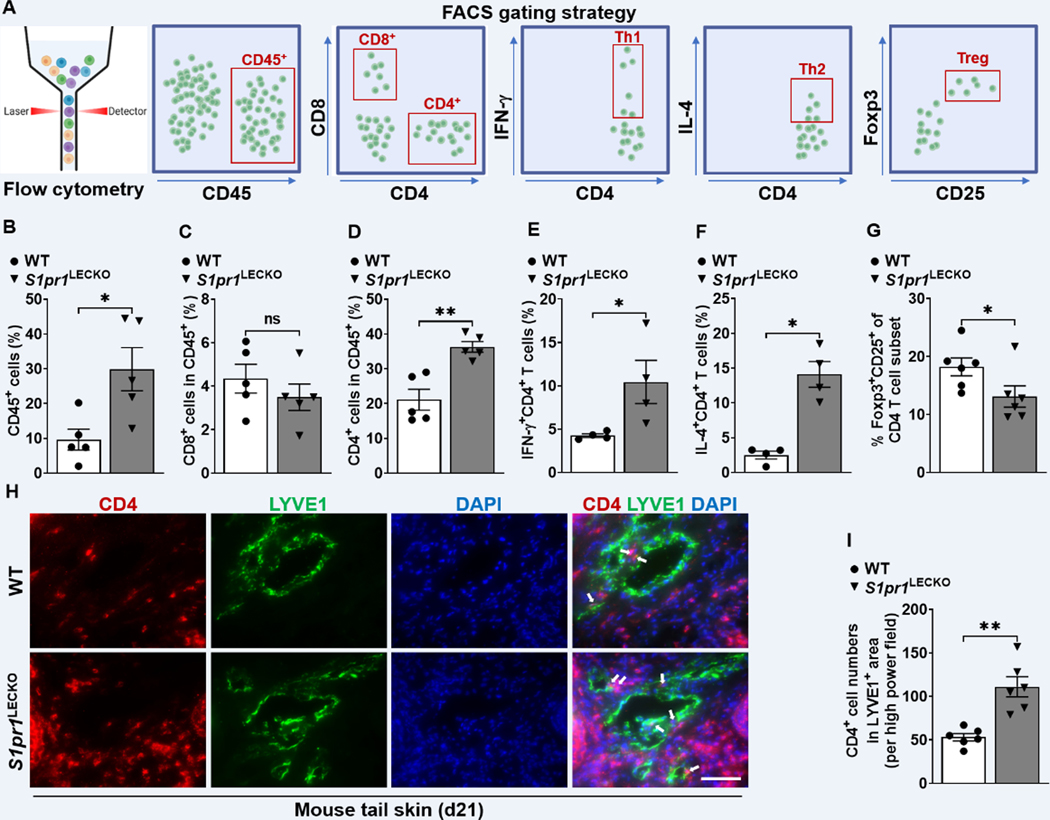
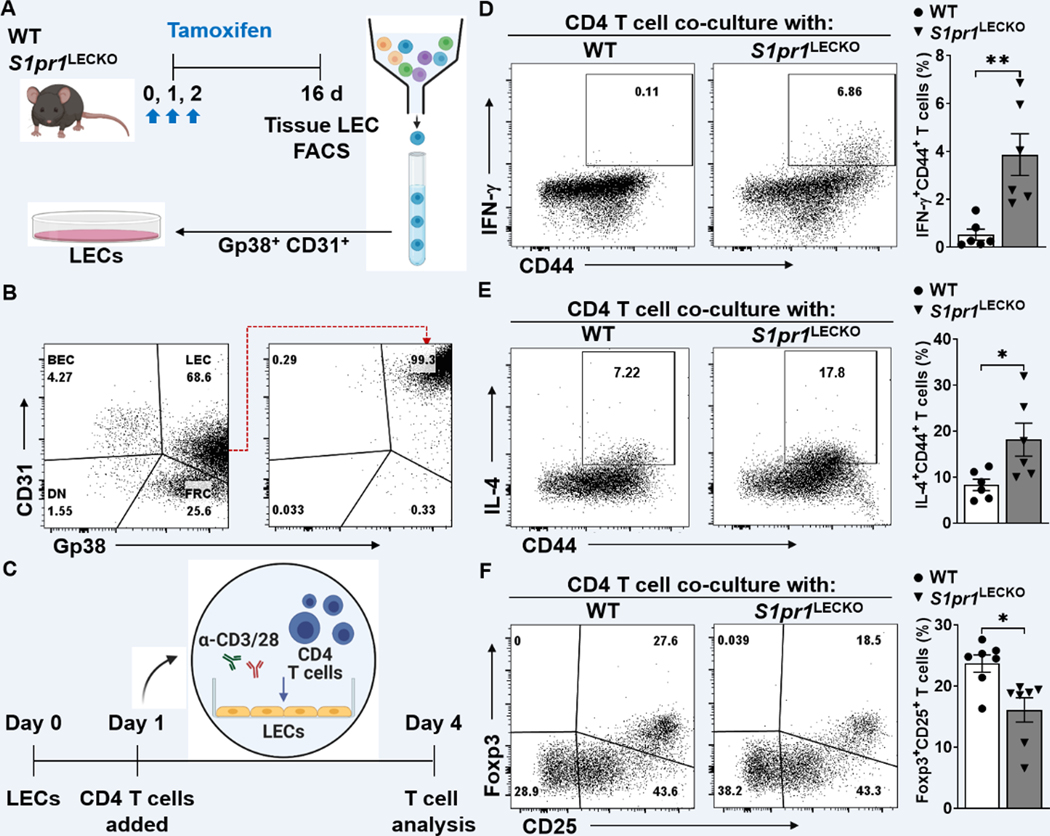
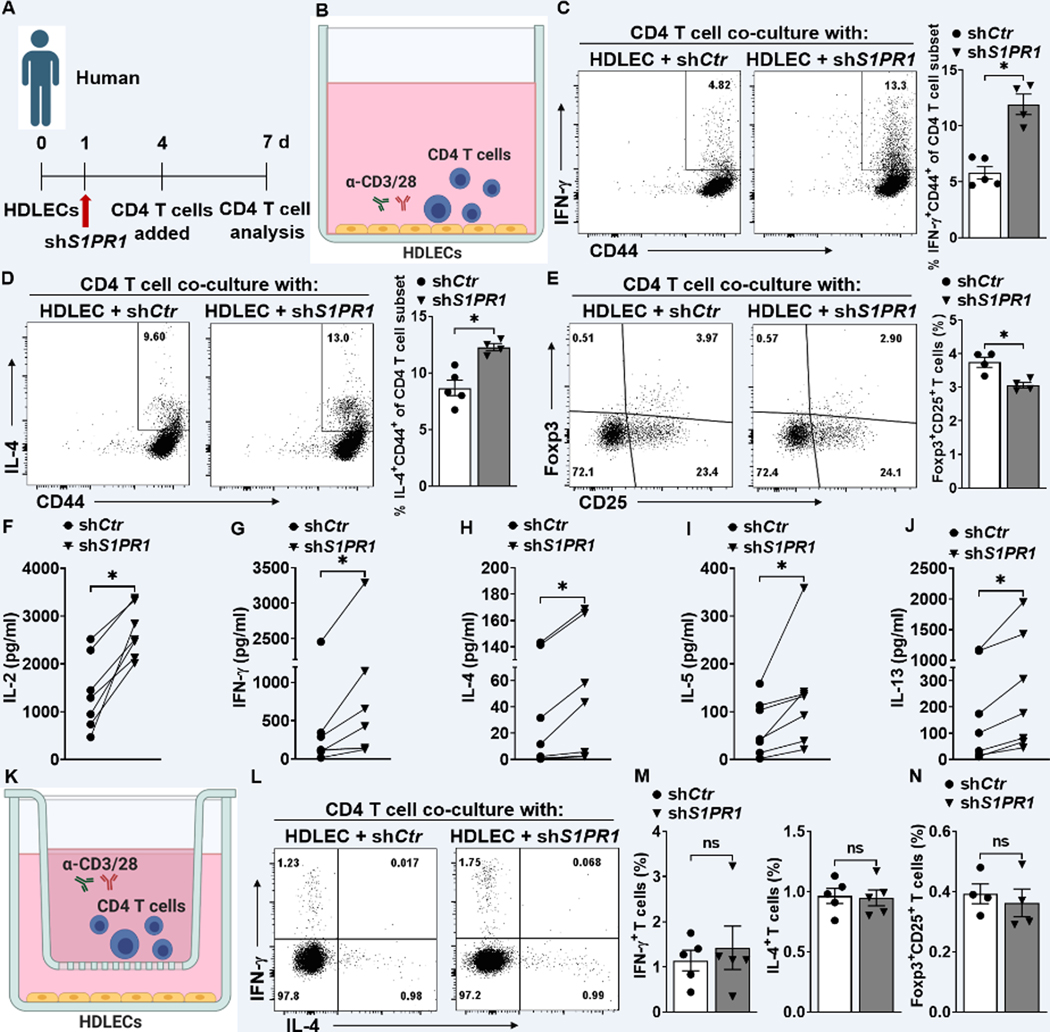
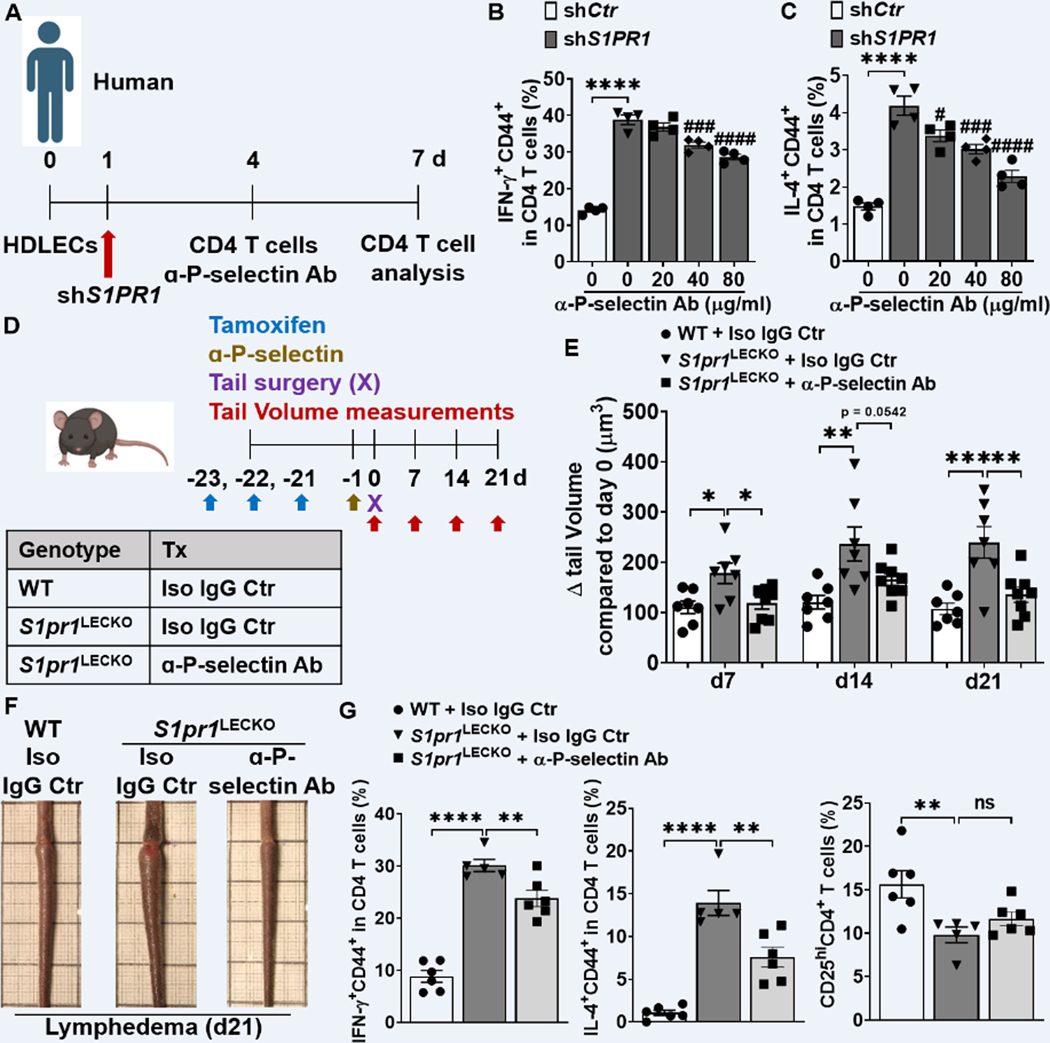
Methods: Human and mouse lymphedema was studied. Lymphedema was induced in mice by surgically ligating the tail lymphatics. Lymphedematous dermal tissue was assessed for S1P signaling. To verify the role of altered S1P signaling effects in lymphatic cells, LEC-specific S1pr1-deficient (S1pr1LECKO) mice were generated. Disease progression was quantified by tail-volumetric and -histopathologic measurements over time. LECs from mice and humans, with S1P signaling inhibition, were then cocultured with CD4 T cells, followed by an analysis of CD4 T-cell activation and pathway signaling. Last, animals were treated with a monoclonal antibody specific to P-selectin to assess its efficacy in reducing lymphedema and T-cell activation.

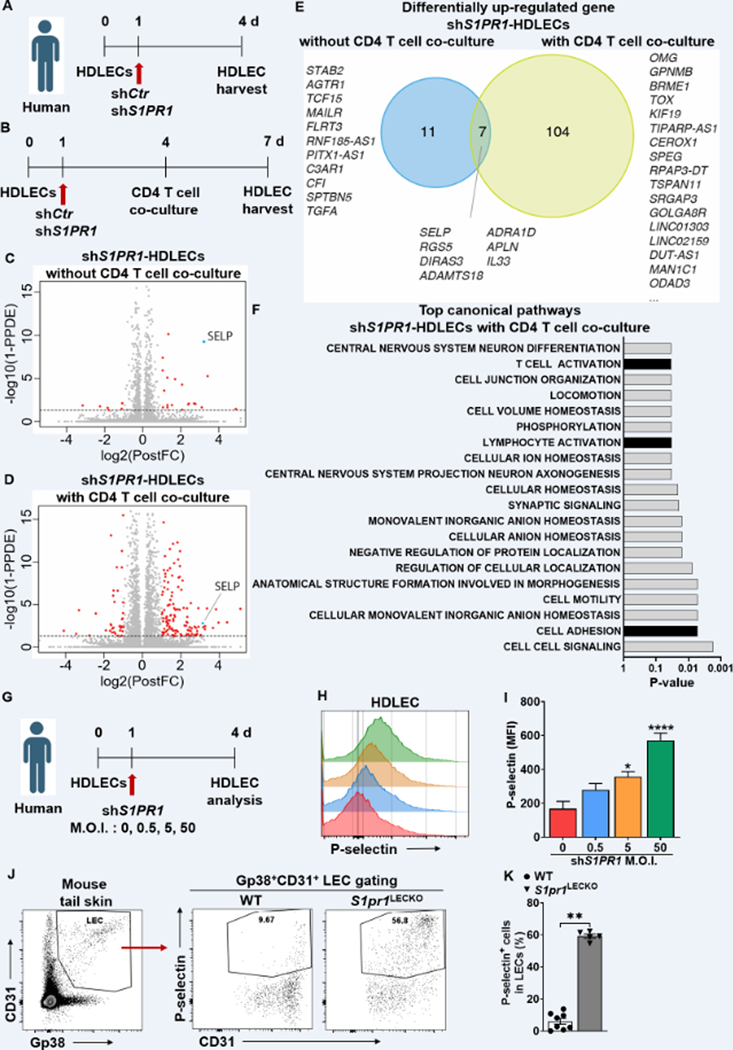
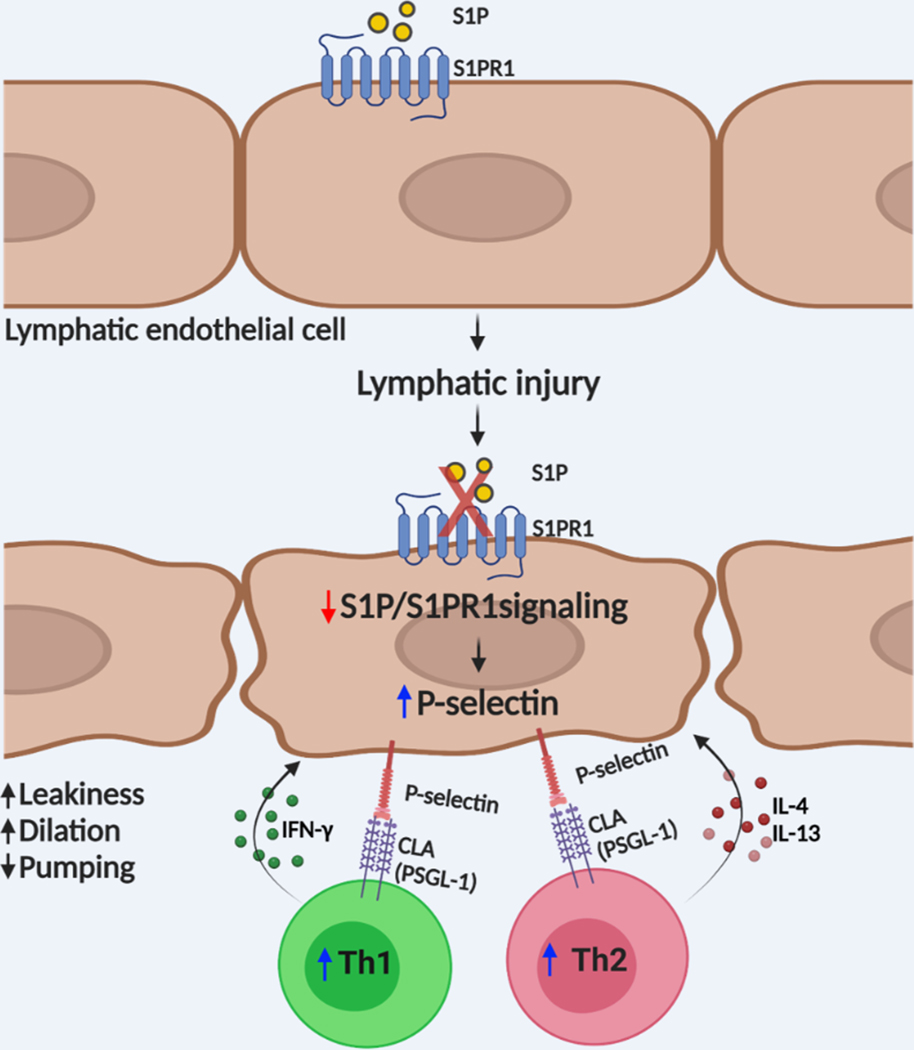
Results: Human and experimental lymphedema tissues exhibited decreased LEC S1P signaling through S1P receptor 1 (S1PR1). LEC S1pr1 loss-of-function exacerbated lymphatic vascular insufficiency, tail swelling, and increased CD4 T-cell infiltration in mouse lymphedema. LECs, isolated from S1pr1LECKO mice and cocultured with CD4 T cells, resulted in augmented lymphocyte differentiation. Inhibiting S1PR1 signaling in human dermal LECs promoted T-helper type 1 and 2 (Th1 and Th2) cell differentiation through direct cell contact with lymphocytes. Human dermal LECs with dampened S1P signaling exhibited enhanced P-selectin, an important cell adhesion molecule expressed on activated vascular cells. In vitro, P-selectin blockade reduced the activation and differentiation of Th cells cocultured with shS1PR1-treated human dermal LECs. P-selectin-directed antibody treatment improved tail swelling and reduced Th1/Th2 immune responses in mouse lymphedema.

Conclusions: This study suggests that reduction of the LEC S1P signaling aggravates lymphedema by enhancing LEC adhesion and amplifying pathogenic CD4 T-cell responses. P-selectin inhibitors are suggested as a possible treatment for this pervasive condition.

Keywords: P-selectin; T lymphocytes; lymphatic endothelial cells; lymphedema; sphingosine-1-phosphate receptors 1.


Conflict of interest statement

Disclosures None.

Figures

Figure 1.
Figure 1.. S1PR1 signaling of LECs is reduced in both mouse and human lymphedema skin.
(A) Acquired lymphedema was surgically induced in the tails of C57BL/6J mice through thermal ablation of lymphatic trunks. Skin incision, alone, was performed in sham surgery groups. (B) RT-qPCR analysis of Sphk1 mRNA levels in tail skin from control sham surgery mice or animals subjected to lymphatic surgery (n = 4 per each group). (C) Representative immunofluorescence (IF) staining of SPHK1 (red) and LYVE1 (green) of the skin tissues harvested from control or lymphedema mice. DAPI (blue) stains for the nucleus. Scale bar = 40 μm. (D) Quantification of the SPHK1 staining intensity comparing groups shown in C (n ≥ 3 per each group). (E) RT-qPCR analysis of S1pr1 mRNA levels in tail skin from control sham surgery mice or lymphedema mice (n = 4 per each group). (F and G) Flow cytometry histograms show the mean fluorescence intensity of S1PR1 on LEC (Gp38+CD31+) population. Representative (F) and compiling data (G) are shown (n ≥ 3 per each group). (H and I) The serum concentration of S1P in mouse (H) and human (I) lymphedema (n = 10 per each group). (J) Representative IF staining of Gp38 (green) and S1PR1 (red) of the human skin from healthy control or lymphedema. DAPI (blue) stains for the nucleus. Scale bar = 50 μm. (K) Quantification of the S1PR1 intensity comparing groups shown in J (n = 4 per each group). Data are presented as mean ± SEM; * p < 0.05, ** p < 0.01, and **** p < 0.0001 by the Mann-Whitney test.
Figure 2.
Figure 2.. LEC-specific S1pr1 deficiency exaggerates tissue swelling, augments cutaneous skin thickness, promotes lymphatic leakage, and reduces lymphatic drainage.
(A) Schematic diagram of the experimental protocol. (B) Quantification of tail volume changes over time of WT and S1pr1LECKO mice after lymphatic surgery (n ≥ 5 per each group). (C) Representative photographs of tails 21d following lymphatic surgery. (D) A cartoon showing the cross-section view of mouse-tail skin with or without lymphedema. (E toG) H&E staining of tail cross-section 21d following lymphatic surgery. Representative images (E) are shown. Black arrows indicate lymphatic vessel areas. Double-headed black arrows demonstrate cutaneous thickness. Quantification of cutaneous thickness (F) and lymphatic vessel luminal areas (G) are shown (n = 4 per each group). Scale bar = 1 mm. (H and I) Immunofluorescent images of LYVE1 (red) of tail skin 21d after surgery. Representative image (H) and quantification of the LYVE1 area data (I) are shown (n ≥ 3 per each group). DAPI (blue) stains the nucleus. Scale bar = 100 μm. (J) A cartoon showing one side of the mouse tail with two-line lymphatic trunks. (K and L) Near-infrared imaging 21d following lymphatic surgery after ICG injection near the tip of the tail. Representative images (K) are shown. White arrows denote surgical sites. Red arrows indicate ICG drainage. Yellow arrows indicate ICG leakage. Scale bar = 0.5 cm. Quantification of leakage (L) is shown (n = 4 per each group). Data are presented as the mean ± SEM; * p < 0.05 and ** p < 0.01 by the Mann-Whitney test. ICG; indocyanine green.
Figure 3.
Figure 3.. LEC S1pr1 deficiency promotes CD4 T cell infiltration following lymphatic surgery.
(A) Flow cytometric gating scheme for determining tail skin immune cell populations. Flow cytometric analysis was performed d21 after lymphatic surgery. (B-G) Quantification of CD45+ cells (B), CD8+ T cells, (C), CD4+ T cells (D), CD4+IFN-ɣ+ Th1 cells (E), CD4+IL-4+ Th2 cells (F), and Foxp3+CD25+CD4+ Treg cells (G) in tail skin (n ≥ 4 per each group). (H) Representative IF staining of CD4 (red) and LYVE1 (green) of the lymphedema mouse tail skin from WT or S1pr1LECKO mice. DAPI (blue) stains for the nucleus. Arrows indicate CD4 T cells surrounding lymphatic vessels. Scale bar = 50 μm. (I) Quantification of the CD4 T cell staining presented in H (n ≥ 5 per each group). Data are presented as mean ± SEM; * p < 0.05, ** p < 0.01, and ns (not significant) by the Mann-Whitney test.
Figure 4.
Figure 4.. Decreased S1PR1 signaling in LECs promotes T cell activation.
(A) Schematic diagram of LEC (Gp38+CD31+) purification. (B) Representative flow cytometry sorting strategy for the isolation of LECs from cultured lymph node stromal cells. (C) Timeline of co-culture with purified LECs and naïve CD4 T cells activating with to α-CD3/28 Abs. LECs to T cell ratio was 1:5. (D-F) Flow cytometric analysis was performed d4 after co-culture. Representative flow cytometric plots and quantification of IFN-ɣ+CD44+ in CD4+ T cells (D), IL-4+CD44+ in CD4+ T cells (E), and Foxp3+CD25+ in CD4+ T cells (F) (n ≥ 6 per each group). Data are presented as mean ± SEM; * p < 0.05 and ** p < 0.01 by the Mann-Whitney test.
Figure 5.
Figure 5.. Abnormal lymphatic S1PR1 signaling activates lymphocytes through direct cell-cell contact.
(A) Timeline of the co-culture of purified naïve CD4 T cells and HDLECs. (B) shCtr or shS1PR1-treated HDLECs were co-cultured with purified human naïve CD4 T cells activating with α-CD3/28 Abs. LEC to T cell ratio was 1:5. (C to E) After 3 days of culture, human CD4 T cells were intracellularly stained for IFN-ɣ, IL-4, and Foxp3. Representative flow cytometric plots and quantification of IFN-ɣ+CD44+ in CD4+ T cells (C), IL-4+CD44+ in CD4+ T cells (D), and Foxp3+CD25+ T cells (E) (n ≥ 4 per each group). (F to J) T cell-related cytokines were detected in supernatant from co-cultured cells (n = 7 per each group). (K) HDLECs treated with shCtr or shSPR1 were co-cultured with human naïve CD4 T cells in 0.4 μm membrane pore trans-well in the presence of α-CD3/28 antibody for 3 days. (L and M) Representative flow cytometric plots (L) and compiling data (M) of intracellular IFN-ɣ+ and IL-4+ cells in the CD4+ T cell population cultured in a trans-well system (n ≥ 5 per each group). (N) Representative flow cytometric plots intracellular Foxp3+CD25+ T cells in a trans-well system. (n ≥ 4 per each group). Data are presented as mean ± SEM; * p < 0.05 and ns (not significant) by the Mann-Whitney test for C, D, E, M, and N; by Wilcoxon matched-pairs signed rank test for F, G, H, I, and J.
Figure 6.
Figure 6.. The effects of abnormal S1PR1 signaling on lymphatic biology.
(A and B) Timeline of HDLEC treatment and harvesting time point. RNA was extracted from HDLEC without (A) or with (B) purified naïve CD4 T cell co-culture with α-CD3/28 Ab stimulation. (C and D) Volcano plot identifying genes significantly up-regulated (red) in shS1PR1-treted HDLECs versus shCtr-treated HDLECs. (C) 18 upregulated genes from HDLECs without CD4 T cell co-culture. (D) 111 upregulated genes from HDLECs with CD4 T cell co-culture. (E) Venn diagram shows data summary of differentially up-regulated genes from RNA-seq data comparing shS1PR1-treated HDLECs with or without CD4 T cell co-culture. Threshold of false discovery rate < 0.05. (F) KEGG pathway enrichment analysis of differentially up-regulated gene between shCtr-treated HDLEC and shS1PR1-treated HDLEC with CD4 T cell co-culture. Most significantly upregulated pathways are shown. (G) Timeline of M.O.I. dependence shS1PR1 treatment to HDLECs. (H and I) P-selectin fluorescence intensity in HDLECs after S1PR1 knock-down was evaluated by flow cytometric analysis. Representative (H) and compiling data (I) are shown (n ≥ 4 per each group). (J and K) Flow cytometric analysis was performed from tail skin of WT and S1pr1LECKO mice. Representative flow cytometric plots (J) and quantification of P-selectin+ LECs in tail tissue skin (K) (n ≥ 4 per each group). Data for I are presented as the mean ± SEM; * p < 0.05 and **** p < 0.0001 compared with the shCtr-treated HDLECs group; by Ordinary one-way ANOVA. Data for K are presented as the mean ± SEM; ** p < 0.01 compared with the WT group; by Mann-Whitney test. KEGG; Kyoto Encyclopedia of Genes and Genomes. M.O.I.; multiplicity of infection.
Figure 7.
Figure 7.. Blocking P-selectin decreases CD4 T cell activation and lymphedema.
(A) Timeline of the co-culture of purified naïve CD4 T cells and HDLEC. ɑ-human P-selectin Ab (Waps12.2) was added to shS1PR1-treated HDLECs 1h before purified memory CD4 T cell co-culture with HDLECs at day 4. (B and C) Flow cytometric analysis was performed d3 after co-culture. Quantification of IFN-ɣ+CD44+ in CD4+ T cells (B), IL-4+CD44+ in CD4+ T cells (C) (n = 4 per each group). (D) Schematic diagram of the experimental protocol. 5 mg/kg anti-mouse P-selectin Ab (RB40.34.4) or Isotype IgG control (Iso IgG Ctr) was retro-orbital-i.v. injected into S1pr1LECKO mice 1 day before lymphedema surgery and the tail size of animals was measured at days 0, 7, 14, and 21. (E and F) Quantification of tail volume changes (E) (n ≥ 7 per each group). Representative photographs of tail skin on day 21 after surgery (F). (G) Quantification of IFN-ɣ+CD44+, IL-4+CD44+, and CD25hi in CD4+ T cells from tail skin 21 day after lymphedema surgery (n ≥ 5 per each group). Data B and C are presented as the mean ± SEM; **** p < 0.0001, # p < 0.05, ### p < 0.001, and #### p < 0.0001 compared with the shS1PR1-treated HDLEC group; by Ordinary one-way ANOVA. Data in E and G are presented as mean ± SEM; * p < 0.05, ** p < 0.01, *** p < 0.001, **** p < 0.0001, and ns (not significant) compared with the S1pr1LECKO + Iso Ctr group; by Ordinary one-way ANOVA.
Figure 8.
Figure 8.. LEC S1PR1 signaling in lymphedema pathogenesis.
Graphic abstract showing how abnormal lymphatic endothelial cell (LEC) S1P signaling can induce T cell activation and lymphedema after lymphatic injury. Lymphatic injury caused LEC S1P-S1PR1 signaling reduction. These changes collectively induce P-selectin expression on LECs resulting in CD4 T cell overactivation.

Update of

Comment in

References

    1. Rockson SG. Lymphedema after Breast Cancer Treatment. N Engl J Med. 2018;379:1937–1944. doi: 10.1056/NEJMcp1803290 - DOI - PubMed
    1. Rockson SG. Diagnosis and management of lymphatic vascular disease. J Am Coll Cardiol. 2008;52:799–806. doi: 10.1016/j.jacc.2008.06.005 - DOI - PubMed
    1. Kataru RP, Baik JE, Park HJ, Wiser I, Rehal S, Shin JY, Mehrara BJ. Regulation of Immune Function by the Lymphatic System in Lymphedema. Front Immunol. 2019;10:470. doi: 10.3389/fimmu.2019.00470 - DOI - PMC - PubMed
    1. Li CY, Kataru RP, Mehrara BJ. Histopathologic Features of Lymphedema: A Molecular Review. Int J Mol Sci. 2020;21. doi: 10.3390/ijms21072546 - DOI - PMC - PubMed
    1. Mehrara BJ, Park HJ, Kataru RP, Bromberg J, Coriddi M, Baik JE, Shin J, Li C, Cavalli MR, Encarnacion EM, et al. Pilot Study of Anti-Th2 Immunotherapy for the Treatment of Breast Cancer-Related Upper Extremity Lymphedema. Biology (Basel). 2021;10. doi: 10.3390/biology10090934 - DOI - PMC - PubMed

Publication types