

Predicting ion mobility collision cross sections using projection approximation with ROSIE-PARCS webserver
- PMID: 37609950
- PMCID: PMC10516336
- DOI: 10.1093/bib/bbad308
Predicting ion mobility collision cross sections using projection approximation with ROSIE-PARCS webserver
Abstract
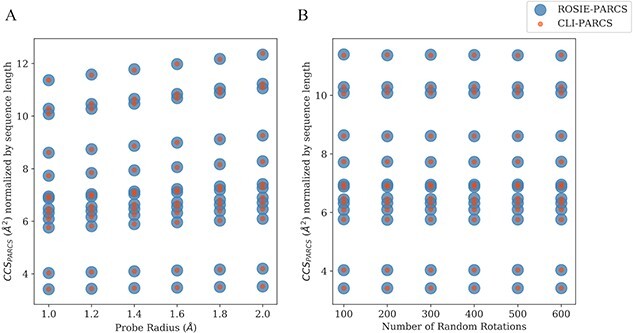
Ion mobility coupled to mass spectrometry informs on the shape and size of protein structures in the form of a collision cross section (CCSIM). Although there are several computational methods for predicting CCSIM based on protein structures, including our previously developed projection approximation using rough circular shapes (PARCS), the process usually requires prior experience with the command-line interface. To overcome this challenge, here we present a web application on the Rosetta Online Server that Includes Everyone (ROSIE) webserver to predict CCSIM from protein structure using projection approximation with PARCS. In this web interface, the user is only required to provide one or more PDB files as input. Results from our case studies suggest that CCSIM predictions (with ROSIE-PARCS) are highly accurate with an average error of 6.12%. Furthermore, the absolute difference between CCSIM and CCSPARCS can help in distinguishing accurate from inaccurate AlphaFold2 protein structure predictions. ROSIE-PARCS is designed with a user-friendly interface, is available publicly and is free to use. The ROSIE-PARCS web interface is supported by all major web browsers and can be accessed via this link (https://rosie.graylab.jhu.edu).
Keywords: AlphaFold2; collision cross section; ion mobility; mass spectrometry; protein structure prediction; webserver.
© The Author(s) 2023. Published by Oxford University Press. All rights reserved. For Permissions, please email: journals.permissions@oup.com.
Figures


Similar articles
-
Technological aids for the rehabilitation of memory and executive functioning in children and adolescents with acquired brain injury.Cochrane Database Syst Rev. 2016 Jul 1;7(7):CD011020. doi: 10.1002/14651858.CD011020.pub2. Cochrane Database Syst Rev. 2016. PMID: 27364851 Free PMC article.
-
A New Measure of Quantified Social Health Is Associated With Levels of Discomfort, Capability, and Mental and General Health Among Patients Seeking Musculoskeletal Specialty Care.Clin Orthop Relat Res. 2025 Apr 1;483(4):647-663. doi: 10.1097/CORR.0000000000003394. Epub 2025 Feb 5. Clin Orthop Relat Res. 2025. PMID: 39915110
-
Does the Presence of Missing Data Affect the Performance of the SORG Machine-learning Algorithm for Patients With Spinal Metastasis? Development of an Internet Application Algorithm.Clin Orthop Relat Res. 2024 Jan 1;482(1):143-157. doi: 10.1097/CORR.0000000000002706. Epub 2023 Jun 12. Clin Orthop Relat Res. 2024. PMID: 37306629 Free PMC article.
-
Effectiveness and cost-effectiveness of computer and other electronic aids for smoking cessation: a systematic review and network meta-analysis.Health Technol Assess. 2012;16(38):1-205, iii-v. doi: 10.3310/hta16380. Health Technol Assess. 2012. PMID: 23046909
-
Short-Term Memory Impairment.2024 Jun 8. In: StatPearls [Internet]. Treasure Island (FL): StatPearls Publishing; 2025 Jan–. 2024 Jun 8. In: StatPearls [Internet]. Treasure Island (FL): StatPearls Publishing; 2025 Jan–. PMID: 31424720 Free Books & Documents.
Cited by
-
Collision cross section measurement and prediction methods in omics.J Mass Spectrom. 2023 Sep;58(9):e4973. doi: 10.1002/jms.4973. Epub 2023 Aug 24. J Mass Spectrom. 2023. PMID: 37620034 Free PMC article. Review.
-
The catalytic domain of free or ligand bound histone deacetylase 4 occurs in solution predominantly in closed conformation.Protein Sci. 2024 Mar;33(3):e4917. doi: 10.1002/pro.4917. Protein Sci. 2024. PMID: 38358265 Free PMC article.
References
-
- Wyttenbach T, Bowers MT. Structural stability from solution to the gas phase: native solution structure of ubiquitin survives analysis in a solvent-free ion mobility-mass spectrometry environment. J Phys Chem B 2011;115:12266–75. - PubMed
-
- Ruotolo BT, Robinson CV. Aspects of native proteins are retained in vacuum. Curr Opin Chem Biol 2006;10:402–8. - PubMed
-
- Bleiholder C, Liu FC. Structure relaxation approximation (SRA) for elucidation of protein structures from ion mobility measurements. J Phys Chem B 2019;123:2756–69. - PubMed
-
- Leney AC, Heck AJR. Native mass spectrometry: what is in the name? J Am Soc Mass Spectrom 2017;28:5–13. - PubMed
Publication types
MeSH terms
Substances
Grants and funding
LinkOut - more resources
Full Text Sources
