Pregnancy-induced transfer of pathogen-specific T cells from mother to fetus in mice
- PMID: 37610043
- PMCID: PMC10561172
- DOI: 10.15252/embr.202356829
Pregnancy-induced transfer of pathogen-specific T cells from mother to fetus in mice
Abstract
Neonatal health is determined by the transfer of maternal antibodies from the mother to the fetus. Besides antibodies, maternal cells cross the placental barrier and seed into fetal organs. Contrary to maternal antibodies, maternal microchimeric cells (MMc) show a high longevity, as they can persist in the offspring until adulthood. Recent evidence highlights that MMc leukocytes promote neonatal immunity against early-life infections in mice and humans. As shown in mice, this promotion of immunity was attributable to an improved fetal immune development. Besides this indirect effect, MMc may be pathogen-specific and thus, directly clear pathogen threats in the offspring postnatally. By using ovalbumin recombinant Listeria monocytogenes (LmOVA), we here provide evidence that OVA-specific T cells are transferred from the mother to the fetus, which is associated with increased activation of T cells and a milder course of postnatal infection in the offspring. Our data highlight that maternally-derived passive immunity of the neonate is not limited to antibodies, as MMc have the potential to transfer immune memory between generations.
Keywords: immunological memory; intrauterine transfer; maternal microchimerism; pregnancy.
© 2023 The Authors. Published under the terms of the CC BY 4.0 license.
Conflict of interest statement
The authors declare that they have no conflict of interest.
Figures
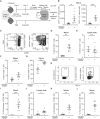
- A
Experimental approach.
- B
Numbers of CD4+ and CD8+ in 1 × 10⁶ uterine cells on gd 18.5 after preconceptual infection of the mother in comparison with non‐infected mothers (n = 7, n = 9, n: biological replicates). T cells were identified as CD45+CD3+ and either CD4+ or CD8+ cells.
- C
Representative dot plots of CD8+ T cells from peripheral blood divided in CD44+CD62L− effector/effector memory (EM), CD44+CD62L+ central memory (CM), and CD44−CD62L+ naïve subpopulations. Left: non‐infected pregnant control mouse, right: previously infected pregnant mouse.
- D–G
Percentage of EM T cells (CD44+, CD62L−) among CD8+ T cells; (D) peripheral blood (n = 6, n = 9), (E) uterus‐draining lymph nodes (n = 6, n = 9), (F) spleen (n = 7, n = 8), (G) uterus (n = 7 each); n: biological replicates.
- H
Representative dot plots of ovalbumin‐specific CD8+ EM T cells stained with H‐2Kb ovalbumin257‐264 tetramers (OVA tetramers) from peripheral blood. Left: non‐infected pregnant control mouse, right: previously infected pregnant mouse.
- I–L
Percentage of ovalbumin‐specific CD8+ EM T cells; (I) peripheral blood (n = 7, n = 9), (J) uterus‐draining lymph nodes (n = 7, n = 9), (K) spleen (n = 8 each), (L) uterus (n = 6, n = 9); n: biological replicates.
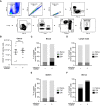
- A
Gating strategy of CD8+ T effector/effector memory cells. Blood of pregnant mice at gd 18.5 after preconceptual infection.
- B
Number of CD45+ cells in 1 × 10⁶ uterine cells on gd 18.5 after preconceptual infection of mothers in comparison with naïve mothers (n = 7 each, n: biological replicates).
- C–F
Percentage of CD8+ T cell subpopulations: CD44+CD62L− effector/effector memory (EM), CD44+CD62L+ central memory (CM), CD44−CD62L+ naïve; (C) peripheral blood (n = 6, n = 9), (D) uterus‐draining lymph nodes (n = 6, n = 9), (E) spleen (n = 8, n = 7), (F) uterus (n = 7 each); n: biological replicates.
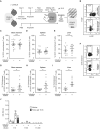
- A
Infection and mating strategy and identification strategy for maternal microchimeric cells (MMc) in offspring of CD45.2+ H‐2Db+ C57BL/6 females mated with CD45.1+ H‐2Dd+ Balb/c males.
- B
Representative dot plots of column bound ‘non‐MMc’ fraction (upper) and ‘MMc‐enriched’ flow‐through fraction (lower) after negative selection of MMc via antibody labeling of paternal H‐2Dd and magnetic‐activated cell sorting (MACS) gated on CD45.2+CD45.1− cells.
- C–E
Percentage of CD3+ T cells of total MMc; (C) fetal bone marrow (n = 13, n = 14), (D) fetal spleen (n = 12, n = 13), (E) fetal liver (n = 13, n = 14); n: biological replicates.
- F
Representative dot plots for OVA‐tetramer staining of CD3+ MMc from spleens of fetuses of previously infected or non‐infected mothers.
- G–I
Percentage of OVA‐specific MMc stained with OVA tetramers among CD3+ microchimeric T cells; (G) bone marrow (n = 13 each), (H) spleen (n = 12 each), (I) liver (n = 11, n = 12); n: biological replicates.
- J
Serum anti‐Lm IgG titer of mothers and fetuses at gd 18.5 after preconceptual infection of the mother with LmOVA; n = 3 biological replicates, each averaged from n = 2 technical replicates).
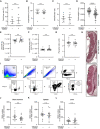
- A–D
Pregnancy outcome parameter: (B) Percentage of fetal loss rate (n = 8, n = 9); (C) Number of implantations on gd 18.5 (n = 7, n = 9); (D) Male/female ratio of offspring (n = 6, n = 7); (E) Fetal weight on gd 18.5 (n = 54, n = 55); n: biological replicates.
- E–G
Placental evaluation: (E) Area of placental labyrinth (L) (n = 12 each); (F) Area of placental junctional zone (JZ) (n = 12–13); (G) Ratio of placental labyrinth to the junctional zone (L/JZ ratio) as an indicator for placental function on gd 18.5 (n = 12 each); n: biological replicates.
- H
Representative depiction of murine placenta assessment, highlighted for labyrinth (L, white) and labyrinth + junctional zone (black). Scale bar = 1,000 μm.
- I
Gating strategy of ‘MMc‐enriched’ flow‐through. Bone marrow of fetal mice at gd 18.5 born to a preconceptually infected mother.
- J–L
Numbers of MMc in 1 × 10⁶ fetal cells on gd 18.5; (J) bone marrow (n = 14, n = 13), (K) spleen (n = 14, n = 12), (L) liver (n = 13, n = 12); n: biological replicates.
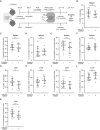
- A
Experimental approach.
- B–F
Percentages of innate immune cell subsets in the fetal spleen; (B) CD45+ leukocytes (n = 20, n = 11), (C) CD45+CD11b+ myeloid cells (n = 19, n = 11), (D) CD45+CD11b+Gr‐1− monocytes (n = 19, n = 11), (E) CD45+CD11b+Gr‐1+ neutrophils (n = 19, n = 11) and (F) CD45+CD11b+F4/80+ macrophages (n = 20, n = 11); n: biological replicates.
- G–K
Percentages of innate immune cell subsets in the fetal liver; (G) CD45+ leukocytes (n = 20, n = 10), (H) CD45+CD11b+ myeloid cells (n = 20, n = 10), (I) CD45+CD11b+Gr‐1− monocytes (n = 20, n = 10), (J) CD45+CD11b+Gr‐1+ neutrophils (n = 20, n = 10) and (K) CD45+CD11b+F4/80+ macrophages (n = 20, n = 10); n: biological replicates.
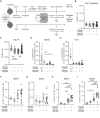
- A
Experimental approach.
- B, C
Neonatal body weight in mg (n = 20–55). (B) Day 7 after birth (day of infection), (C) day 14 after birth (7 days after infection); n: biological replicates.
- D, E
Percentages of OVA tetramer+ cells among CD3+ MMc (percentages of OVA tetramer+ among CD3+ MMc at gd 18.5 (Fig 2H and I) are included for direct comparison); (D) spleen (n = 5–10), (E) liver (n = 5–10); n: biological replicates.
- F–I
Percentage of (F) CD3+ T cells of CD45+ spleen cells (n = 6–14), (G) OVA‐specific cells of CD3+ T cells from spleen cells (n = 6–14), (H) CD11b+ cells of CD3+ T cells from spleen cells (n = 6–14), and (I) CD11c+ cells of CD3+ T cells from spleen cells (n = 6–14); n: biological replicates.

- A
Body weight development after infection of neonates depicted as weight in mg.
- B, C
Neonatal body weight in mg (n = 20–55, n: biological replicates). (B) Day 9 after birth (2 days after infection), (C) day 12 after birth (5 days after infection).
- D, E
Number of MMc in 1 × 10⁶ fetal cells on day 7 after infection; (D) spleen (n = 6–14), (E) liver (n = 6–11); n: biological replicates.
- F, G
Percentage of CD3+ T cells among MMc; (F) spleen (n = 6–13), (G) liver (n = 6–12); n: biological replicates.
Similar articles
-
Vertically transferred maternal immune cells promote neonatal immunity against early life infections.Nat Commun. 2021 Aug 4;12(1):4706. doi: 10.1038/s41467-021-24719-z. Nat Commun. 2021. PMID: 34349112 Free PMC article.
-
Maternal microchimerism: lessons learned from murine models.J Reprod Immunol. 2015 Apr;108:12-25. doi: 10.1016/j.jri.2014.12.007. Epub 2015 Jan 8. J Reprod Immunol. 2015. PMID: 25638482 Review.
-
Pregnancy-induced maternal microchimerism shapes neurodevelopment and behavior in mice.Nat Commun. 2022 Aug 5;13(1):4571. doi: 10.1038/s41467-022-32230-2. Nat Commun. 2022. PMID: 35931682 Free PMC article.
-
Stem cell microchimerism and tolerance to non-inherited maternal antigens.Chimerism. 2010 Jul-Sep;1(1):2-10. doi: 10.4161/chim.1.1.12667. Chimerism. 2010. PMID: 21132055 Free PMC article.
-
Fetal microchimerism and the two-stage model of preeclampsia.J Reprod Immunol. 2023 Sep;159:104124. doi: 10.1016/j.jri.2023.104124. Epub 2023 Jul 25. J Reprod Immunol. 2023. PMID: 37541161 Review.
Cited by
-
Exposure to Human Immunodeficiency Virus Is Associated With Altered Composition of Maternal Microchimeric T Cells in Infants.J Infect Dis. 2025 Feb 20;231(2):435-439. doi: 10.1093/infdis/jiae521. J Infect Dis. 2025. PMID: 39435850
-
Deciphering the Role of Maternal Microchimerism in Offspring Autoimmunity: A Narrative Review.Medicina (Kaunas). 2024 Sep 5;60(9):1457. doi: 10.3390/medicina60091457. Medicina (Kaunas). 2024. PMID: 39336498 Free PMC article. Review.
-
From Womb to World: Exploring the Immunological Connections between Mother and Child.Immunohorizons. 2024 Aug 1;8(8):552-562. doi: 10.4049/immunohorizons.2400032. Immunohorizons. 2024. PMID: 39172025 Free PMC article. Review.
-
The when, what, and where of naturally-acquired microchimerism.Semin Immunopathol. 2025 Mar 11;47(1):20. doi: 10.1007/s00281-024-01029-2. Semin Immunopathol. 2025. PMID: 40067465 Review.
-
The 'communicatome' of pregnancy: spotlight on cellular and extravesicular chimerism.EMBO Mol Med. 2024 Apr;16(4):700-714. doi: 10.1038/s44321-024-00045-x. Epub 2024 Mar 11. EMBO Mol Med. 2024. PMID: 38467841 Free PMC article. Review.
References
-
- Albrecht M, Pagenkemper M, Wiessner C, Spohn M, Lutgehetmann M, Jacobsen H, Gabriel G, Zazara DE, Haertel C, Hecher K et al (2022) Infant immunity against viral infections is advanced by the placenta‐dependent vertical transfer of maternal antibodies. Vaccine 40: 1563–1571 - PubMed
Grants and funding
LinkOut - more resources
Full Text Sources
Research Materials

