

NOD mice have distinct metabolic and immunologic profiles when compared with genetically similar MHC-matched ICR mice
- PMID: 37610410
- PMCID: PMC10642984
- DOI: 10.1152/ajpendo.00033.2023
NOD mice have distinct metabolic and immunologic profiles when compared with genetically similar MHC-matched ICR mice
Abstract
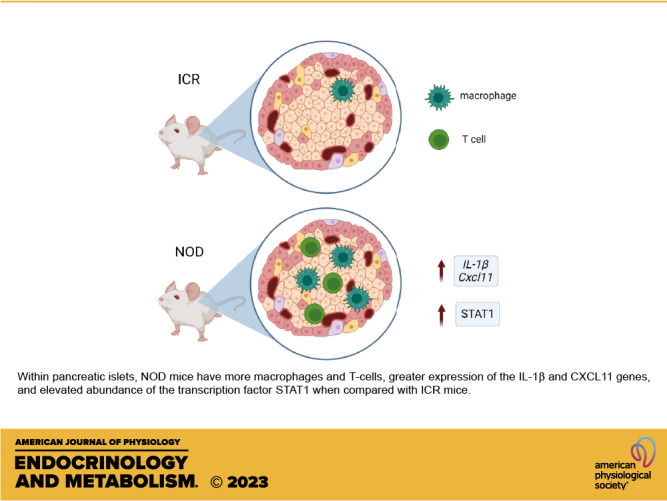
Nonobese diabetic (NOD) mice are the most commonly used rodent model to study mechanisms relevant to the autoimmunity and immunology of type 1 diabetes. Although many different strains of mice have been used as controls for studies comparing nondiabetic lines to the NOD strain, we hypothesized that the parental strain that gave rise to the NOD line might be one of the best options. Therefore, we compared female ICR and NOD mice, which are matched at key major histocompatibility complex (MHC) loci, to understand their metabolic and immunologic similarities and differences. Several novel observations emerged: 1) NOD mice have greater circulating proinsulin when compared with ICR mice. 2) NOD mice display CD3+ and IBA1+ cell infiltration into and near pancreatic islets before hyperglycemia. 3) NOD mice show increased expression of the Il1b and Cxcl11 genes in islets when compared with islets from age-matched ICR mice. 4) NOD mice have a greater abundance of STAT1 and ICAM-1 protein in islets when compared with ICR mice. These data show that ICR mice, which are genetically similar to NOD mice, do not retain the same immunologic outcomes. Thus, ICR mice are an excellent choice as a genetically similar and MHC-matched control for NOD mice in studies designed to understand mechanisms relevant to autoimmune-mediated diabetes onset as well as novel therapeutic interventions.NEW & NOTEWORTHY Nonobese diabetic (NOD) mice have more proinsulin in circulation and STAT1 protein in islets compared with the major histocompatibility complex (MHC)-matched ICR line. NOD mice also display greater expression of cytokines and chemokines in pancreatic islets consistent with immune cell infiltration before hyperglycemia when compared with age-matched ICR mice. Thus, ICR mice represent an excellent control for autoimmunity and inflammation studies using the NOD line of mice.
Keywords: autoimmunity; islet; mice.
Conflict of interest statement
No conflicts of interest, financial or otherwise, are declared by the authors.
Figures


Similar articles
-
Recurrent autoimmunity accelerates destruction of minor and major histoincompatible islet grafts in nonobese diabetic (NOD) mice.Am J Transplant. 2001 Jul;1(2):138-45. Am J Transplant. 2001. PMID: 12099361
-
Transgenic expression of mouse proinsulin II prevents diabetes in nonobese diabetic mice.Diabetes. 1997 Jan;46(1):34-9. doi: 10.2337/diab.46.1.34. Diabetes. 1997. PMID: 8971078
-
Autoimmune syndromes in major histocompatibility complex (MHC) congenic strains of nonobese diabetic (NOD) mice. The NOD MHC is dominant for insulitis and cyclophosphamide-induced diabetes.J Exp Med. 1992 Jul 1;176(1):67-77. doi: 10.1084/jem.176.1.67. J Exp Med. 1992. PMID: 1613467 Free PMC article.
-
Genetic and pathogenic basis of autoimmune diabetes in NOD mice.Curr Opin Immunol. 1994 Dec;6(6):900-6. doi: 10.1016/0952-7915(94)90011-6. Curr Opin Immunol. 1994. PMID: 7710714 Review.
-
Autoimmune diabetes: the role of T cells, MHC molecules and autoantigens.Autoimmunity. 1998;27(3):159-77. doi: 10.3109/08916939809003864. Autoimmunity. 1998. PMID: 9609134 Review.
Cited by
-
Partial remission of type 1 diabetes: Do immunometabolic events define the honeymoon period?Diabetes Obes Metab. 2025 Aug;27(8):4092-4101. doi: 10.1111/dom.16480. Epub 2025 May 28. Diabetes Obes Metab. 2025. PMID: 40432367 Review.
References
-
- O'Kell AL, Wasserfall C, Catchpole B, Davison LJ, Hess RS, Kushner JA, Atkinson MA. Comparative pathogenesis of autoimmune diabetes in humans, NOD mice, and canines: has a valuable animal model of type 1 diabetes been overlooked? Diabetes 66: 1443–1452, 2017. doi:10.2337/db16-1551. - DOI - PMC - PubMed
Publication types
MeSH terms
Substances
Grants and funding
LinkOut - more resources
Full Text Sources
Medical
Molecular Biology Databases
Research Materials
Miscellaneous