. 2023 Oct;62(10):1479-1491.
doi: 10.1007/s40262-023-01281-z. Epub 2023 Aug 23.

Mirikizumab Pharmacokinetics in Patients with Moderately to Severely Active Ulcerative Colitis: Results from Phase III LUCENT Studies

Affiliations

Mirikizumab Pharmacokinetics in Patients with Moderately to Severely Active Ulcerative Colitis: Results from Phase III LUCENT Studies

Laiyi Chua et al. Clin Pharmacokinet. 2023 Oct.

Abstract

Background and objective: Mirikizumab is a humanized anti-interleukin-23-p19 monoclonal antibody being developed for ulcerative colitis and Crohn's disease. This analysis characterized mirikizumab pharmacokinetics using phase II and III trial data from patients with moderately to severely active ulcerative colitis.

Methods: Serum pharmacokinetic data in patients receiving mirikizumab 50-1000 mg intravenously every 4 weeks as induction treatment and mirikizumab 200 mg subcutaneously every 4 or 12 weeks as maintenance treatment across three trials (N = 1362) were analyzed using non-linear mixed-effects modeling. Covariate effects on mirikizumab exposure were evaluated using simulation-based estimations.

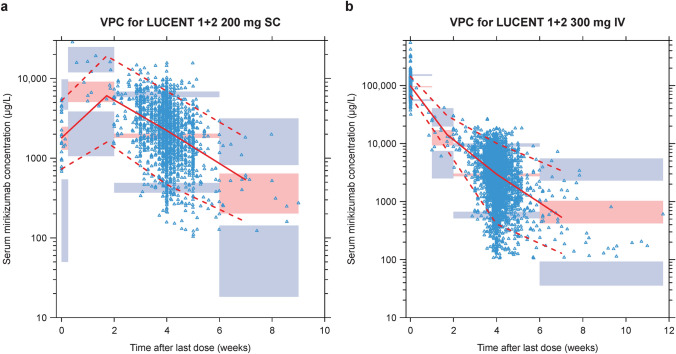
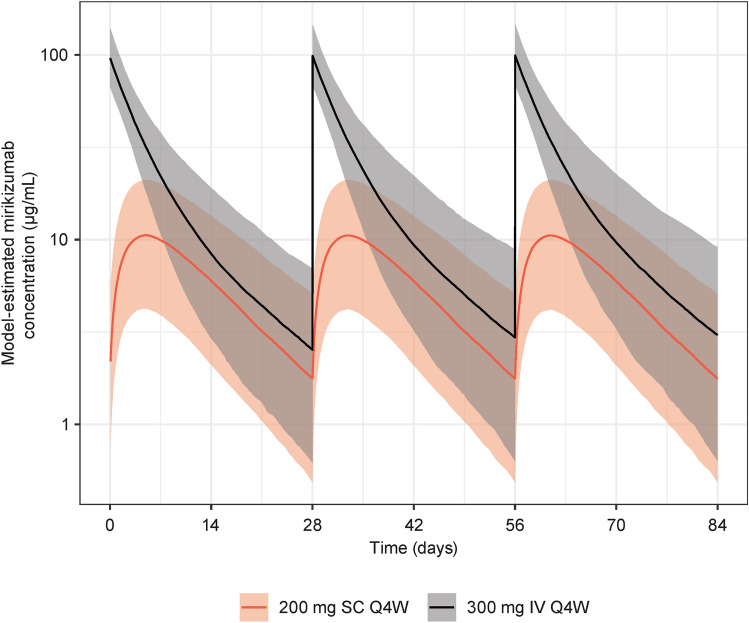
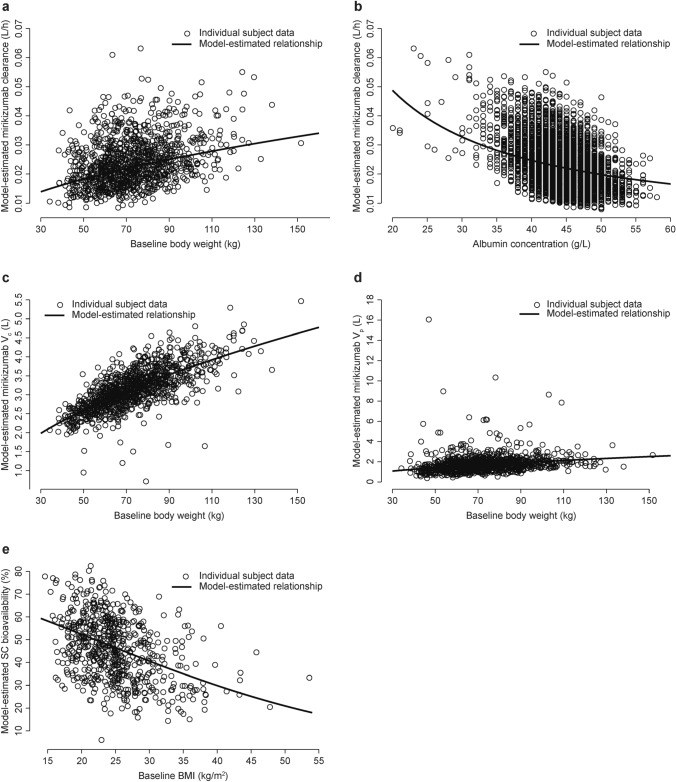
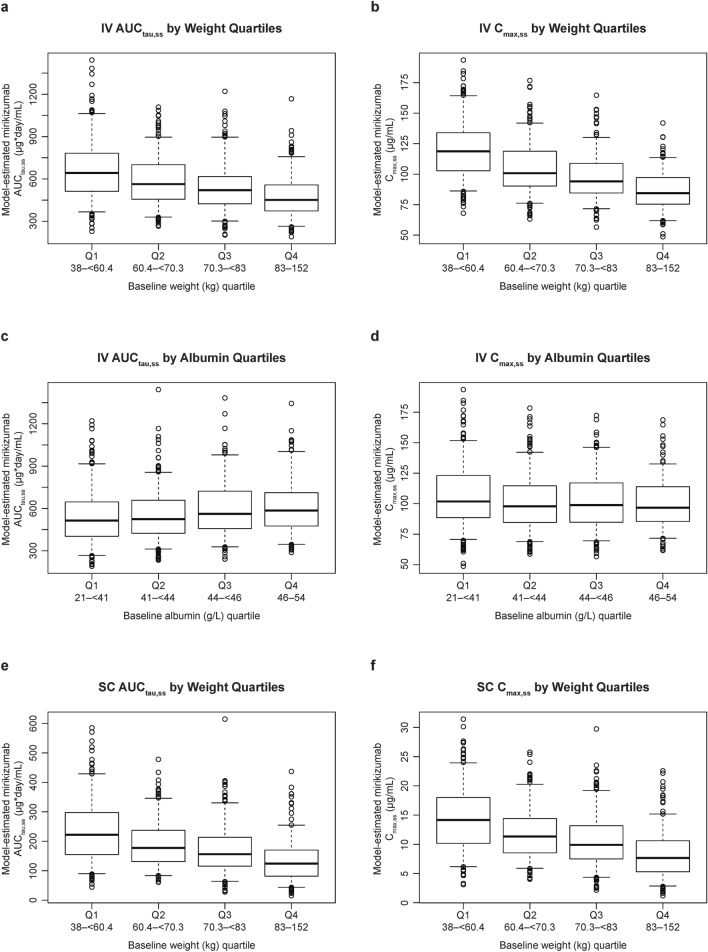
Results: Mirikizumab pharmacokinetics was best described by a linear two-compartment model with first-order absorption. Clearance, volume of distribution for central and peripheral compartments, and half-life were estimated at approximately 0.022 L/h (linear), 3.11 L and 1.69 L, and 9.5 days, respectively. Statistically significant effects of body weight and serum albumin levels on clearance, body weight on central and peripheral volumes of distribution, and body mass index on bioavailability were observed but effects were small relative to random inter-individual variability (% coefficient of variation: 18-64%). The subcutaneous bioavailability of mirikizumab was 48%.

Conclusions: Mirikizumab displayed pharmacokinetic characteristics typical of a monoclonal antibody where clearance increased with body weight and decreased with the albumin level, and bioavailability decreased with body mass index. These effects were small relative to random variability, indicating that a dose adjustment for patient factors is not required.

Clinical trial registration: ClinicalTrials.gov: NCT02589665 (28 October, 2015), NCT03518086 (8 May, 2018), NCT03524092 (14 May, 2018).


Conflict of interest statement

Laiyi Chua and Xin Cindy Zhang are employees and minor shareholders of Eli Lilly and Company. Stuart Friedrich is a former employee of Eli Lilly and Company.

Figures

Fig. 1
Fig. 1
Visual predictive check (VPC) for the final mirikizumab pharmacokinetic model for the LUCENT 1+2 study stratified by route of administration. Blue triangles: individual observed concentration data; solid red line: median of observed concentrations; dashed red lines: 5th and 95th percentiles of observed concentrations; pink shaded area: confidence interval for the median of simulated data; blue shaded areas: confidence intervals for the 5th and 95th percentiles of simulated data. IV intravenous, SC subcutaneous
Fig. 2
Fig. 2
LUCENT 1+2 population pharmacokinetic model-predicted concentration–time profile. Mirikizumab model-predicted concentration–time profile following a 300-mg intravenous (IV) dose once every 4 weeks (Q4W) from weeks 0 to 12 (induction dosing period) or at steady state following a 200-mg subcutaneous (SC) dose Q4W (maintenance dosing period) from the phase III population pharmacokinetic analyses. Simulation of 1000 patients was conducted using baseline covariates in the LUCENT 1+2 dataset. The solid black and orange lines depict the median predicted concentration profile for the 300-mg IV dose Q4W from weeks 0 to 12 and the 200-mg SC dose Q4W from weeks 24 to 36, respectively, and the shaded area defines the 90% prediction interval of the simulated data
Fig. 3
Fig. 3
LUCENT 1+2 population pharmacokinetic model-estimated statistically significant covariates. LUCENT 1+2 population pharmacokinetic model-estimated a clearance versus baseline body weight, b) clearance versus albumin level, c volume of distribution of the central compartment versus baseline body weight, d volume of distribution of the peripheral compartment versus baseline body weight, and e bioavailability versus baseline body mass index (BMI). SC subcutaneous, V1 volume of distribution of the central compartment, V2 volume of distribution of the peripheral compartment
Fig. 4
Fig. 4
LUCENT 1+2 population pharmacokinetic model-estimated effects of statistically significant covariates on the pharmacokinetics of mirikizumab. Boxplots of covariate effects on the pharmacokinetics of mirikizumab post IV (ad) and post-SC (e, f) administration from the population pharmacokinetic analysis. The horizontal line in each box represents the median; the top and bottom sides of the box represent the 75th and 25th percentiles; the whiskers extend to the 5th and 95th percentiles; and circles represent data points outside of the 5th or 95th percentile. AUCtau,ss area under the plasma concentration–time curve during one dosing interval at steady state, Cmax,ss maximum steady-state plasma drug concentration, IV intravenous, Q quartile, SC subcutaneous
Fig. 5
Fig. 5
LUCENT 1+2 post hoc analyses. Boxplots of LUCENT 1+2 model-estimated post hoc a bioavailability versus injection site and b clearance versus treatment-emergent antidrug antibody (TE-ADA) titers (patients were categorized by the maximum observed TE-ADA in the population pharmacokinetic analysis dataset). The horizontal line in each box represents the median; the top and bottom sides of the box represent the 75th and 25th percentiles; the whiskers extend to the 5th and 95th percentiles; and circles represent data points outside of the 5th or 95th percentile. c Observed mirikizumab concentrations in LUCENT 1 and LUCENT 2 studies following intravenous (IV) mirikizumab 300 mg every 4 weeks (Q4W) and subcutaneous (SC) 200 mg Q4W by TE-ADA titer category. Individual dots represent individual pharmacokinetic samples. The week 4 visit in LUCENT 1 included samples taken both before and after the mirikizumab infusion. The horizontal dashed line represents the lower limit of quantitation (LLOQ) of mirikizumab bioanalytical assay value (0.1 μg/mL) reported from bioanalytical results

References

    1. Danese S, Fiocchi C. Ulcerative colitis. N Engl J Med. 2011;365(18):1713–1725. doi: 10.1056/NEJMra1102942. - DOI - PubMed
    1. Ungaro R, Mehandru S, Allen PB, Peyrin-Biroulet L, Colombel JF. Ulcerative colitis. Lancet. 2017;389(10080):1756–1770. doi: 10.1016/S0140-6736(16)32126-2. - DOI - PMC - PubMed
    1. Wetwittayakhlang P, Lontai L, Gonczi L, Golovics PA, Hahn GD, Bessissow T, et al. Treatment targets in ulcerative colitis: is it time for all in, including histology? J Clin Med. 2021;10(23):5551. doi: 10.3390/jcm10235551. - DOI - PMC - PubMed
    1. Lasa JS, Olivera PA, Danese S, Peyrin-Biroulet L. Efficacy and safety of biologics and small molecule drugs for patients with moderate-to-severe ulcerative colitis: a systematic review and network meta-analysis. Lancet Gastroenterol Hepatol. 2022;7(2):161–170. doi: 10.1016/S2468-1253(21)00377-0. - DOI - PubMed
    1. Aggarwal S, Ghilardi N, Xie MH, de Sauvage FJ, Gurney AL. Interleukin-23 promotes a distinct CD4 T cell activation state characterized by the production of interleukin-17. J Biol Chem. 2003;278(3):1910–1914. doi: 10.1074/jbc.M207577200. - DOI - PubMed

Publication types

MeSH terms

Associated data