. 2023 Nov 1;83(21):3577-3592.
doi: 10.1158/0008-5472.CAN-23-0025.

Matrix Stiffness Triggers Lipid Metabolic Cross-talk between Tumor and Stromal Cells to Mediate Bevacizumab Resistance in Colorectal Cancer Liver Metastases

Affiliations

Matrix Stiffness Triggers Lipid Metabolic Cross-talk between Tumor and Stromal Cells to Mediate Bevacizumab Resistance in Colorectal Cancer Liver Metastases

Yannan Zheng et al. Cancer Res. .

Abstract

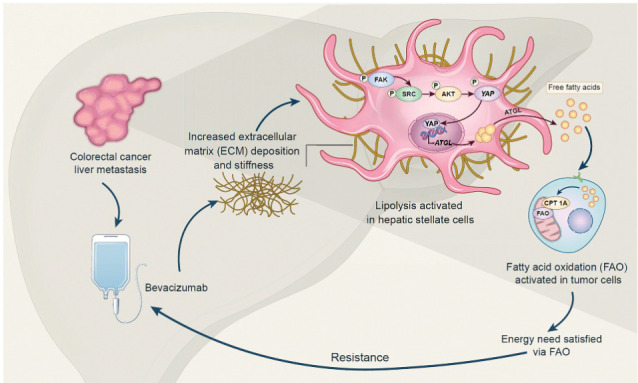
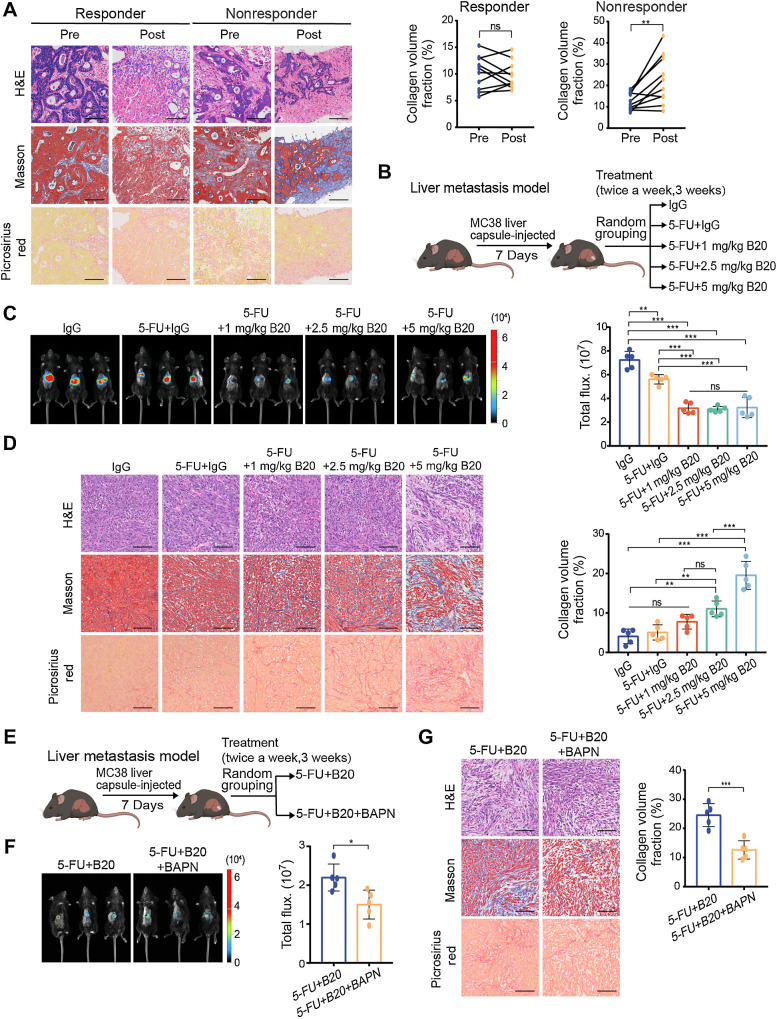
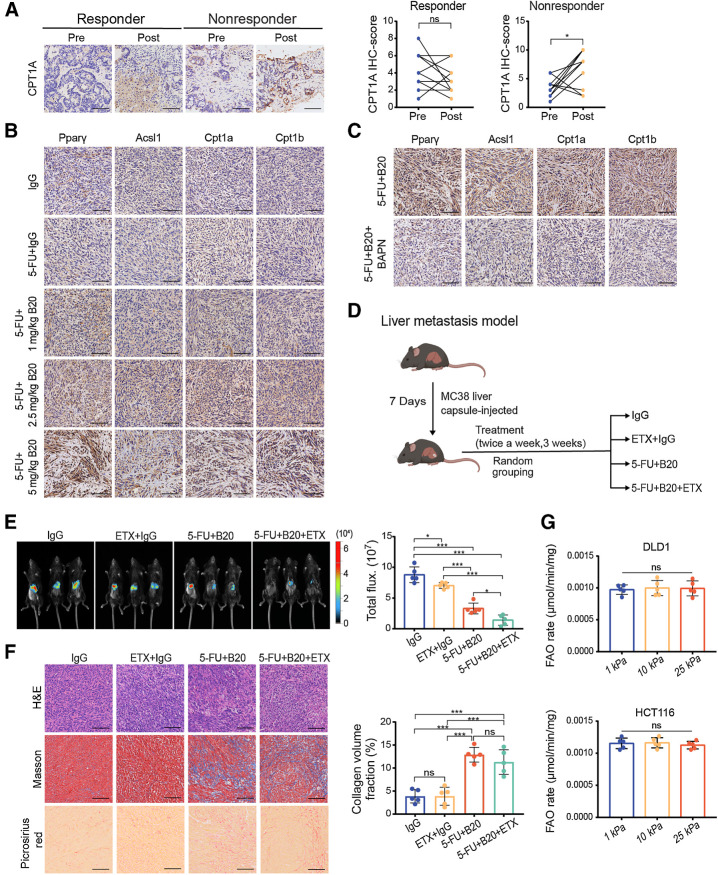
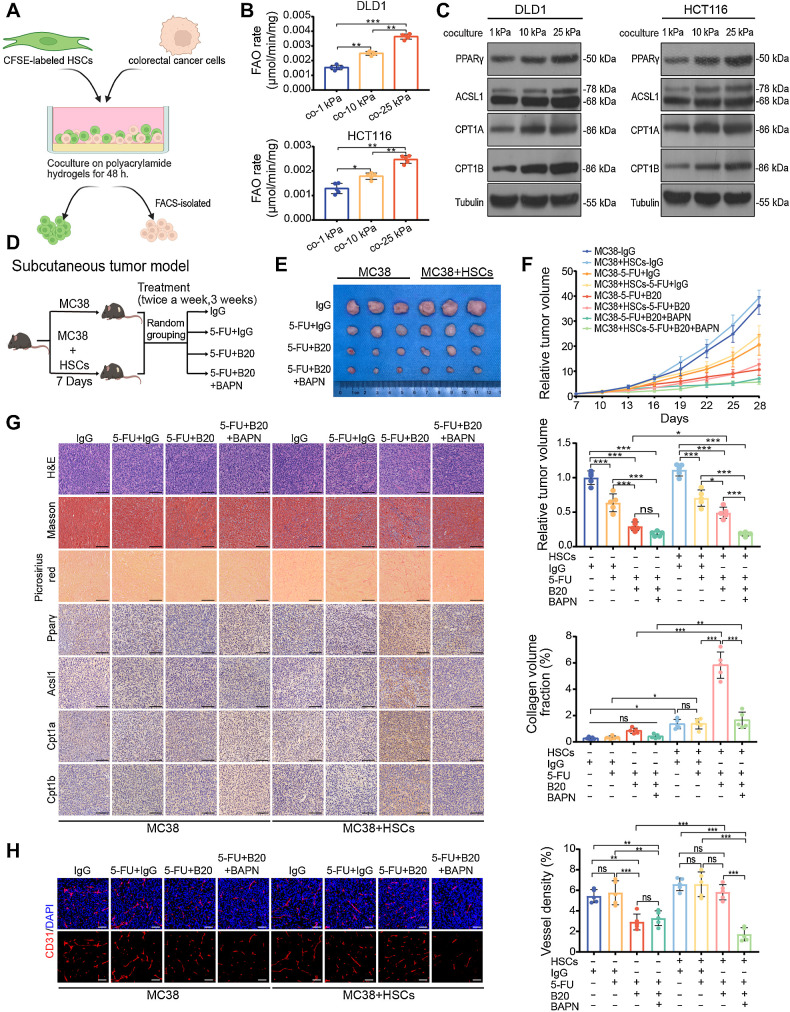
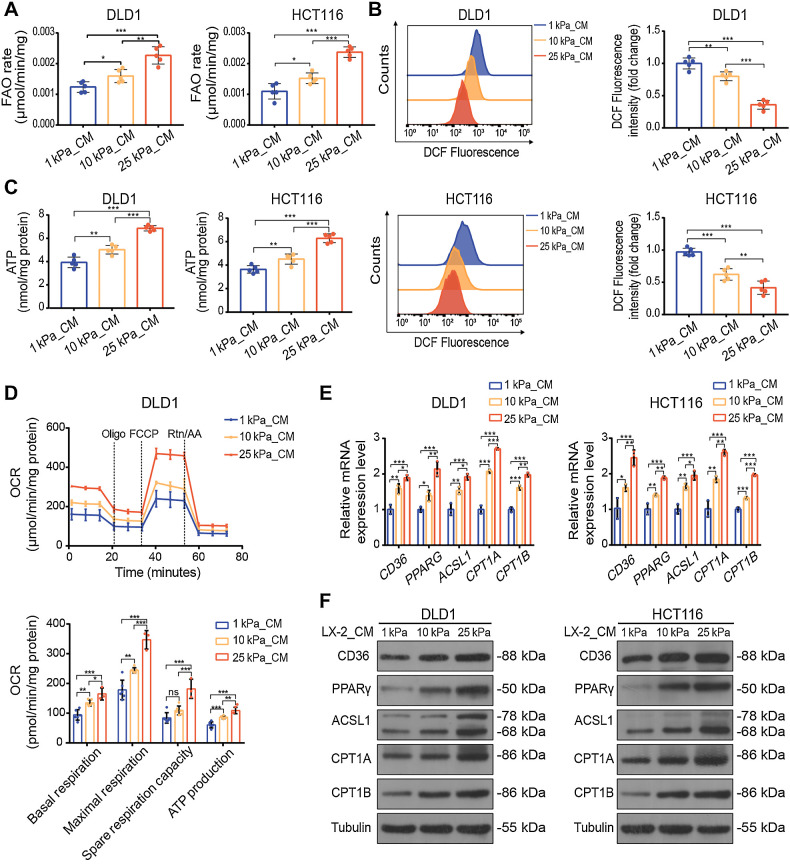
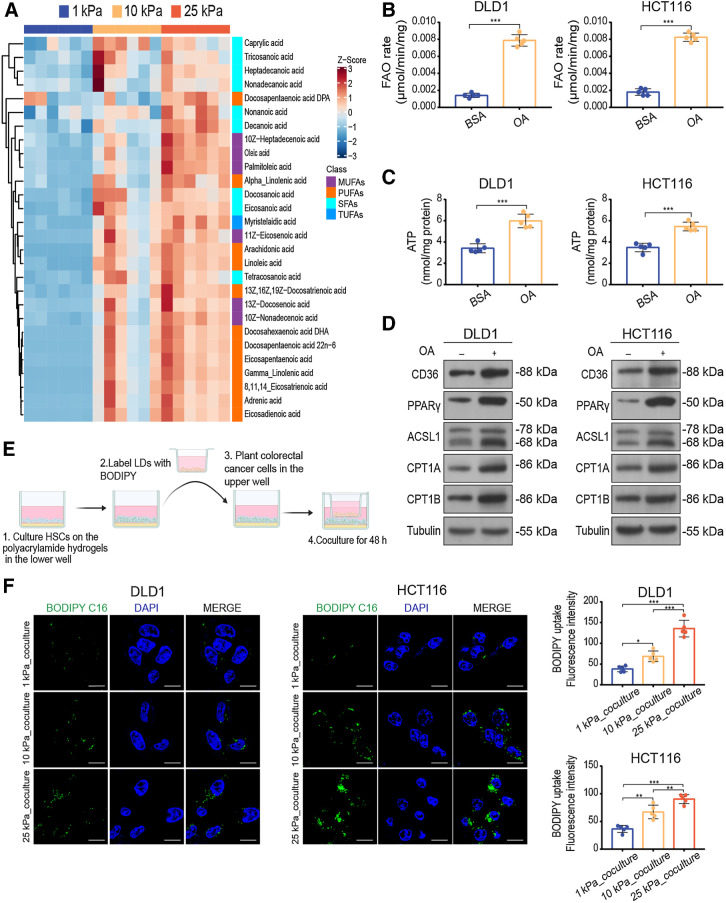
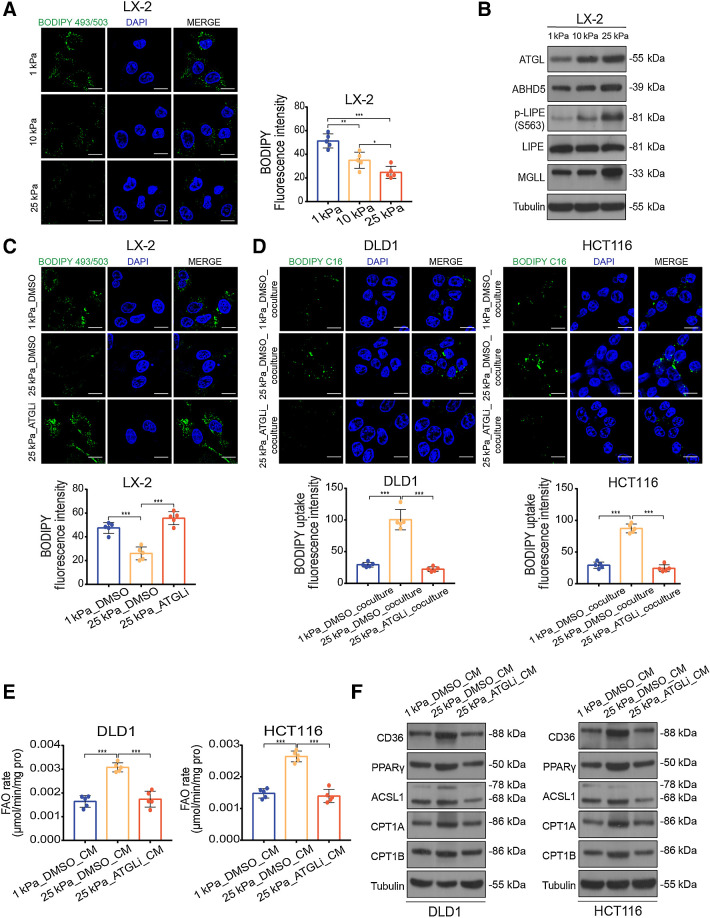
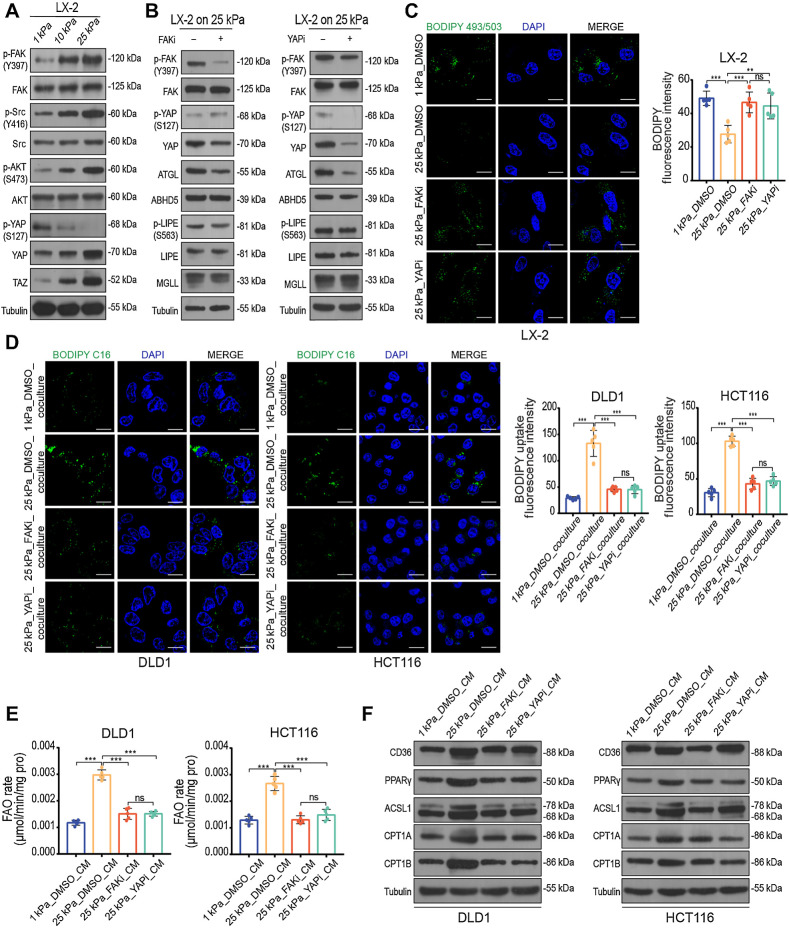
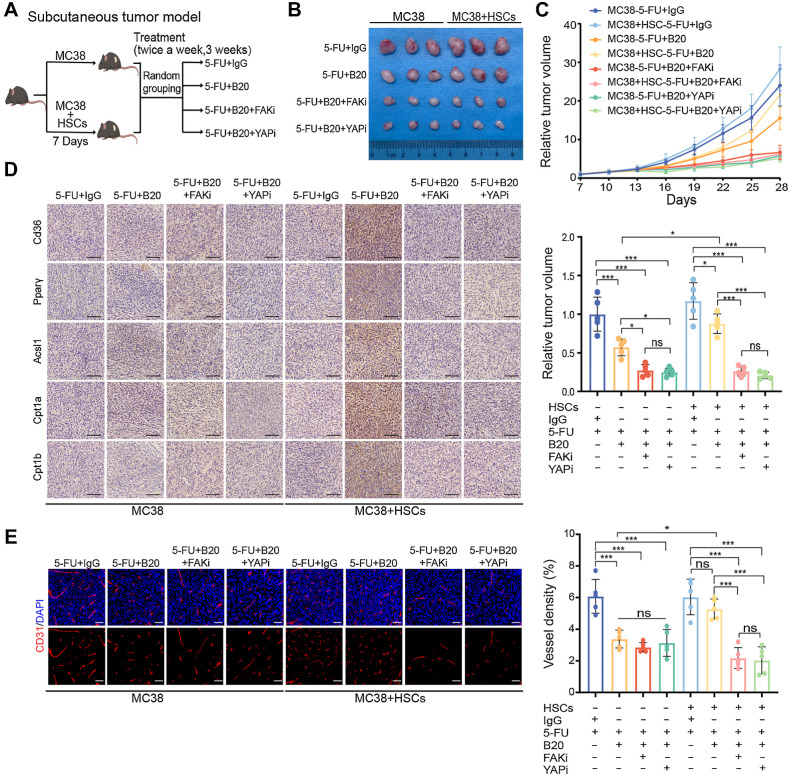
Bevacizumab is an anti-VEGF monoclonal antibody that plays an important role in the combination treatment of advanced colorectal cancer. However, resistance remains a major hurdle limiting bevacizumab efficacy, highlighting the importance of identifying a mechanism of antiangiogenic therapy resistance. Here, we investigated biophysical properties of the extracellular matrix (ECM) related to metabolic processes and acquired resistance to bevacizumab. Evaluation of paired pre- and posttreatment samples of liver metastases from 20 colorectal cancer patients treated with combination bevacizumab therapy, including 10 responders and 10 nonresponders, indicated that ECM deposition in liver metastases and a highly activated fatty acid oxidation (FAO) pathway were elevated in nonresponders after antiangiogenic therapy compared with responders. In mouse models of liver metastatic colorectal cancer (mCRC), anti-VEGF increased ECM deposition and FAO in colorectal cancer cells, and treatment with the FAO inhibitor etomoxir enhanced the efficacy of antiangiogenic therapy. Hepatic stellate cells (HSC) were essential for matrix stiffness-mediated FAO in colon cancer cells. Matrix stiffness activated lipolysis in HSCs via the focal adhesion kinase (FAK)/yes-associated protein (YAP) pathway, and free fatty acids secreted by HSCs were absorbed as metabolic substrates and activated FAO in colon cancer cells. Suppressing HSC lipolysis using FAK and YAP inhibition enhanced the efficacy of anti-VEGF therapy. Together, these results indicate that bevacizumab-induced ECM remodeling triggers lipid metabolic cross-talk between colon cancer cells and HSCs. This metabolic mechanism of bevacizumab resistance mediated by the physical tumor microenvironment represents a potential therapeutic target for reversing drug resistance.

Significance: Extracellular matrix stiffening drives bevacizumab resistance by stimulating hepatic stellate cells to provide fuel for mCRC cells in the liver, indicating a potential metabolism-based therapeutic strategy for overcoming resistance.


Figures

None
Graphical abstract
Figure 1. Bevacizumab increases ECM deposition in colorectal cancer liver metastases in a dose-dependent manner. A, Representative hematoxylin and eosin (H&E), Masson and picrosirius red (left) on serial sections showing ECM deposition change in liver metastases from patients with colorectal cancer before and after receiving chemotherapy and bevacizumab treatment. Quantification of intraindividual comparisons of collagen volume fraction (right) in paired samples (two-tailed paired t test; n = 10 per group). B, Schematic representation of the liver metastasis models used in C and D. Mice were given treatment with control IgG, 5-FU+IgG, 5-FU+1 mg/kg B20, 5-FU+2.5 mg/kg B20 or 5-FU+5 mg/kg B20 (5-FU 50 mg/kg; twice a week, 3 weeks). C, Representative in vivo bioluminescent images (left) and quantification of bioluminescent signals (right) of liver metastases in mice with indicated treatment (one-way ANOVA; n = 5 per group). D, Representative hematoxylin and eosin, Masson, picrosirius red images (left) on serial sections and quantification of collagen volume fraction (right) showing ECM deposition in liver metastases in mice with indicated treatment (one-way ANOVA; n = 5 per group). E, Schematic representation of the liver metastasis models used in F and G. Mice were administered 5-FU+B20 or 5-FU+B20+BAPN (5-FU, 50 mg/kg; B20, 5 mg/kg; BAPN, 100 mg/kg; twice a week, 3 weeks). F, Representative in vivo bioluminescent images (left) and quantification of bioluminescent signals (right) of liver metastases in mice with indicated treatment (two-tailed unpaired t test; n = 5 per group). G, Representative hematoxylin and eosin, Masson, picrosirius red images (left), and quantification of collagen volume fraction (right) showing ECM deposition in liver metastases in mice with indicated treatment (two-tailed unpaired t test; n = 5 per group). Data are graphed as the mean ± SD. Scale bar, 100 μm. ns, not significant; P > 0.05; *, P < 0.05; **, P < 0.01; ***, P < 0.001. (B and E, Created with BioRender.com.)
Figure 1.
Bevacizumab increases ECM deposition in colorectal cancer liver metastases in a dose-dependent manner. A, Representative hematoxylin and eosin (H&E), Masson and picrosirius red (left) on serial sections showing ECM deposition change in liver metastases from patients with colorectal cancer before and after receiving chemotherapy and bevacizumab treatment. Quantification of intraindividual comparisons of collagen volume fraction (right) in paired samples (two-tailed paired t test; n = 10 per group). B, Schematic representation of the liver metastasis models used in C and D. Mice were given treatment with control IgG, 5-FU+IgG, 5-FU+1 mg/kg B20, 5-FU+2.5 mg/kg B20 or 5-FU+5 mg/kg B20 (5-FU 50 mg/kg; twice a week, 3 weeks). C, Representative in vivo bioluminescent images (left) and quantification of bioluminescent signals (right) of liver metastases in mice with indicated treatment (one-way ANOVA; n = 5 per group). D, Representative hematoxylin and eosin, Masson, picrosirius red images (left) on serial sections and quantification of collagen volume fraction (right) showing ECM deposition in liver metastases in mice with indicated treatment (one-way ANOVA; n = 5 per group). E, Schematic representation of the liver metastasis models used in F and G. Mice were administered 5-FU+B20 or 5-FU+B20+BAPN (5-FU, 50 mg/kg; B20, 5 mg/kg; BAPN, 100 mg/kg; twice a week, 3 weeks). F, Representative in vivo bioluminescent images (left) and quantification of bioluminescent signals (right) of liver metastases in mice with indicated treatment (two-tailed unpaired t test; n = 5 per group). G, Representative hematoxylin and eosin, Masson, picrosirius red images (left), and quantification of collagen volume fraction (right) showing ECM deposition in liver metastases in mice with indicated treatment (two-tailed unpaired t test; n = 5 per group). Data are graphed as the mean ± SD. Scale bar, 100 μm. ns, not significant; P > 0.05; *, P < 0.05; **, P < 0.01; ***, P < 0.001. (B and E, Created with BioRender.com.)
Figure 2. Anti-VEGF therapy-induced ECM deposition in liver metastases is associated with activation of FAO metabolism. A, Left, representative IHC images showing CPT1A expression in liver metastases from colorectal cancer patients before and after receiving chemotherapy and bevacizumab treatment. Right, IHC scores of CPT1A of intraindividual comparisons in paired samples (two-tailed paired t test; n = 10 per group). B, Representative IHC images on serial sections of MC38 liver metastases of mice with indicated treatment. C, Representative IHC images on serial sections of MC38 liver metastases of mice with indicated treatment. D, Schematic representation of the liver metastasis models used in E and F. Mice were given treatment with IgG, etomoxir (ETX) +IgG, 5-FU+B20 or 5-FU+B20+ETX (5-FU 50 mg/kg, B20 5 mg/kg; etomoxir 15 mg/kg; twice a week, 3 weeks). E, Representative in vivo bioluminescent images (left) and quantification of bioluminescent signals (right) of liver metastases in mice treated with indicated treatment (one-way ANOVA; n = 5 per group). F, Representative hematoxylin and eosin (H&E), Masson, picrosirius red images (left) on serial sections and quantification of collagen volume fraction (right) showing ECM deposition in liver metastases in mice with indicated treatment (one-way ANOVA; n = 5 per group). G, FAO rate of DLD1 and HCT116 cells cultured on 1 kPa, 10 kPa, and 25 kPa polyacrylamide hydrogels (one-way ANOVA; n = 5 independent experiments). Data are graphed as the mean ± SD. Scale bar, 100 μm. ns, not significant; P > 0.05; *, P < 0.05; ***, P < 0.001. (D, Created with BioRender.com.)
Figure 2.
Anti-VEGF therapy-induced ECM deposition in liver metastases is associated with activation of FAO metabolism. A, Left, representative IHC images showing CPT1A expression in liver metastases from colorectal cancer patients before and after receiving chemotherapy and bevacizumab treatment. Right, IHC scores of CPT1A of intraindividual comparisons in paired samples (two-tailed paired t test; n = 10 per group). B, Representative IHC images on serial sections of MC38 liver metastases of mice with indicated treatment. C, Representative IHC images on serial sections of MC38 liver metastases of mice with indicated treatment. D, Schematic representation of the liver metastasis models used in E and F. Mice were given treatment with IgG, etomoxir (ETX) +IgG, 5-FU+B20 or 5-FU+B20+ETX (5-FU 50 mg/kg, B20 5 mg/kg; etomoxir 15 mg/kg; twice a week, 3 weeks). E, Representative in vivo bioluminescent images (left) and quantification of bioluminescent signals (right) of liver metastases in mice treated with indicated treatment (one-way ANOVA; n = 5 per group). F, Representative hematoxylin and eosin (H&E), Masson, picrosirius red images (left) on serial sections and quantification of collagen volume fraction (right) showing ECM deposition in liver metastases in mice with indicated treatment (one-way ANOVA; n = 5 per group). G, FAO rate of DLD1 and HCT116 cells cultured on 1 kPa, 10 kPa, and 25 kPa polyacrylamide hydrogels (one-way ANOVA; n = 5 independent experiments). Data are graphed as the mean ± SD. Scale bar, 100 μm. ns, not significant; P > 0.05; *, P < 0.05; ***, P < 0.001. (D, Created with BioRender.com.)
Figure 3. HSCs are essential for matrix stiffness–mediated FAO metabolic reprogramming in colon cancer cells. A, Schematic representation of the HSCs-colon cancer cells coculture system. HSCs were labeled with CFSE before coculture with colon cancer cells for 48 hours on polyacrylamide hydrogels. B and C, FAO rate (B) and Western blot analysis (C) of DLD1 and HCT116 cells cocultured with LX-2 cells on 1 kPa, 10 kPa, and 25 kPa polyacrylamide hydrogels (one-way ANOVA; n = 5 independent experiments). D, Schematic representation of HSC/MC38 coinjection subcutaneous tumor models used in E–G. MC38 cells (0.5×10⁶) were subcutaneously injected with or without murine primary HSCs (0.5×10⁶) into C57BL/6 mice. After 7 days, mice were treated with IgG, 5-FU+IgG, 5-FU+B20, or 5-FU+B20+BAPN (5-FU 50 mg/kg, B20 5 mg/kg, BAPN 100 mg/kg; twice a week, 3 weeks). E, Representative images of subcutaneous tumors with indicated treatment. F, Relative tumor growth curves (top) and relative tumor volume (bottom) of subcutaneous tumors with indicated treatment (one-way ANOVA; n = 5 per group). G, Left, representative hematoxylin and eosin (H&E), Masson, picrosirius red images, and IHC images on serial sections of subcutaneous tumors with indicated treatment. Right, quantification of collagen volume fraction in subcutaneous tumors with indicated treatment. Scale bar, 100 μm (one-way ANOVA; n = 5 per group). H, Representative immunofluorescence images (left) showing tumor vessels (stained for CD31) and quantification of vessel density (right) in subcutaneous tumors with indicated treatment. Scale bar, 50 μm (one-way ANOVA; n = 5 per group). Data are graphed as the mean ± SD. ns, not significant; P > 0.05; *, P < 0.05; **, P < 0.01; ***, P < 0.001. (A, Created with BioRender.com.)
Figure 3.
HSCs are essential for matrix stiffness–mediated FAO metabolic reprogramming in colon cancer cells. A, Schematic representation of the HSCs-colon cancer cells coculture system. HSCs were labeled with CFSE before coculture with colon cancer cells for 48 hours on polyacrylamide hydrogels. B and C, FAO rate (B) and Western blot analysis (C) of DLD1 and HCT116 cells cocultured with LX-2 cells on 1 kPa, 10 kPa, and 25 kPa polyacrylamide hydrogels (one-way ANOVA; n = 5 independent experiments). D, Schematic representation of HSC/MC38 coinjection subcutaneous tumor models used in E–G. MC38 cells (0.5×10⁶) were subcutaneously injected with or without murine primary HSCs (0.5×10⁶) into C57BL/6 mice. After 7 days, mice were treated with IgG, 5-FU+IgG, 5-FU+B20, or 5-FU+B20+BAPN (5-FU 50 mg/kg, B20 5 mg/kg, BAPN 100 mg/kg; twice a week, 3 weeks). E, Representative images of subcutaneous tumors with indicated treatment. F, Relative tumor growth curves (top) and relative tumor volume (bottom) of subcutaneous tumors with indicated treatment (one-way ANOVA; n = 5 per group). G, Left, representative hematoxylin and eosin (H&E), Masson, picrosirius red images, and IHC images on serial sections of subcutaneous tumors with indicated treatment. Right, quantification of collagen volume fraction in subcutaneous tumors with indicated treatment. Scale bar, 100 μm (one-way ANOVA; n = 5 per group). H, Representative immunofluorescence images (left) showing tumor vessels (stained for CD31) and quantification of vessel density (right) in subcutaneous tumors with indicated treatment. Scale bar, 50 μm (one-way ANOVA; n = 5 per group). Data are graphed as the mean ± SD. ns, not significant; P > 0.05; *, P < 0.05; **, P < 0.01; ***, P < 0.001. (A, Created with BioRender.com.)
Figure 4. CM derived from HSCs cultured on the stiff substrates upregulates FAO metabolism in colon cancer cells. A–C, FAO rate (A), ROS content (B), and ATP level (C) of DLD1 or HCT116 cells treated with CM from LX-2 cells cultured on 1 kPa, 10 kPa, and 25 kPa polyacrylamide hydrogels for 48 hours (one-way ANOVA; n = 5 independent experiments). D, The basal respiration, maximal respiration, spare respiration capacity, and ATP production of DLD1 cells with indicated treatment were measured by OCR measurements (one-way ANOVA; n = 5 independent experiments). E and F, Relative expression of FAO-related genes in DLD1 and HCT116 cells treated with indicated CM by qPCR analysis (E) and Western blot analysis (one-way ANOVA; n = 5 independent experiments; F). Data are graphed as the mean ± SD. ns, not significant; P > 0.05; *, P < 0.05; **, P < 0.01; ***, P < 0.001.
Figure 4.
CM derived from HSCs cultured on the stiff substrates upregulates FAO metabolism in colon cancer cells. AC, FAO rate (A), ROS content (B), and ATP level (C) of DLD1 or HCT116 cells treated with CM from LX-2 cells cultured on 1 kPa, 10 kPa, and 25 kPa polyacrylamide hydrogels for 48 hours (one-way ANOVA; n = 5 independent experiments). D, The basal respiration, maximal respiration, spare respiration capacity, and ATP production of DLD1 cells with indicated treatment were measured by OCR measurements (one-way ANOVA; n = 5 independent experiments). E and F, Relative expression of FAO-related genes in DLD1 and HCT116 cells treated with indicated CM by qPCR analysis (E) and Western blot analysis (one-way ANOVA; n = 5 independent experiments; F). Data are graphed as the mean ± SD. ns, not significant; P > 0.05; *, P < 0.05; **, P < 0.01; ***, P < 0.001.
Figure 5. High stiffness-induced HSCs promote FAO metabolism in colon cancer cells through secreting FFAs. A, Heat map of targeted lipidomic profiling of medium- and-long-chain fatty acids species with significant differential expression in supernatant derived from LX-2 cells cultured on 1 kPa, 10 kPa, and 25 kPa (Kruskal–Wallis test; n = 6 per group). B–D, FAO rate (B), ATP level (C), and Western blot analysis (D) of DLD1 and HCT116 cells treated with BSA or oleic acid (OA, 100 μmol/L; two-tailed unpaired t test; n = 5 independent experiments). E, Schematic representation of the lipid transfer experiments procedures. HSCs were cultured on polyacrylamide hydrogels with defined stiffnesses. After lipid droplets labeled with BODIPY, HSCs were cocultured with colon cancer cells using a Transwell system. F, Representative images (left) and quantification (right) of labeled lipids within DLD1 and HCT116 cells, after coculturing for 48 hours with LX-2 cells that were prestimulated on 1 kPa, 10 kPa, and 25 kPa polyacrylamide hydrogels. Scale bar, 5 μm (one-way ANOVA; n = 5 independent experiments). Data are graphed as the mean ± SD. *, P < 0.05; **, P < 0.01; ***, P < 0.001. (E, Created with BioRender.com.)
Figure 5.
High stiffness-induced HSCs promote FAO metabolism in colon cancer cells through secreting FFAs. A, Heat map of targeted lipidomic profiling of medium- and-long-chain fatty acids species with significant differential expression in supernatant derived from LX-2 cells cultured on 1 kPa, 10 kPa, and 25 kPa (Kruskal–Wallis test; n = 6 per group). B–D, FAO rate (B), ATP level (C), and Western blot analysis (D) of DLD1 and HCT116 cells treated with BSA or oleic acid (OA, 100 μmol/L; two-tailed unpaired t test; n = 5 independent experiments). E, Schematic representation of the lipid transfer experiments procedures. HSCs were cultured on polyacrylamide hydrogels with defined stiffnesses. After lipid droplets labeled with BODIPY, HSCs were cocultured with colon cancer cells using a Transwell system. F, Representative images (left) and quantification (right) of labeled lipids within DLD1 and HCT116 cells, after coculturing for 48 hours with LX-2 cells that were prestimulated on 1 kPa, 10 kPa, and 25 kPa polyacrylamide hydrogels. Scale bar, 5 μm (one-way ANOVA; n = 5 independent experiments). Data are graphed as the mean ± SD. *, P < 0.05; **, P < 0.01; ***, P < 0.001. (E, Created with BioRender.com.)
Figure 6. Matrix stiffness activates lipolysis in HSCs. A, Representative images (left) and quantification (right) of lipid level in LX-2 cells culture on 1 kPa, 10 kPa, and 25 kPa polyacrylamide hydrogels (one-way ANOVA; n = 5 independent experiments). B, Western blot analysis of lipolytic genes in LX-2 cells cultured on 1 kPa, 10 kPa, and 25 kPa polyacrylamide hydrogels. C, Representative images (top) and quantification (bottom) of lipid level in LX-2 cells cultured on indicated stiffness after treatment with DMSO or 10 μmol/L atglistatin (ATGLi) for 24 hours (one-way ANOVA; n = 5 independent experiments). D, Representative images (top) and quantification (bottom) of labeled lipids within DLD1 and HCT116 cells, after coculturing for 48 hours with LX-2 cells that were prestimulated with indicated treatment (one-way ANOVA; n = 5 independent experiments). E and F, FAO rate (E) and Western blot analysis (F) of DLD1 and HCT116 cells treated with indicated CM (one-way ANOVA; n = 5 independent experiments). Data are graphed as the mean ± SD. Scale bar, 5 μm. *, P < 0.05; **, P < 0.01; ***, P < 0.001.
Figure 6.
Matrix stiffness activates lipolysis in HSCs. A, Representative images (left) and quantification (right) of lipid level in LX-2 cells culture on 1 kPa, 10 kPa, and 25 kPa polyacrylamide hydrogels (one-way ANOVA; n = 5 independent experiments). B, Western blot analysis of lipolytic genes in LX-2 cells cultured on 1 kPa, 10 kPa, and 25 kPa polyacrylamide hydrogels. C, Representative images (top) and quantification (bottom) of lipid level in LX-2 cells cultured on indicated stiffness after treatment with DMSO or 10 μmol/L atglistatin (ATGLi) for 24 hours (one-way ANOVA; n = 5 independent experiments). D, Representative images (top) and quantification (bottom) of labeled lipids within DLD1 and HCT116 cells, after coculturing for 48 hours with LX-2 cells that were prestimulated with indicated treatment (one-way ANOVA; n = 5 independent experiments). E and F, FAO rate (E) and Western blot analysis (F) of DLD1 and HCT116 cells treated with indicated CM (one-way ANOVA; n = 5 independent experiments). Data are graphed as the mean ± SD. Scale bar, 5 μm. *, P < 0.05; **, P < 0.01; ***, P < 0.001.
Figure 7. Matrix stiffness induces lipolysis in HSCs via activating the FAK–YAP signaling pathway. A, Western blot analysis of LX-2 cells cultured on 1 kPa, 10 kPa, and 25 kPa polyacrylamide hydrogels. B, Western blot analysis of LX-2 cells cultured on 25 kPa treated with DMSO, 10 μmol/L FAK inhibitor PF-573228 (FAKi), or 0.1 μmol/L YAP inhibitor verteporfin (YAPi) for 24 hours. C, Representative images (left) and quantification (right) of lipid level in LX-2 cells with indicated treatment (one-way ANOVA; n = 5 independent experiments). D, Representative images (left) and quantification (right) of labeled lipids within DLD1 and HCT116 cells after coculturing for 48 hours with LX-2 cells treated as indicated. Scale bar, 5 μm (one-way ANOVA; n = 5 independent experiments). E and F, FAO rate (E) and Western blot analysis (F) of DLD1 and HCT116 cells treated with indicated CM (one-way ANOVA; n = 5 independent experiments). Data are graphed as the mean ± SD. Scale bar, 5 μm. ns, not significant; P > 0.05; **, P < 0.01; ***, P < 0.001.
Figure 7.
Matrix stiffness induces lipolysis in HSCs via activating the FAK–YAP signaling pathway. A, Western blot analysis of LX-2 cells cultured on 1 kPa, 10 kPa, and 25 kPa polyacrylamide hydrogels. B, Western blot analysis of LX-2 cells cultured on 25 kPa treated with DMSO, 10 μmol/L FAK inhibitor PF-573228 (FAKi), or 0.1 μmol/L YAP inhibitor verteporfin (YAPi) for 24 hours. C, Representative images (left) and quantification (right) of lipid level in LX-2 cells with indicated treatment (one-way ANOVA; n = 5 independent experiments). D, Representative images (left) and quantification (right) of labeled lipids within DLD1 and HCT116 cells after coculturing for 48 hours with LX-2 cells treated as indicated. Scale bar, 5 μm (one-way ANOVA; n = 5 independent experiments). E and F, FAO rate (E) and Western blot analysis (F) of DLD1 and HCT116 cells treated with indicated CM (one-way ANOVA; n = 5 independent experiments). Data are graphed as the mean ± SD. Scale bar, 5 μm. ns, not significant; P > 0.05; **, P < 0.01; ***, P < 0.001.
Figure 8. FAK and YAP inhibition enhances the efficacy of anti-VEGF therapy. A, Schematic representation of HSC/MC38 coinjection subcutaneous tumor models used in B–E. MC38 cells (0.5×10⁶) were subcutaneously injected with or without primary murine HSCs (0.5×10⁶) into C57BL/6 mice. After 7 days, mice were treated with 5-FU+IgG, 5-FU+B20, 5-FU+B20+FAKi, or 5-FU+B20+YAPi (5-FU, 50 mg/kg; B20, 5 mg/kg; FAKi, 5 mg/kg; YAPi, 10 mg/kg; twice a week, 3 weeks). B, Representative images of subcutaneous tumors of mice treated with indicated treatment. C, Relative tumor growth curves (top) and relative tumor volume (bottom) of subcutaneous tumors with indicated treatment (one-way ANOVA; n = 5 per group). D, Representative IHC images of serial sections of subcutaneous tumors of mice with indicated treatment. Scale bar, 100 μm. E, Representative immunofluorescence images (left) showing tumor vessels (stained for CD31) and quantification of vessel density (right) in subcutaneous tumors with indicated treatment. Scale bar, 50 μm (one-way ANOVA; n = 5 per group). Data are graphed as the mean ± SD. ns, not significant; P > 0.05; *, P < 0.05; **, P < 0.01; ***, P < 0.001. (A, Created with BioRender.com.)
Figure 8.
FAK and YAP inhibition enhances the efficacy of anti-VEGF therapy. A, Schematic representation of HSC/MC38 coinjection subcutaneous tumor models used in B–E. MC38 cells (0.5×10⁶) were subcutaneously injected with or without primary murine HSCs (0.5×10⁶) into C57BL/6 mice. After 7 days, mice were treated with 5-FU+IgG, 5-FU+B20, 5-FU+B20+FAKi, or 5-FU+B20+YAPi (5-FU, 50 mg/kg; B20, 5 mg/kg; FAKi, 5 mg/kg; YAPi, 10 mg/kg; twice a week, 3 weeks). B, Representative images of subcutaneous tumors of mice treated with indicated treatment. C, Relative tumor growth curves (top) and relative tumor volume (bottom) of subcutaneous tumors with indicated treatment (one-way ANOVA; n = 5 per group). D, Representative IHC images of serial sections of subcutaneous tumors of mice with indicated treatment. Scale bar, 100 μm. E, Representative immunofluorescence images (left) showing tumor vessels (stained for CD31) and quantification of vessel density (right) in subcutaneous tumors with indicated treatment. Scale bar, 50 μm (one-way ANOVA; n = 5 per group). Data are graphed as the mean ± SD. ns, not significant; P > 0.05; *, P < 0.05; **, P < 0.01; ***, P < 0.001. (A, Created with BioRender.com.)

References

    1. Weitz J, Koch M, Debus J, Höhler T, Galle PR, Büchler MW. Colorectal cancer. Lancet 2005;365:153–65. - PubMed
    1. Barkhatov L, Aghayan DL, Scuderi V, Cipriani F, Fretland AA, Kazaryan AM, et al. . Long-term oncological outcomes after laparoscopic parenchyma-sparing redo liver resections for patients with metastatic colorectal cancer: a European multicenter study. Surg Endosc 2022;36:3374–81. - PMC - PubMed
    1. Hurwitz H, Fehrenbacher L, Novotny W, Cartwright T, Hainsworth J, Heim W, et al. . Bevacizumab plus irinotecan, fluorouracil, and leucovorin for metastatic colorectal cancer. N Engl J Med 2004;350:2335–42. - PubMed
    1. Lee SJ, Lee SY, Lee WS, Yoo JS, Sun JM, Lee J, et al. . Phase I trial and pharmacokinetic study of tanibirumab, a fully human monoclonal antibody to vascular endothelial growth factor receptor 2, in patients with refractory solid tumors. Invest New Drugs 2017;35:782–90. - PMC - PubMed
    1. Li Q, Wang Y, Jia W, Deng H, Li G, Deng W, et al. . Low-dose antiangiogenic therapy sensitizes breast cancer to PD-1 blockade. Clin Cancer Res 2020;26:1712–24. - PubMed

Publication types