. 2023 Aug 25;9(34):eadg6693.
doi: 10.1126/sciadv.adg6693. Epub 2023 Aug 23.

A MYCN-independent mechanism mediating secretome reprogramming and metastasis in MYCN-amplified neuroblastoma

Affiliations

A MYCN-independent mechanism mediating secretome reprogramming and metastasis in MYCN-amplified neuroblastoma

Hai-Feng Zhang et al. Sci Adv. .

Abstract

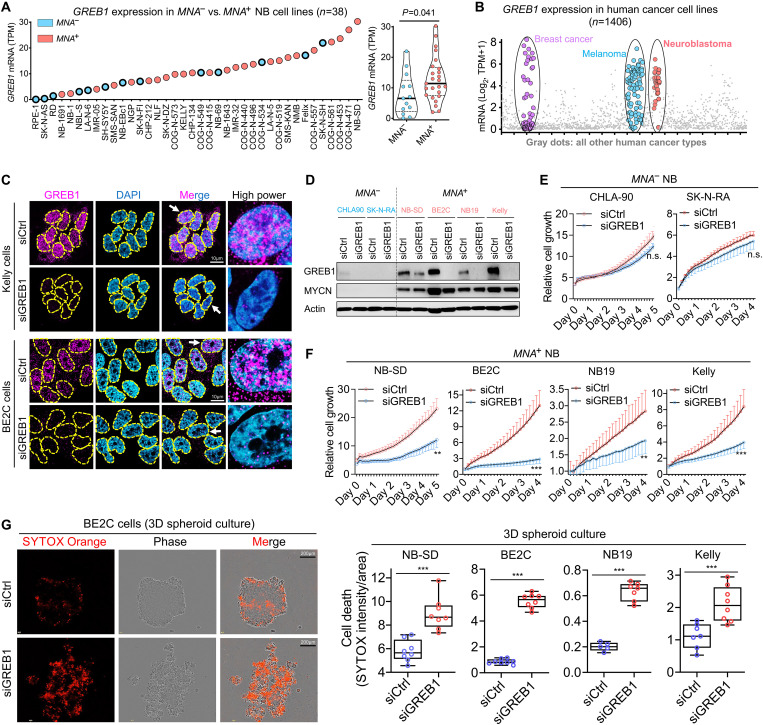
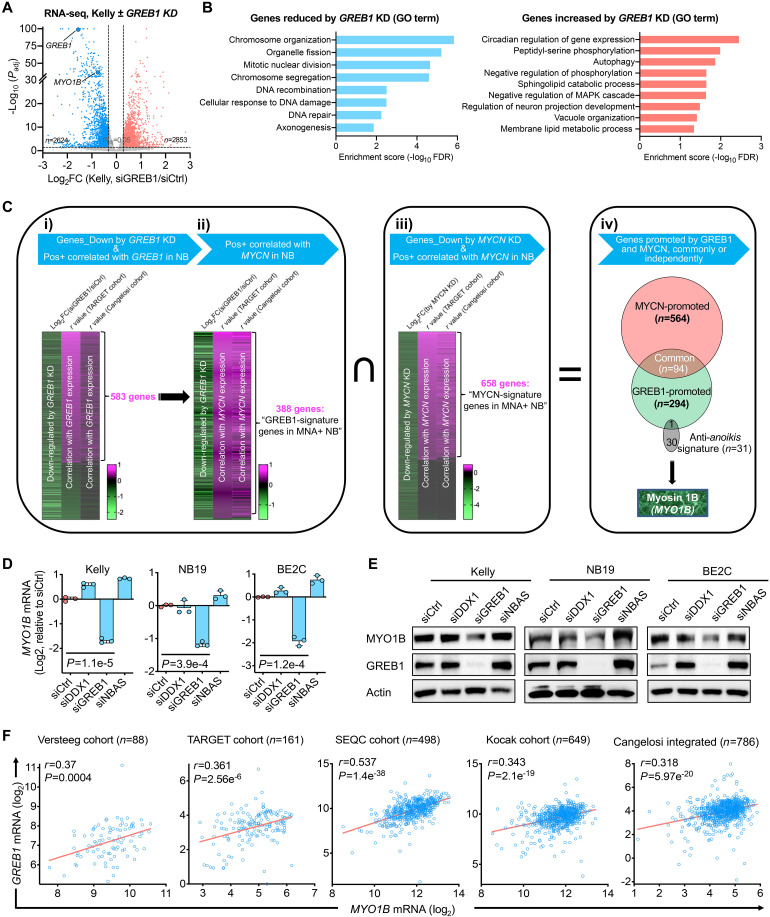
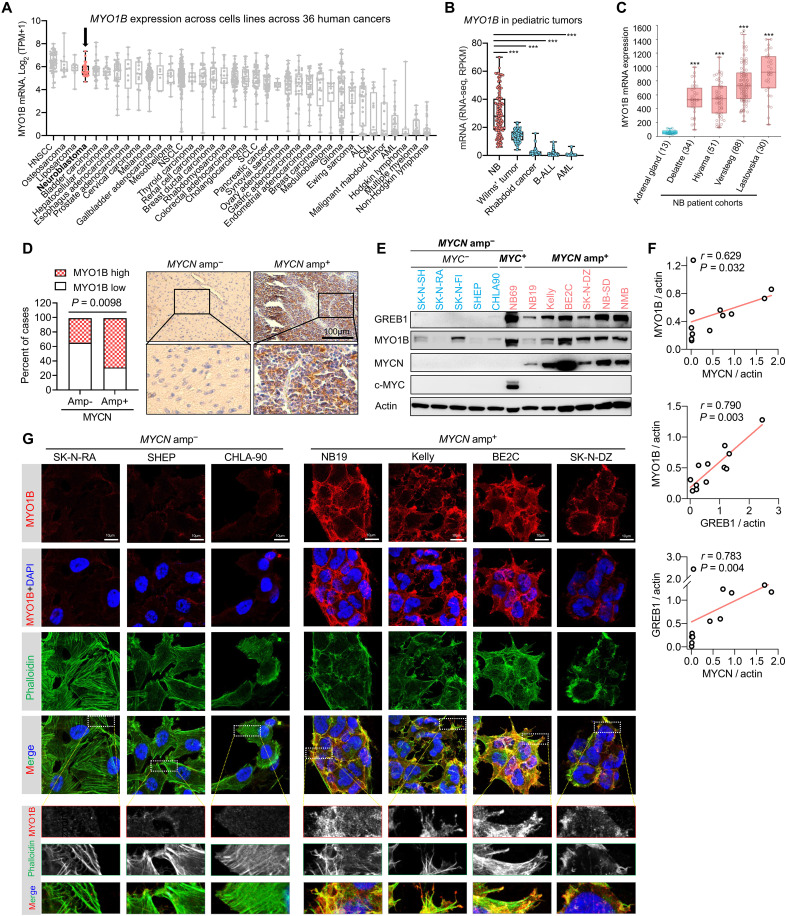
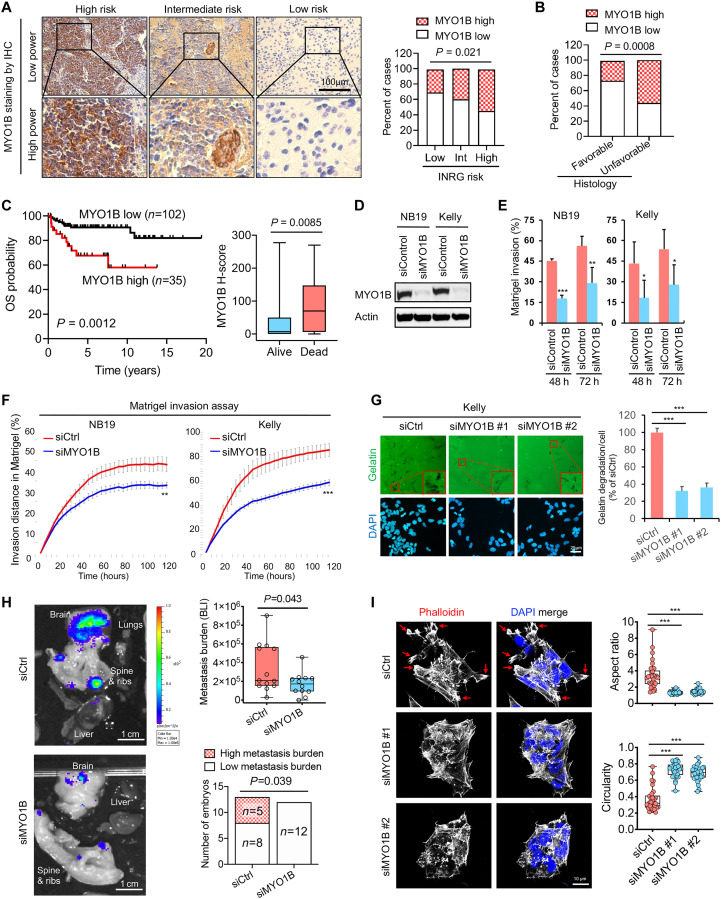
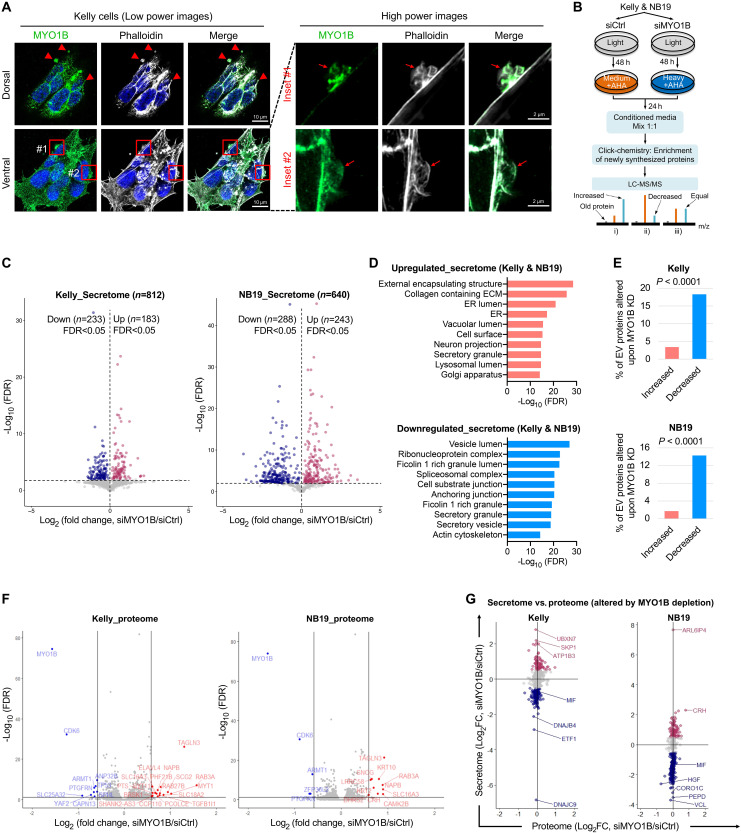
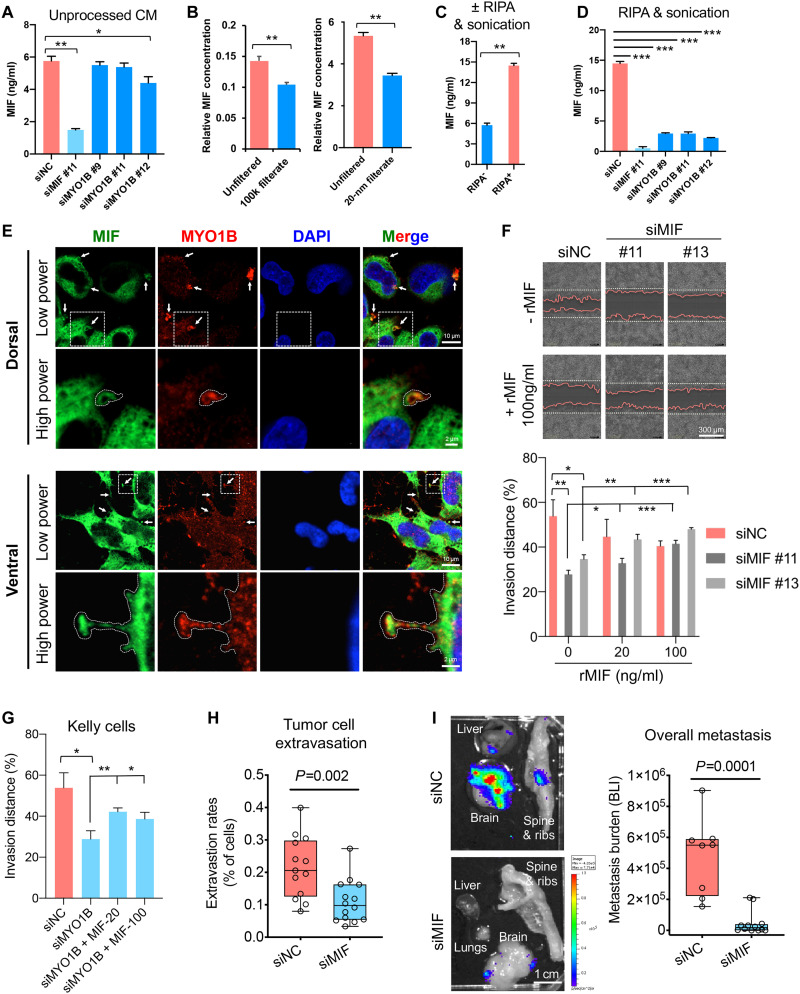
MYCN amplification (MNA) is a defining feature of high-risk neuroblastoma (NB) and predicts poor prognosis. However, whether genes within or in close proximity to the MYCN amplicon also contribute to MNA+ NB remains poorly understood. Here, we identify that GREB1, a transcription factor encoding gene neighboring the MYCN locus, is frequently coexpressed with MYCN and promotes cell survival in MNA+ NB. GREB1 controls gene expression independently of MYCN, among which we uncover myosin 1B (MYO1B) as being highly expressed in MNA+ NB and, using a chick chorioallantoic membrane (CAM) model, as a crucial regulator of invasion and metastasis. Global secretome and proteome profiling further delineates MYO1B in regulating secretome reprogramming in MNA+ NB cells, and the cytokine MIF as an important pro-invasive and pro-metastatic mediator of MYO1B activity. Together, we have identified a putative GREB1-MYO1B-MIF axis as an unconventional mechanism promoting aggressive behavior in MNA+ NB and independently of MYCN.


Figures

Fig. 1.
Fig. 1.. The pro-oncogenic function of GREB1 in MNA+ NB.
(A) Comparison of GREB1 expression levels in a panel of MNA and MNA+ NB cell lines. Data were extracted from Gene Expression Omnibus GSE89413. (B) The expression profile of GREB1 in human cancer cell lines plotted based on data from the DepMap database_Expression Public 22Q4. (C) Immunofluorescence (IF) analysis of GREB1 in MNA+ NB cells Kelly and BE2C, and cells with GREB1 gene depletion were used as controls. (D) Western blotting analysis of the indicated proteins in NB cells transfected with siCtrl or siGREB1. (E and F) The impact of GREB1 gene depletion on cell growth was evaluated by Incucyte in MNA versus MNA+ NB cells (n = 6 to 8). (G) Anoikis induced by GREB1 gene depletion was evaluated by Incucyte with SYTOX Orange labeling in 3D spheroid cultures at day 4 (n = 5 to 8). For all panels, data are presented as means ± SD. P values were determined by two-tailed unpaired Student’s t test. n.s., no significance; **P < 0.01; ***P < 0.001.
Fig. 2.
Fig. 2.. Identification of a GREB1-controlled gene signature in MNA+ NB independent of MYCN.
(A) RNA-seq analysis in Kelly cells ± GREB1 knockdown (KD). The analysis was performed in triplicate. (B) Gene Ontology (GO) analysis of the gene sets significantly reduced/increased by GREB1 KD in Kelly cells [genes with log2 fold change (FC) of >0.3 or <−0.3 were included]. GO term analysis was performed using the PANTHER database, and the GO-Slim Biological Process was analyzed. (C) Gene sets and procedures used for the integrated analysis, which identified a GREB1-controlled gene signature in MNA+ NB independent of MYCN. (D and E) MYO1B expression changes upon KD of the indicated genes assessed by quantitative polymerase chain reaction (D) and immunoblotting (E). (F) Correlation between GREB1 and MYO1B mRNA expression in five cohorts of NB patient samples based on data derived from the R2 database. Data presented are means ± SD; P values were determined by two-tailed unpaired Student’s t test. Pearson coefficient analysis was performed to determine correlations between two variables.
Fig. 3.
Fig. 3.. MYO1B is strongly expressed in NB with MYCN amplification.
(A) Expression profile of MYO1B in human cancer cell lines plotted based on data from the DepMap database_Expression Public 21Q4. (B) The expression profile of MYO1B in pediatric cancers in the TARGET project cohort was extracted from cBioPortal database. (C) Comparison of MYO1B mRNA levels in four cohorts of NB patient samples and nontumor adrenal gland samples. Plots were derived from the R2 database. (D) Statistics (left panel) and representative images (right panel) showing MYO1B expression evaluated by immunohistochemistry (IHC) in MNA and MNA+ NB. (E and F) Protein expression of the indicated markers in a panel of NB cell lines was assessed by immunoblotting, and correlation among the markers normalized to an actin loading control was analyzed (F). (G) Confocal microscopic analysis of the expression level of MYO1B and its colocalization with actin cytoskeleton as assessed by TRITC-phalloidin staining. Differences between groups were determined by two-tailed unpaired Student’s t test. ***P < 0.001. Fisher’s exact test was used to determine the associations between two categorical variables in two groups. Pearson coefficient analysis was performed to determine correlations between two variables.
Fig. 4.
Fig. 4.. MYO1B correlates with poor prognosis and promotes the invasive and metastatic capacity of MNA+ NB.
(A) Representative images (left panel) and statistics (right panel) showing MYO1B expression evaluated by IHC in NB with different INRG risks. (B) Statistics showing MYO1B expression assessed by IHC in NB with favorable versus unfavorable histology. (C) Prognostic significance of MYO1B protein expression (by IHC staining) in a cohort of 137 NB patients. (D to F) Impact of MYO1B depletion (D) on cell invasion through Matrigel was evaluated using ibidi four-well culture inserts (E) and Essen BioScience Incucyte 96-well scratch wound invasion assay (F) (n = 5 to 8). (G) Impact of MYO1B depletion on gelatin degradation capacity (n = 5). (H) Left panel: The impact of MYO1B depletion on the metastatic capacity of NB cells (luciferase-expressing Kelly cells) was evaluated using the chick embryo chorioallantoic membrane (CAM) metastasis model. Right upper panel: Metastasis burden was measured by bioluminescent intensity (BLI) in each embryo; right lower panel: BLI over 5 × 10⁵ was regarded as high metastasis burden. (I) The impact of MYO1B depletion on NB cell (Kelly) morphology was determined by actin cytoskeleton staining using phalloidin, and the aspect ratio and circularity were assessed using ImageJ software. Differences between groups were determined by two-tailed unpaired Student’s t test. *P < 0.05, **P < 0.01, ***P < 0.001. Fisher’s exact test was used to determine the associations between two categorical variables in two groups. Log-rank test was used in Kaplan-Meier survival analysis.
Fig. 5.
Fig. 5.. Identification of MYO1B, an important regulator of secretome reprogramming in NB.
(A) Colocalization of MYO1B with cytoskeletal structures on NB cell surface was evaluated by confocal microscopy. (B) Schematic showing the procedures for global secretome evaluation by pSILAC-Click (i.e., pulsed stable isotope labeling with amino acids in cell culture, or pSILAC, combined with Click chemistry) and mass spectrometry (MS). (C) Global secretome changes upon MYO1B depletion determined by pSILAC-Click described in the procedures in (B) (n = 3 independent replicates). (D) Gene set enrichment analysis on proteins commonly up-regulated or down-regulated by MYO1B depletion in the secretome of NB19 and Kelly cells. (E) Percentage of extracellular vesicle (EV)–associated proteins present in the NB secretome that were found increased or decreased by MYO1B depletion. (F) Global proteome changes upon MYO1B depletion were determined by mass spectrometry in both Kelly and NB19 cells (n = 3 independent replicates). (G) Comparison of global secretome and proteome changes affected by MYO1B depletion in NB cells. Note that the scales on x and y axes in each plot are identical. Fisher’s exact test was used to determine the associations between two categorical variables in two groups.
Fig. 6.
Fig. 6.. MIF secretion enhanced by MYO1B promotes NB cell invasion and metastasis.
(A) Evaluation of MIF concentrations by ELISA in unprocessed conditioned medium (CM) from the indicated siRNA-transfected Kelly cells (n = 4). (B and C) Impact of filtration by filters with 100 kDa or 20-nm pore sizes (B) or RIPA + sonication treatment (C) on MIF concentrations in CM samples from Kelly cells (n = 4). (D) Impact of MIF or MYO1B depletion on MIF concentrations in RIPA + sonication–treated CM samples from Kelly cells (n = 3). (E) Colocalization of MIF with MYO1B in Kelly cells was evaluated by IF confocal microscopy. (F and G) Impact of MIF or MYO1B depletion ± recombinant MIF (rMIF) treatment on cell invasion through Matrigel was evaluated by Incucyte (n = 5 to 8). (H and I) Impact of MIF depletion on the extravasation (H) and metastatic capacity (I) of luciferase-expressing Kelly cells was evaluated using the chick embryo CAM metastasis model. The metastasis burden was measured by BLI. Differences between groups were determined by two-tailed unpaired Student’s t test. *P < 0.05, **P < 0.01, ***P < 0.001.

References

    1. J. M. Maris, Recent advances in neuroblastoma. N. Engl. J. Med. 362, 2202–2211 (2010). - PMC - PubMed
    1. C. U. Louis, J. M. Shohet, Neuroblastoma: Molecular pathogenesis and therapy. Annu. Rev. Med. 66, 49–63 (2015). - PMC - PubMed
    1. K. K. Matthay, J. M. Maris, G. Schleiermacher, A. Nakagawara, C. L. Mackall, L. Diller, W. A. Weiss, Neuroblastoma. Nat. Rev. Dis. Primers 2, 16078 (2016). - PubMed
    1. G. M. Brodeur, R. C. Seeger, M. Schwab, H. E. Varmus, J. M. Bishop, Amplification of N-myc in untreated human neuroblastomas correlates with advanced disease stage. Science 224, 1121–1124 (1984). - PubMed
    1. S. L. Cohn, A. D. J. Pearson, W. B. London, T. Monclair, P. F. Ambros, G. M. Brodeur, A. Faldum, B. Hero, T. Iehara, D. Machin, V. Mosseri, T. Simon, A. Garaventa, V. Castel, K. K. Matthay; INRG Task Force , The International Neuroblastoma Risk Group (INRG) classification system: An INRG Task Force report. J. Clin. Oncol. 27, 289–297 (2009). - PMC - PubMed

Substances