. 2023 Aug 25;9(34):eadd3643.
doi: 10.1126/sciadv.add3643. Epub 2023 Aug 23.

Nitrogen-15 dynamic nuclear polarization of nicotinamide derivatives in biocompatible solutions

Affiliations

Nitrogen-15 dynamic nuclear polarization of nicotinamide derivatives in biocompatible solutions

Josh P Peters et al. Sci Adv. .

Abstract

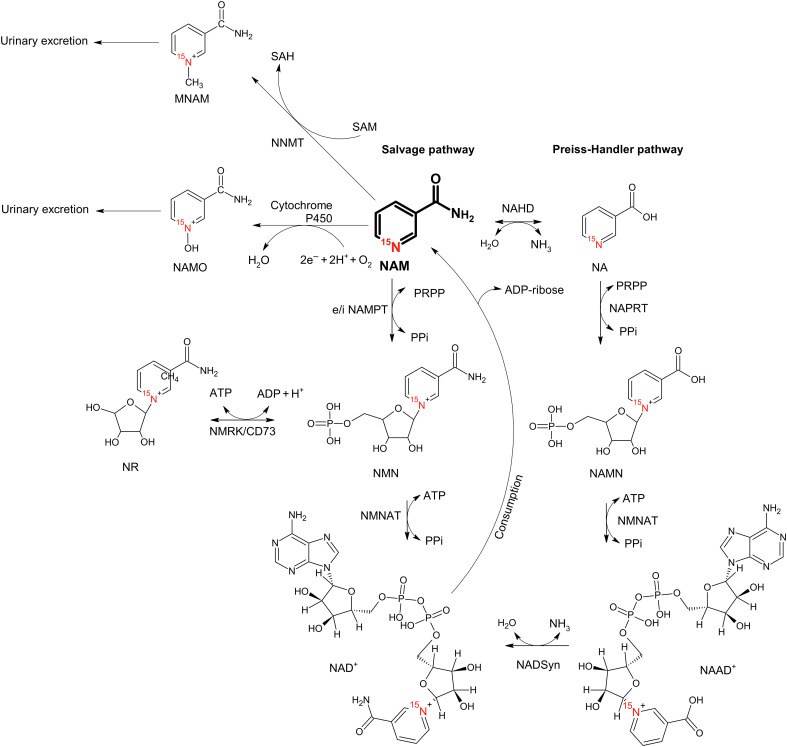
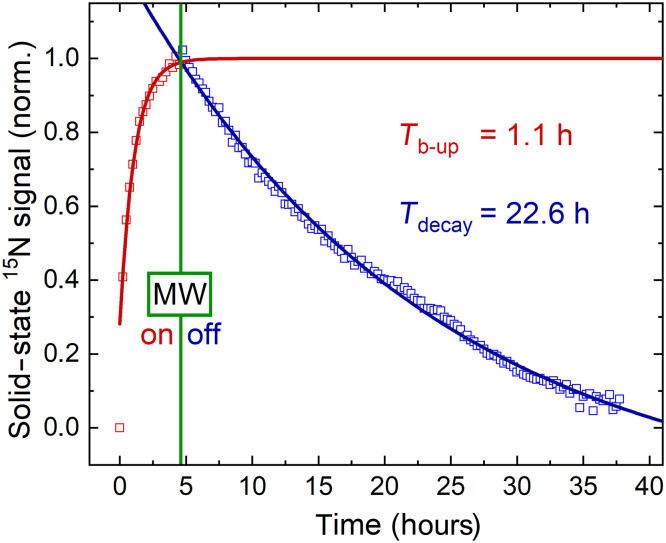
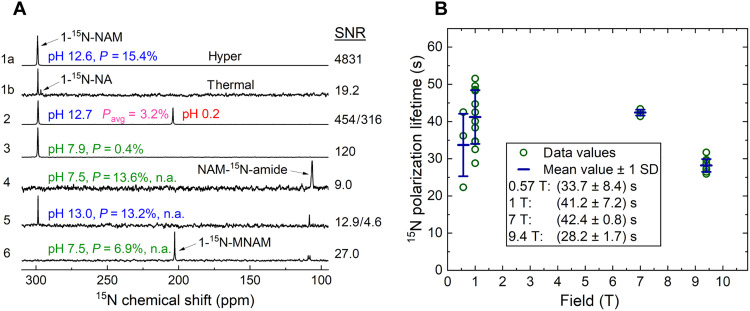
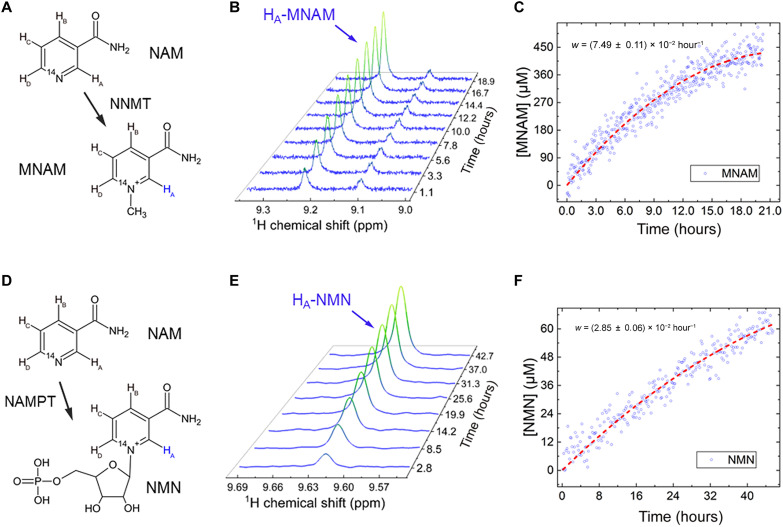
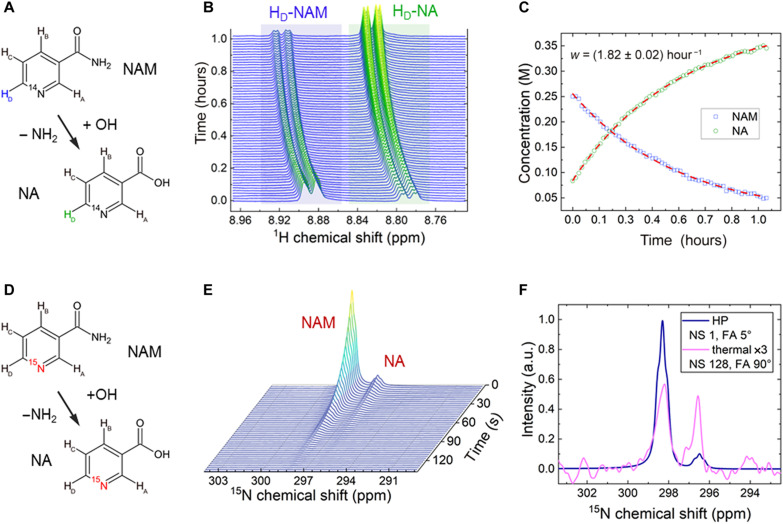
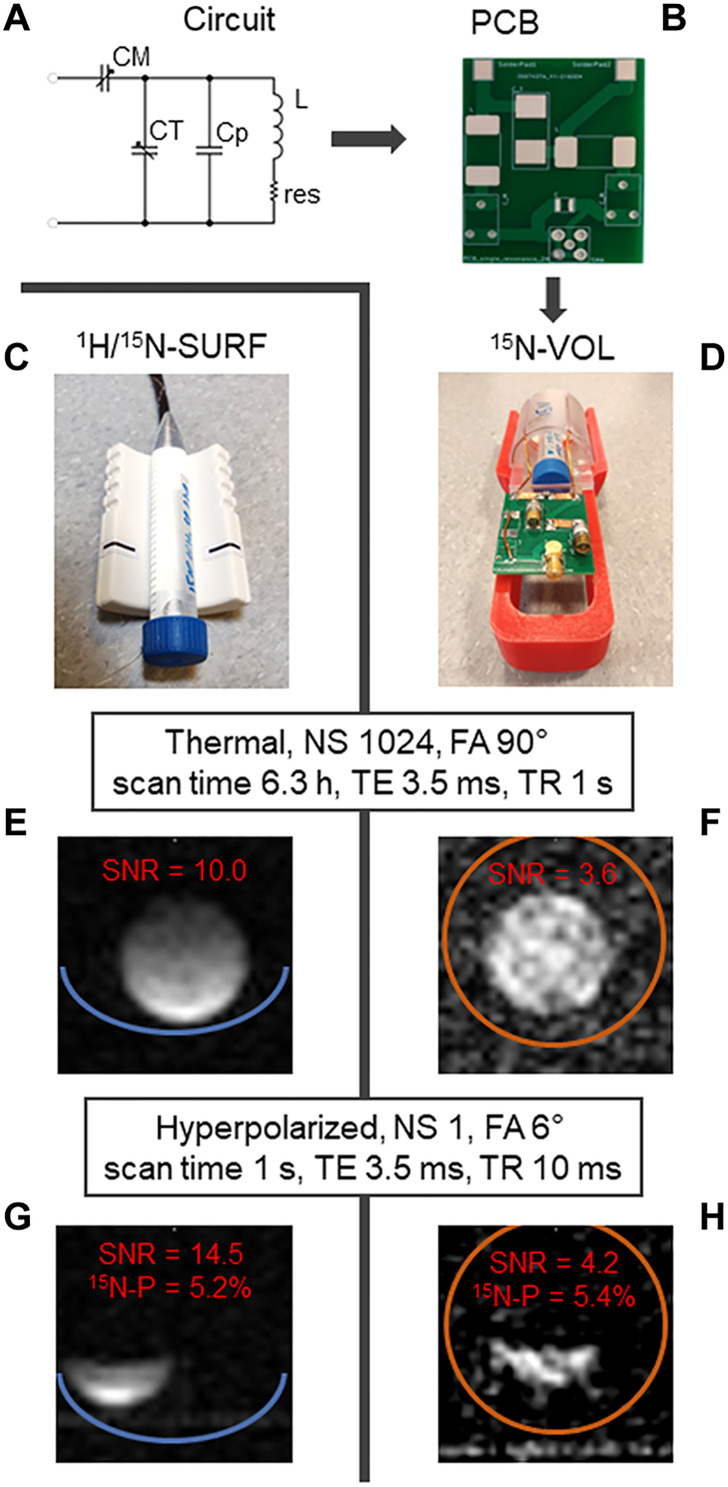
Dissolution dynamic nuclear polarization (dDNP) increases the sensitivity of magnetic resonance imaging by more than 10,000 times, enabling in vivo metabolic imaging to be performed noninvasively in real time. Here, we are developing a group of dDNP polarized tracers based on nicotinamide (NAM). We synthesized 1-15N-NAM and 1-15N nicotinic acid and hyperpolarized them with dDNP, reaching (13.0 ± 1.9)% 15N polarization. We found that the lifetime of hyperpolarized 1-15N-NAM is strongly field- and pH-dependent, with T1 being as long as 41 s at a pH of 12 and 1 T while as short as a few seconds at neutral pH and fields below 1 T. The remarkably short 1-15N lifetime at low magnetic fields and neutral pH drove us to establish a unique pH neutralization procedure. Using 15N dDNP and an inexpensive rodent imaging probe designed in-house, we acquired a 15N MRI of 1-15N-NAM (previously hyperpolarized for more than an hour) in less than 1 s.


Figures

Fig. 1.
Fig. 1.. Metabolic pathways of NAM metabolism.
NAM (bold) is at the crossroads of four enzymatic reactions. The salvage pathway describes the re-creation of NAD from NAM, and the consumption of NAD produces NAM as residue (34). As an alternative, NR can be produced from NMN instead of NAD (97). NAM is mainly excreted through MNAM (98) and NAMO (99). In addition, NAM can be interconverted to NA by NAHD for the subsequent conversion to NAAD via the Preiss-Handler pathway (100). Molecules: NAM, nicotinamide; NA, nicotinate; NMN, NAM mononucleotide; NR, NAM riboside; NAMN, NA mononucleotide; NAMO, NAM N-oxide; MNAM, 1-methyl NAM; NAAD, NA adenine dinucleotide; NAD, NAM adenine dinucleotide. All molecules are labeled with 15N in the pyridine ring. Cofactors: SAM, S-adenosyl methionine; SAH, S-adenosyl-l-homocysteine; PRPP, phosphoribosyl pyrophosphate; Ppi, inorganic pyrophosphate; ADP, adenosine diphosphate; ATP, adenosine triphosphate. Enzymes: NAHD, NAM amidohydrolase; NNMT, NAM N-methyltransferase; NAMPT, extra- and intracellular (e/i) NAM phosphoribosyltransferase; NAPRT, NA phosphoribosyltransferase; NMNAT, NAM mononucleotide adenylyltransferase; NADSyn, NA adenine dinucleotide synthetase; NMRK, NAM riboside kinase; CD73, 5′-nucleotidase.
Fig. 2.
Fig. 2.. Solid-state 15N polarization buildup and decay after MW irradiation at 6.7 T and 1.4 K.
The polarization buildup (Tb-up, red squares) was monitored for ≈5 hours during DNP and the signal decay (Tdecay, blue squares) for 30 hours thereafter using a 3° RF excitation every 15 min. A monoexponential fit (solid lines) yielded a buildup time of 1.1 hours (red line) and a solid-state polarization decay of 25.8 or 22.6 hours, whether corrected for excitations or not (Eq. 3).
Fig. 3.
Fig. 3.. Effect of pH on liquid-state hyperpolarization of NAM and MNAM at 9.4 T and relaxation time of NAM in 0.57- to 9.4-T range of magnetic fields.
(A) A strong hyperpolarized 1-15N-NAM signal was observed at basic pH and quantified to ≈15% (1a and 1b). Adding the basic solution to a buffer inside the NMR tube with insufficient sample mixing resulted in two phases with different pH and different 1-15N-NAM resonances with an average polarization of 3.2% (2). When the sample was more rigorously (and longer) mixed, a neutral pH solution with a much-reduced polarization of 1-15N-NAM 0.4% was achieved (3). Repeating the experiment with natural abundance NAM in deuterated neutral DM showed no 1-15N polarization but strong 15N-amide polarization of 13.6% (4), while using protonated basic DM yielded both 1-15N and 15N-amide resonances well polarized (5). A promising agent is MNAM which yielded high polarization ≈ 7% in neutral DM (6): T1 was short for 15N-amide (≈7.2 s) and long for 1-15N-MNAM (85.1 s). Spectra were obtained 17 to 21 s after dissolution without neutralization and up to 30 s with neutralization. For (1b), 64 transients were acquired using a 90° FA, 101 linear receiver gain (RG). For (6), one transient was acquired using a 10° FA and RG of 101. All other spectra were acquired using 5° FA, RG of 10 in a single scan that should be considered for calculating polarization. (B) Lower magnetic fields (down to 1 T) resulted in a longer liquid-state hyperpolarization: T1(0.57 T) = (33.7 ± 8.4) s, T1(1 T) = (41.2 ± 7.2) s, T1(7 T) = (42.4 ± 0.8) s, and T1(9.4 T) = (28.2 ± 1.7) s. Variation in T1 was higher at lower fields, which we attributed to varying amounts of paramagnetic impurities or pH.
Fig. 4.
Fig. 4.. Chemical transformation of NAM to MNAM and NMN observed with 1H NMR.
NNMT-induced conversion of NAM into MNAM (A to C) was monitored with 1H NMR in situ at 9.4 T over a 21-hour period, revealing a conversion rate of w = k[NAM][NNMT] = (2.30 ± 0.05) × 10−5 s−1 NAM (fit—dashed red line, eq. S3) and rate constant of kNNMT = (2.36 ± 0.05) × 10−5 s−1per mg/ml of enzyme and mM of NAM [TR = 10 s, 800 transients (~2.2 hours) were averaged for each spectrum (B) and 16 transients (~2.7 min) for each data point (C)]. Conversion was estimated to be around 5% with an estimated enzyme degradation of ~21.4% during the experiment. In total, around 171 μg of NNMT (SRP6282) was added to 465 μl of 43.2 mM Trizma buffer with 9.0 mM NAM with 9.0 mM S-(5′-adenosyl)-l-methionine chloride (SAM). (D) NAMPT-induced conversion of NAM into NMN (E and F) was monitored with 1H NMR over a 45.5-hour period, revealing a conversion rate of w = k[NAM][NAMPT] = (8.24 ± 0.23) × 10−6 s−1 (fit—dashed red line, eq. S3) and a rate constant of kNAMPT = (9.95 ± 0.27) × 10−6 s−1 per mg/ml of enzyme and mM of NAM [TR = 10 s, 2048 transients (~5.7 hours) were averaged for each spectrum (E) and 64 transients (10.7 min) for each data point (F)]. The conversion was estimated to be around 0.7%, with an estimated enzyme degradation of ~44.7% during the experiment. In total, approximately 50 μg of NAMPT (SRP0514) was added to 535 μl of 44.1 mM Trizma buffer with 9.2 mM NAM, 17.7 mM phosphoribosyl pyrophosphate, and 8.7 mM adenosine triphosphate.
Fig. 5.
Fig. 5.. Chemical transformation of NAM to NA observed at thermal equilibrium and hyperpolarized states.
Almost complete conversion of NAM into NA [(A and B) spectra and (C) integrals of HD signals] was observed for NAM, with an initial concentration of 0.25 M at a pH of 13.7. The kinetics was fit with the exponential decay functions with the shared time T of (33.0 ± 0.4) min (red dashed lines). The chemical shift changed due to a decrease in pH throughout the reaction. Adding NaOH to the concentrate before DNP initiated the transformation of NAM to NA (D). As a result, both NAM and NA were readily hyperpolarized and yielded T1 of 23.2 s for 1-15N-NAM and 25.3 s for 15N-NA at 9.4 T and pH of 12.5 (E). (F) Different signal ratios of NAM/NA at the stage of hyperpolarization (blue) versus at thermal equilibrium after dissolution and following 3 hours of signal averaging (pink) indicate ongoing conversion from NAM to NA. a.u., arbitrary units.
Fig. 6.
Fig. 6.. 15N-MRI probes with phantoms and corresponding thermally and hyperpolarized images.
A circuit design (A), corresponding printed circuit board (PCB) without circuit elements (B), assembled 15N-volume coil (15N-VOL; D), and surface (1H/15N-SURF; C) are shown. Corresponding thermal (E and F) and hyperpolarized images (G and H) demonstrated a 2.8 times higher SNR but much less homogeneous image of 1H/15N-SURF compared to 15N-VOL. 15N-spectroscopy is also possible for 1-15N-NAM (fig. S12). 15N MRI images of 0.8 M 15NH4 model solution at thermal equilibrium (E and F) measured with FLASH as follows: TE = 3.5 ms, TR = 1 s, NS = 1024, scan time = 6.3 hours, FOV = 27 mm × 27 mm, matrix size = 32 × 32, slice thickness = 30 mm, FA = 90°, and RF frequency = 17 ppm. Subsequent 15N-MRI of hyperpolarized 15N-NAM (G and H) measured with FLASH as follows: TE = 3.5 ms, TR = 10 ms, NS = 1, nominal FA = 5°, RF frequency = 300 ppm, scan time = 1 s, image size = 32 × 32, slice thickness = 30 mm, and FOV = 32 mm × 32 mm. Right before transferring the hyperpolarized media to the MRI (G and H), 500 μl of the hyperpolarized media was taken to perform quantification of polarization at the high-resolution 9.4-T NMR spectrometer as described previously. Acquisition of NMR spectra for quantification of polarization happened 20 to 30 s after dissolution, as did the acquisition of MRI.

Similar articles

Cited by

References

    1. Grundy S. M., Pre-diabetes, metabolic syndrome, and cardiovascular risk. J. Am. Coll. Cardiol. 59, 635–643 (2012). - PubMed
    1. Kishnani P. S., Howell R. R., Pompe disease in infants and children. J. Pediatr. 144, S35–S43 (2004). - PubMed
    1. Liberti M. V., Locasale J. W., The Warburg effect: How does it benefit cancer cells? Trends Biochem. Sci. 41, 211–218 (2016). - PMC - PubMed
    1. DeBerardinis R. J., Chandel N. S., Fundamentals of cancer metabolism. Sci. Adv. 2, e1600200 (2016). - PMC - PubMed
    1. Haase A., Frahm J., Matthaei D., Hänicke W., Merboldt K.-D., FLASH imaging: Rapid NMR imaging using low flip-angle pulses. J. Magn. Reson. 213, 533–541 (1986). - PubMed